Bitcoin Bulls Spot Ascending Triangle—Is $100K the Next Stop?

Technical traders are belting out chart-pattern anthems as Bitcoin forms a textbook ascending triangle. The setup typically breaks bullish—just in time for Wall Street’s ’risk-on’ summer mood.
Key levels to watch: A clean breakout above $72k could trigger algorithmic buying frenzies, while failure to hold $68k might see hedge funds flip bearish faster than a Coinbase server crash.
Bonus jab: Meanwhile, traditional finance still can’t decide if crypto is ’digital gold’ or a ’speculative asset’—depends which quarter their earnings report needs padding.
Triangle thrust playing out – But caution ahead
The breakout abovehas likely kicked off the, which often travels fast and sharp. But as we approach, traders should be cautious. This is a, and a pullback from here could send prices back toward the.
Iffails to hold, the structure could stretch deeper into, calling for a.
Global correlation still alive?
Interestingly, Bitcoin’s movement continues to correlate with global indices. As Bitcoin tests resistance,are also approaching key zones. Could this be another, or are we nearing a short-term top?
-
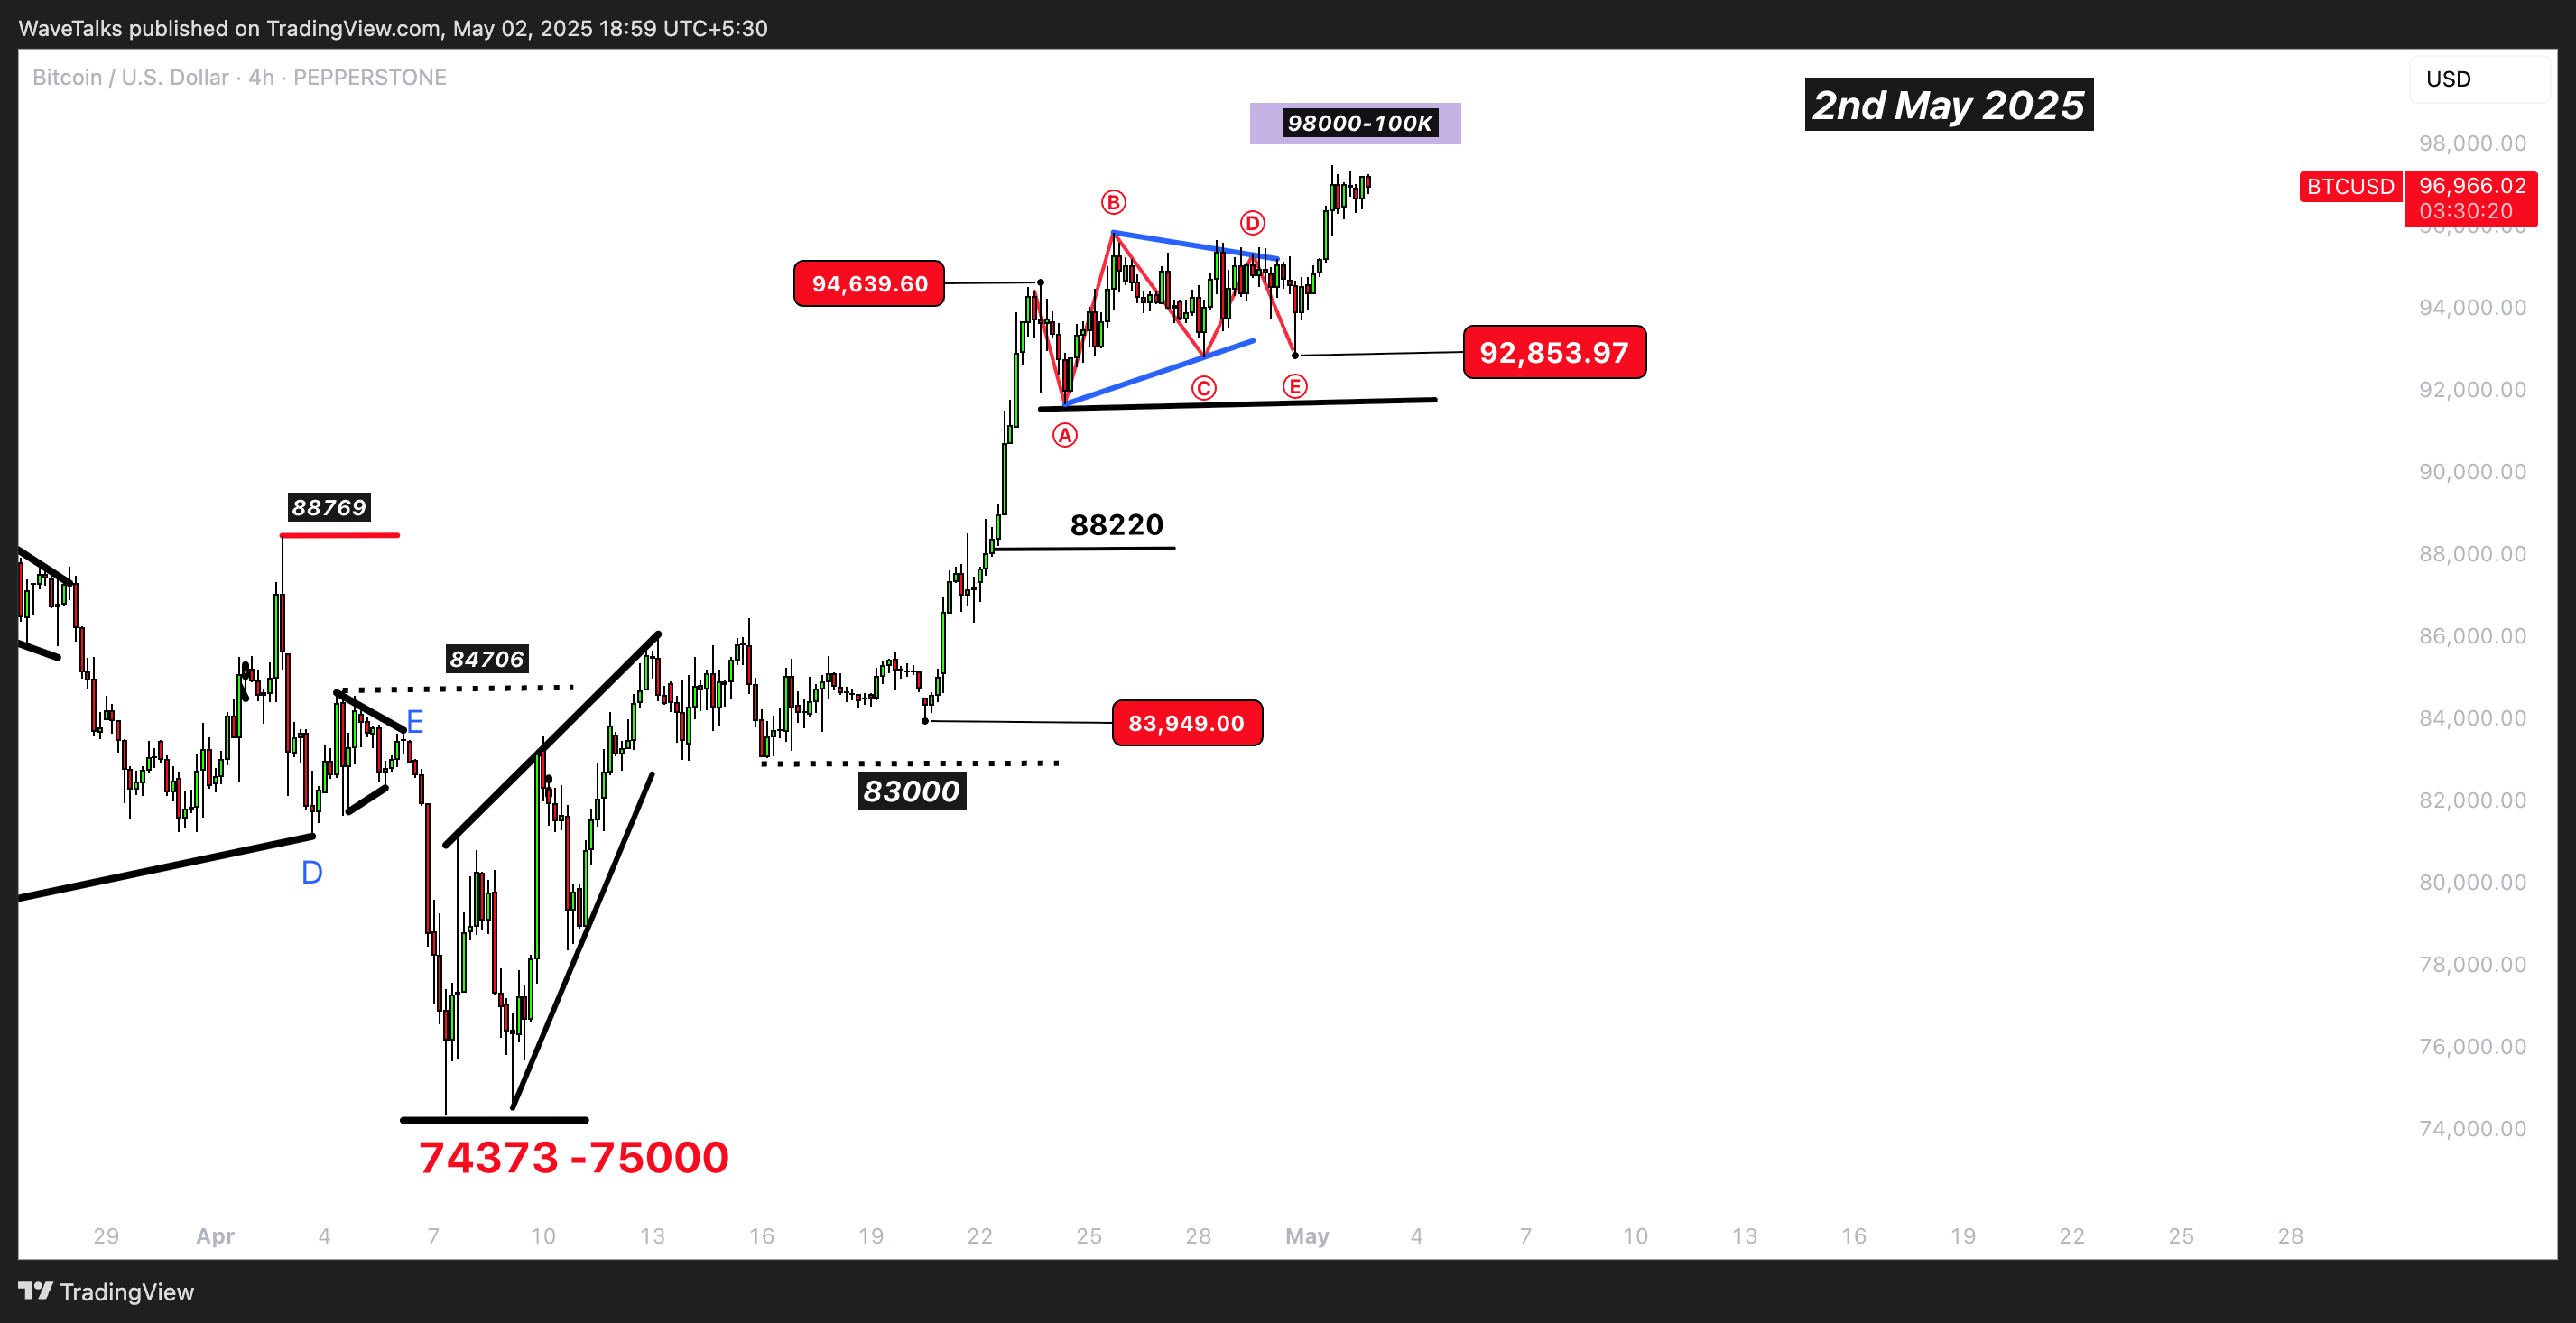
92.8K: E-wave bottom (confirmed).
-
95K: Previous breakout trigger.
-
98K–100K: Immediate resistance zone. Reversal possible here.
-
90K–92K: Pullback support zone. If broken, watch 88K next.
-
Above 102K–109K: Only if the thrust extends with strong momentum.
The triangle played out well. Now Bitcoin stands at the edge of the sky, singing its bullish tune. But traders beware—the.

Log in to Reply
Log in to comment your thoughtsComments
Related Articles
|Square
Get the BTCC app to start your crypto journey
Get started today Scan to join our 100M+ users