Sonic Bulls Charge Toward New Highs as TVL Hits Record Peak

Sonic’s price action shows bullish momentum as Total Value Locked (TVL) smashes previous records. Traders eye the next breakout level while DeFi degens FOMO into the ecosystem—because nothing says ’sound investment’ like chasing an asset after a 200% pump.
Sonic TVL, open interest and chain fees hit a new all-time high
Data from crypto intelligence tracker DefiLlama shows that S’s TVL increase reached a new all-time high (ATH) of $1.54 billion on Friday. This increase in TVL indicates growing activity and interest within the Sonic ecosystem, suggesting that more users are depositing or utilizing assets within S-based protocols.
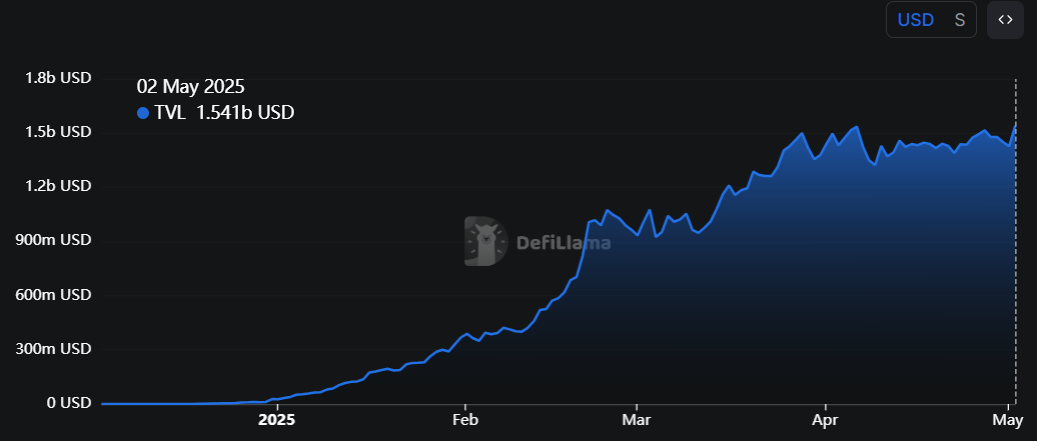
S TVL chart. Source: DefiLlama
Another factor bolstering the platform’s bullish outlook is a recent surge in traders’ interest and liquidity on the S chain, which generated chain fees of $37,750 on Thursday, marking a new ATH.
Additionally, its stablecoin market capitalization has been steadily rising since mid-April and currently stands at $538.20 million as of Friday. Such stablecoin activity and value increase on the S project indicate a bullish outlook, as they boost network usage and can attract more users to the ecosystem, driven by Decentralized Finance (DeFi) and payment use cases.
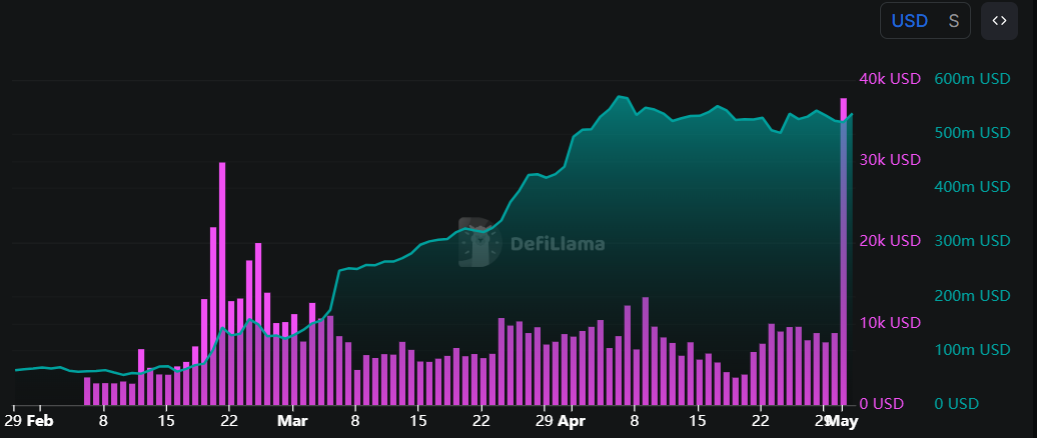
S chain fees and stablecoins market cap chart. Source: DefiLlama
Sonic’s Open Interest (OI) further supports the bullish outlook. Coinglass’s data shows that the futures’ OI in S at exchanges ROSE from $94.22 million on Thursday to $140.32 million, a new ATH, on Friday. An increasing OI represents new or additional money entering the market and new buying, which should contribute to a price increase.
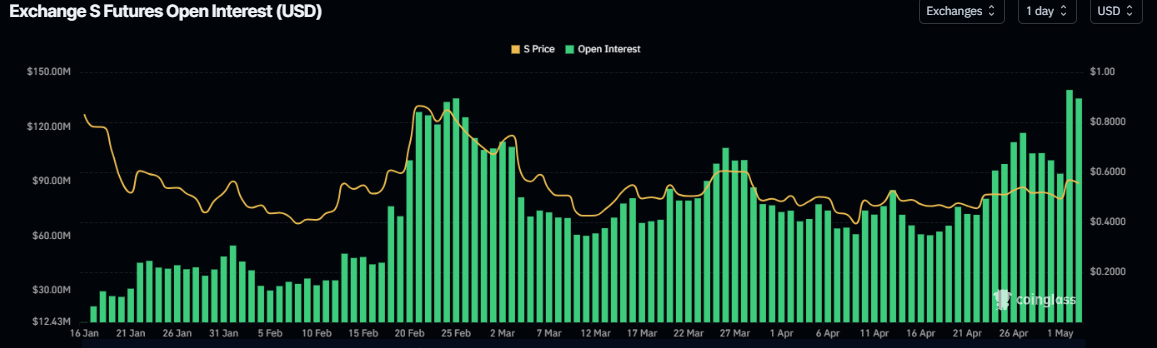
S open interest chart. Source: Coinglass
Sonic Price Forecast: S bulls aim for $0.61 if support holds strong
Sonic price broke above its daily resistance level at $0.55 and rallied more than 15% on Thursday. At the time of writing, it trades slightly down from this level.
If the $0.55 level holds, S could extend a rally toward the next resistance level at $0.61. A successful close above this could extend additional gains toward $0.68, the 50% Fibonacci retracement level drawn from the February high of $0.99 to the April low of $0.37.
The Relative Strength Index (RSI) on the daily chart reads 57, above its neutral level of 50, indicating bullish momentum. The MACD indicator also displayed a bullish crossover last week, providing buy signals and indicating a potential continuation of the upward trend.
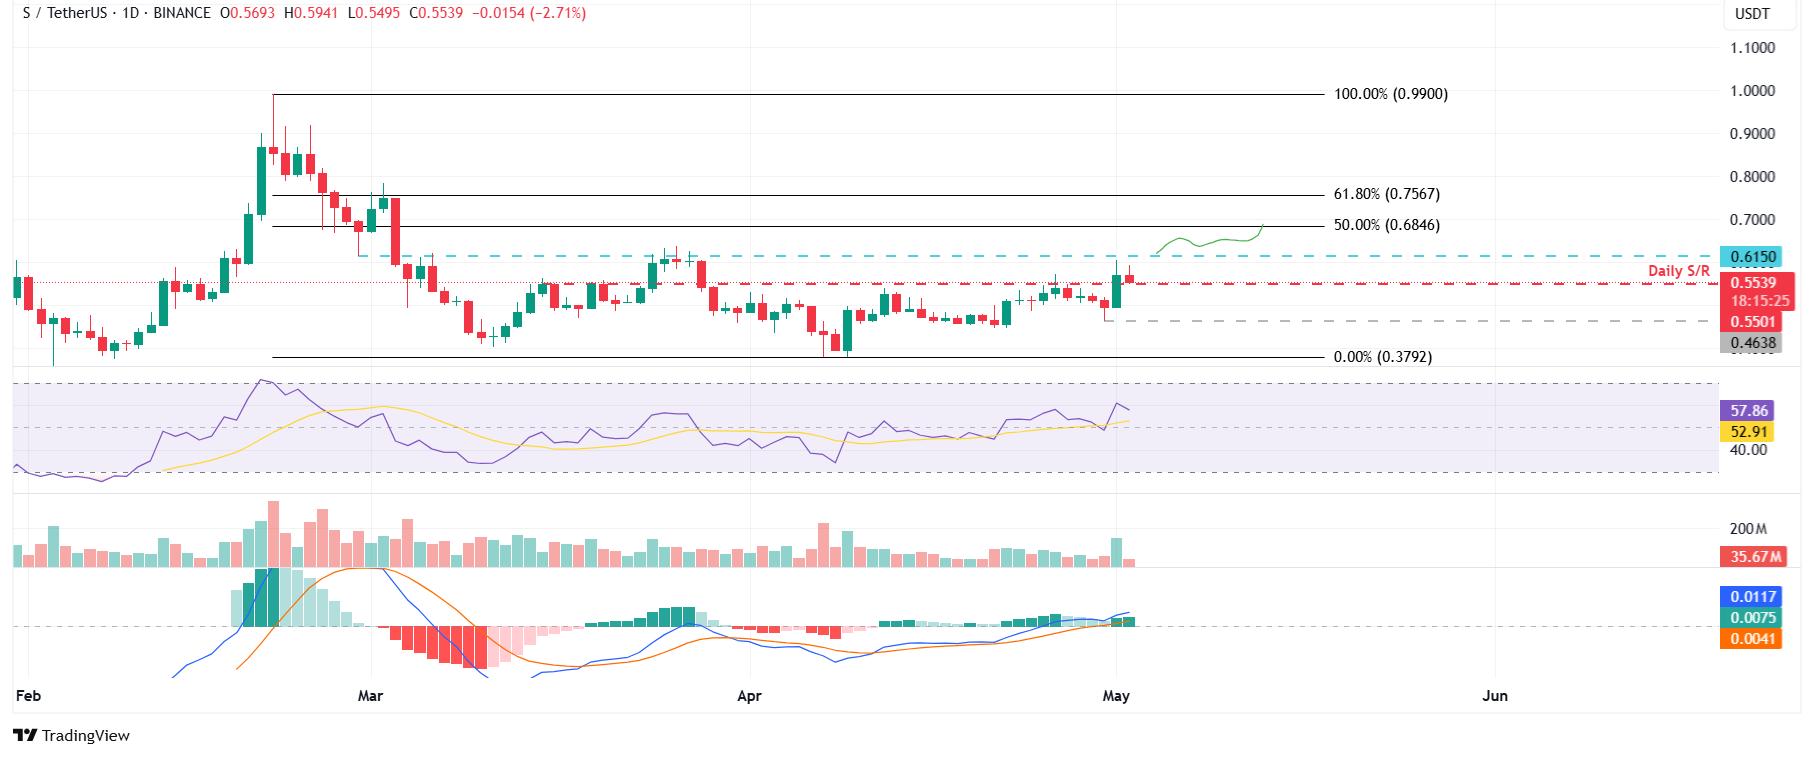
S/USDT daily chart
However, if S fails to find support around $0.55, it could extend the decline to retest its Wednesday low of $0.46.
