Bitcoin and Nifty Form Symmetrical Triangles – Breakout Imminent?

Technical charts flash a rare pattern: Both Bitcoin and India’s Nifty50 index are tracing near-identical symmetrical triangles—a classic consolidation signal before explosive moves.
Market whispers suggest institutional players are quietly building positions on both assets. Bitcoin’s triangle apex aligns with its halving cycle, while Nifty’s pattern emerges amid election volatility.
Will the twin patterns trigger synchronized breakouts? Or is this just another case of traders seeing shapes in the financial Rorschach test? (Spoiler: Wall Street analysts will claim they predicted it either way.)
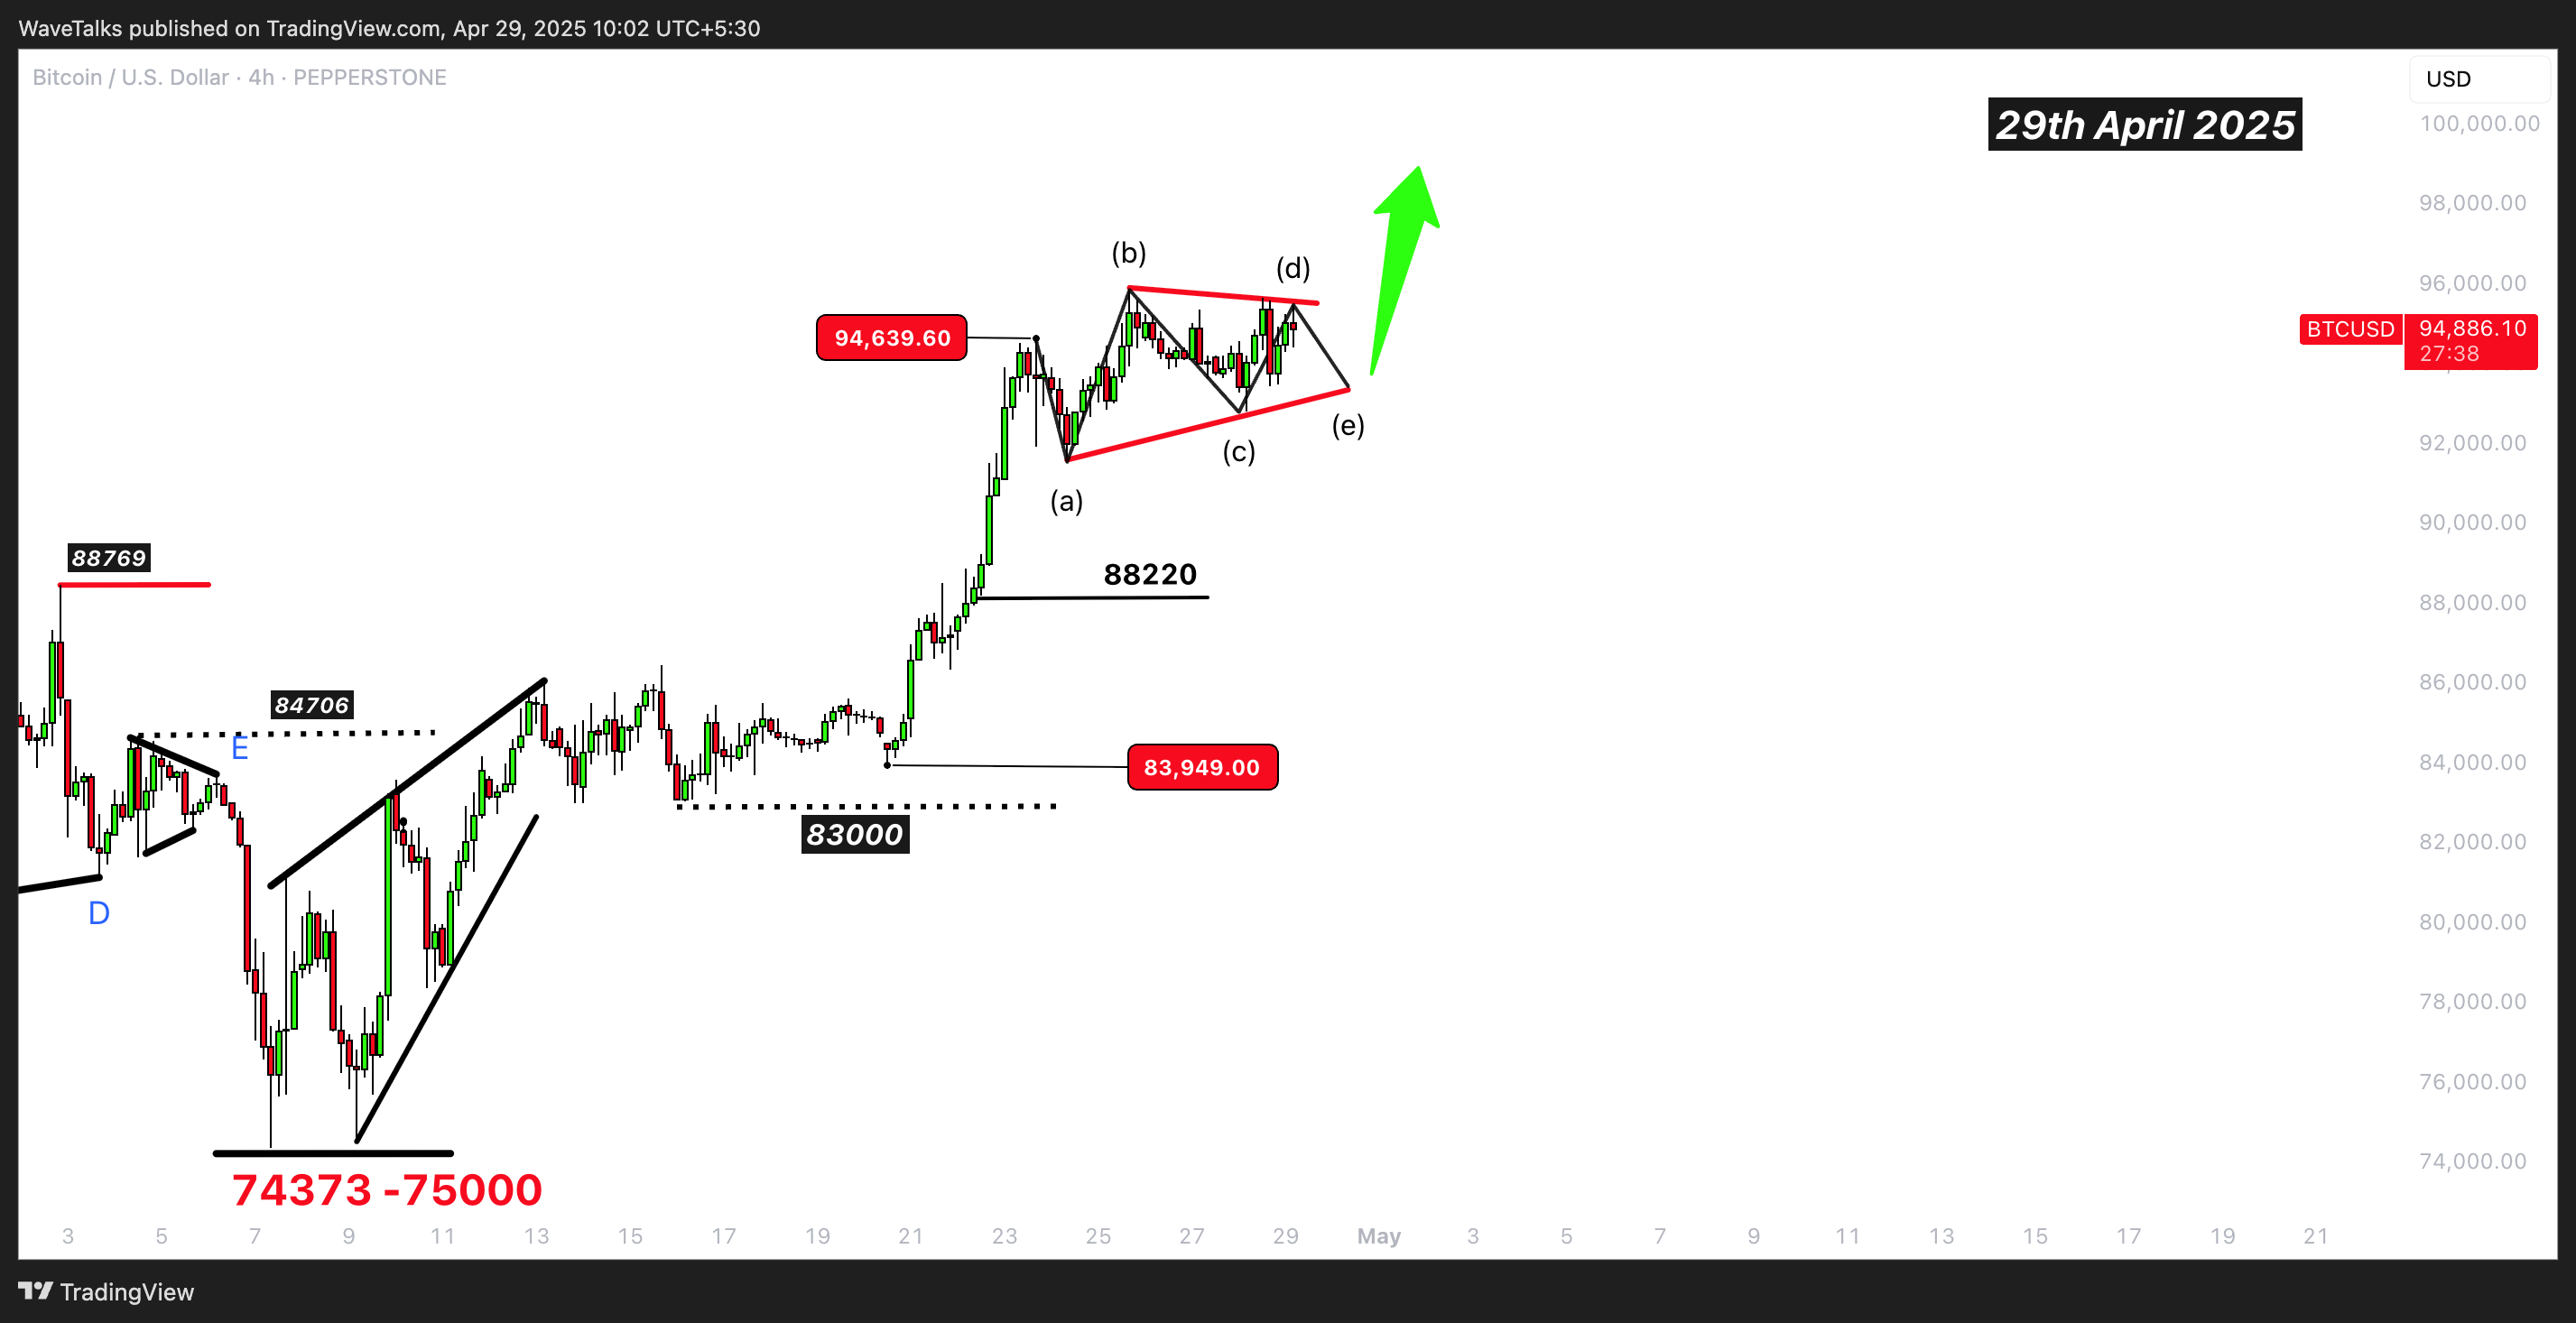
Triangle unfolding – Just waiting for the break?
The current consolidation betweenis starting to resemble a , withmarked near. A cleancould trigger a—targeting, then possibly.
Nifty echoes the same setup?
India’sis mirroring this pattern. After a steep drop last Friday due to geopolitical tension, it, just as we discussed earlier. Now, heading into, Nifty looks poised for a breakout—. 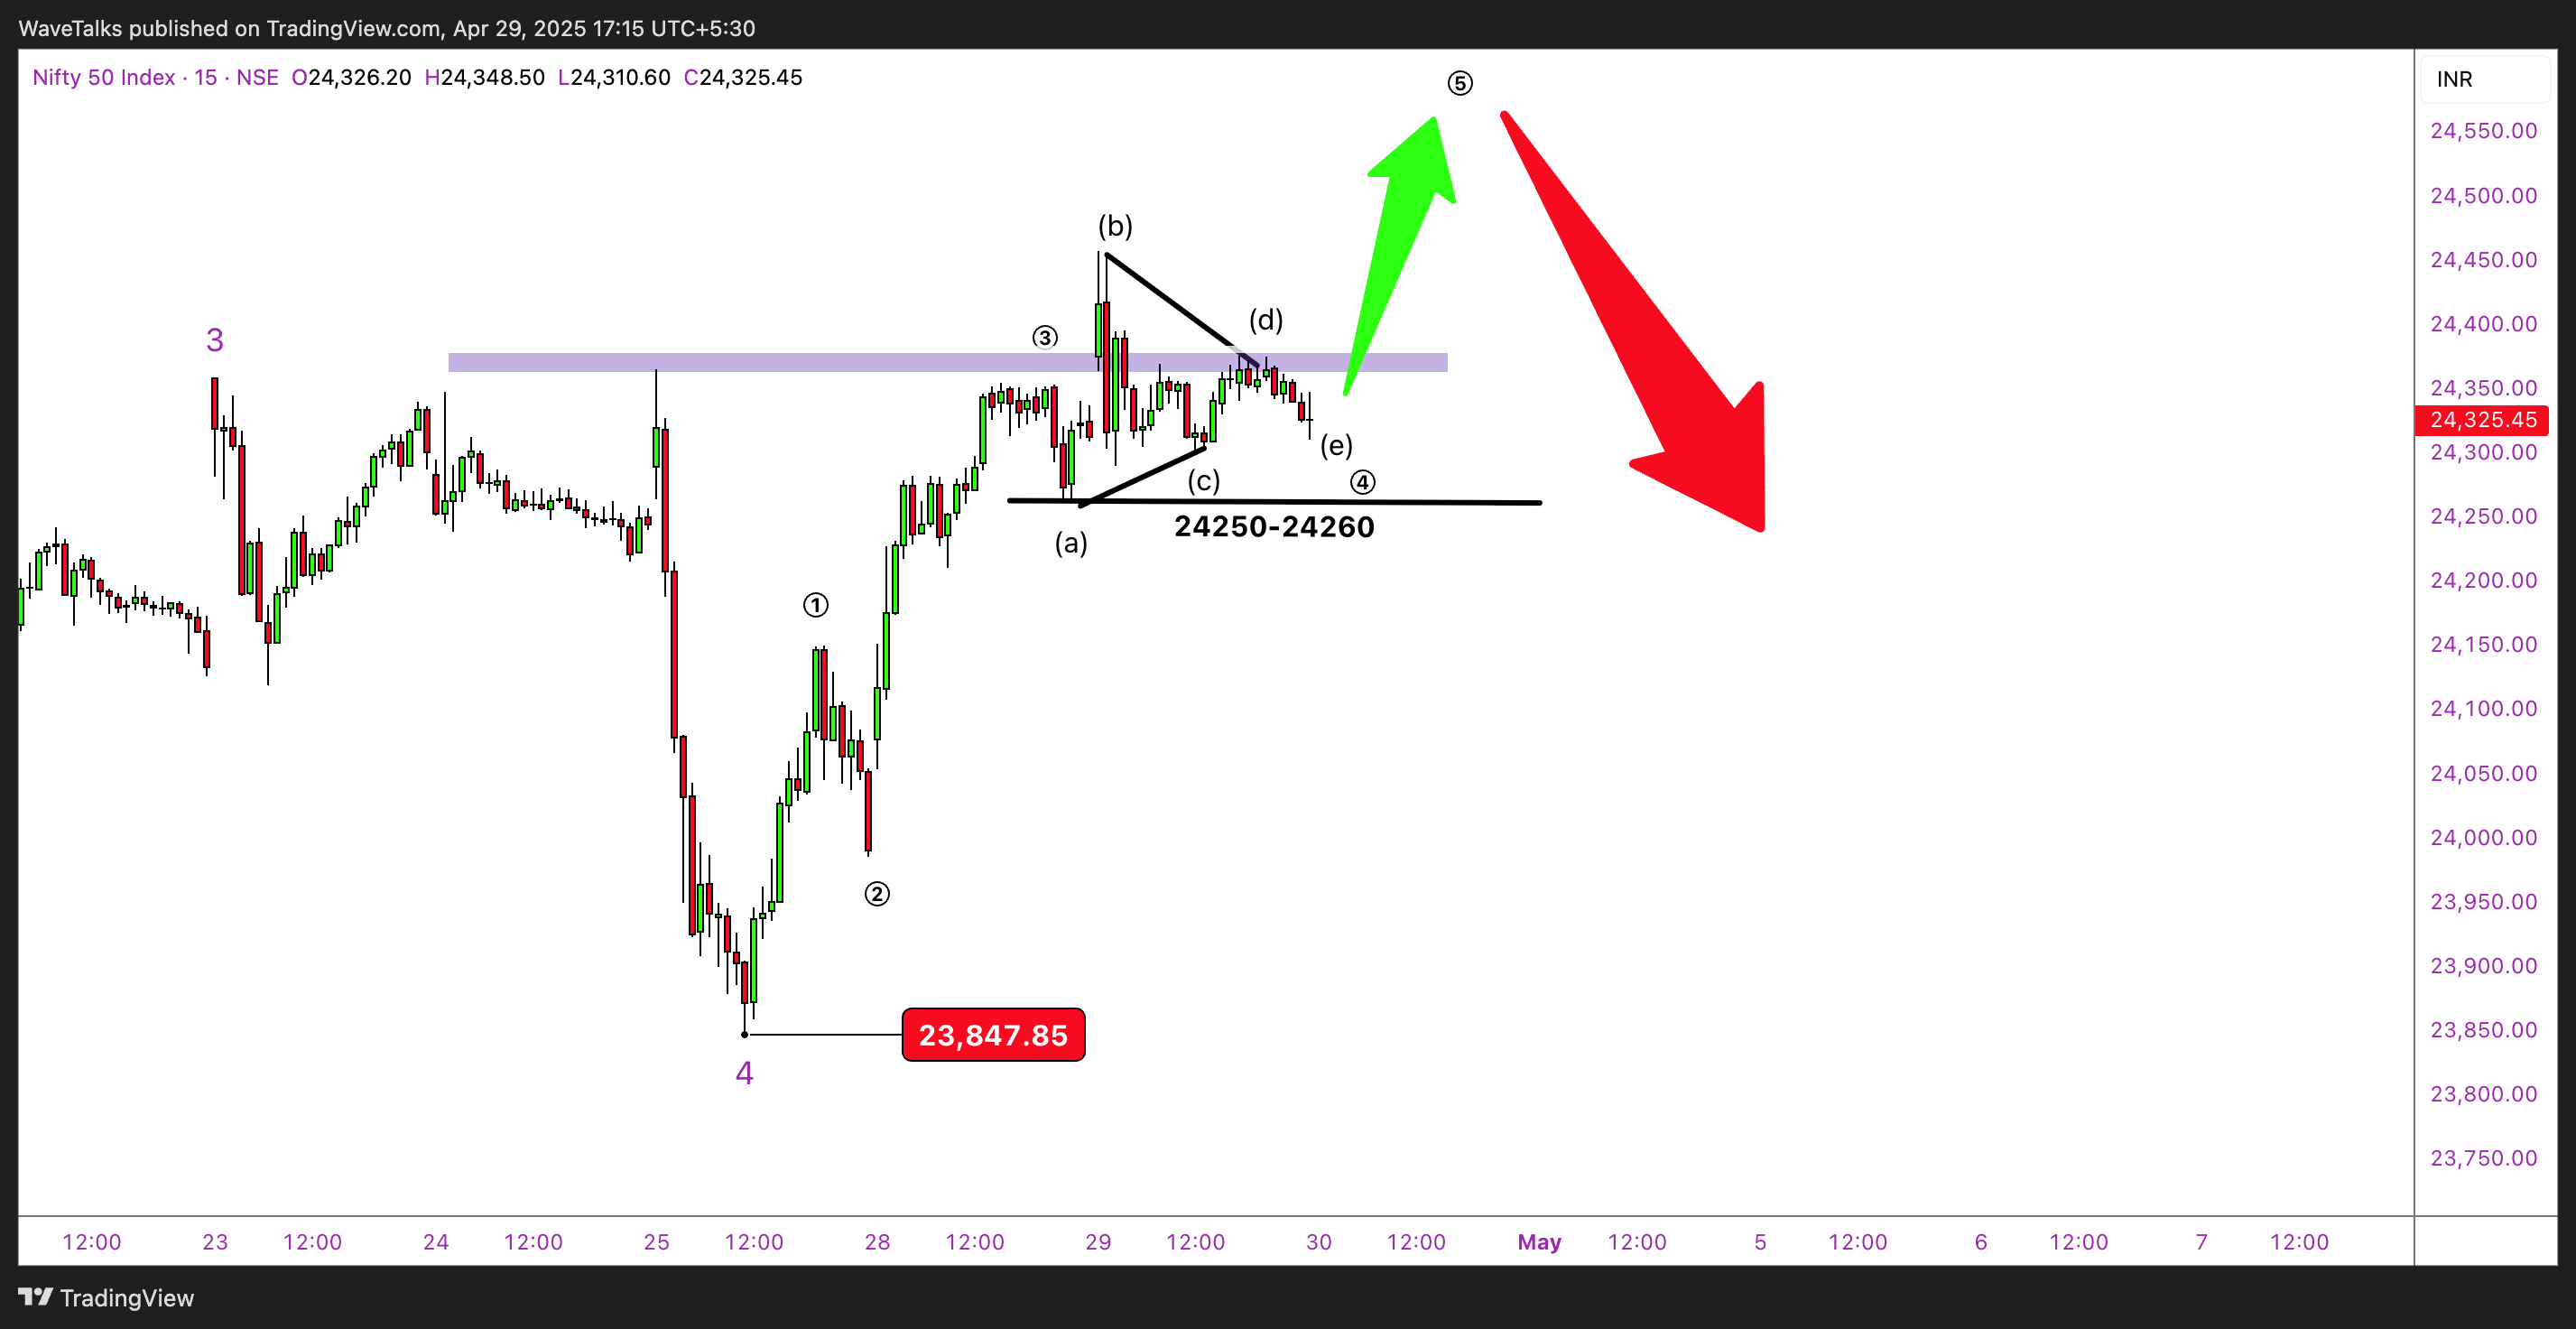
Which market blinks first?
The similarity in structures is striking—. Will, or willand break higher first?
-
91K–93K: Active triangle zone.
-
95K: Breakout trigger.
-
98K–100K–102K–109K: Resistance targets on upside thrust.
-
88K–90K: Must-hold zone for bulls. Below this, structure weakens.
—a possible breakout from triangle structures. Watch closely. If one moves, the other may follow.

Log in to Reply
Log in to comment your thoughtsComments
Related Articles
|Square
Get the BTCC app to start your crypto journey
Get started today Scan to join our 100M+ users