XRP Whales Gobble Tokens as Exchange Reserves Dry Up—Can Ripple’s Price Defy Gravity?

Ripple’s XRP sees bizarre divergence: whale wallets balloon while exchange inflows crater. The coin clings to key support—but with the SEC lawsuit still looming like a bad hangover, traders wonder if this is accumulation... or just another dead-cat bounce. (Because in crypto, ’fundamentals’ are just astrology for finance bros.)
Can whale accumulation revive XRP’s bullish momentum?
As XRP consolidates, signaling market indecision, whale activity per Santiment data paints a different picture. Addresses with between 10 million and 100 million XRP (black line) show a steady increase, peaking around 11.83% of the total supply on Thursday from 10.91% on April 1. This implies consistent accumulation despite growing macroeconomic risks.
Similarly, addresses holding more than 1 billion tokens (red line) have gradually increased their share. This whale cohort currently accounts for 39.37% of the total supply, compared to 37.67% towards the end of March.
%20%5B05-1745297501971.46.22,%2022%20Apr,%202025%5D.png)
XRP Supply Distribution | Source: Santiment
Both whale cohorts have a high-risk appetite for XRP, possibly betting on the price increasing in the coming weeks or months.
According to CryptoQuant data, the cross-border money remittance token experienced a significant drop in exchange inflows. At the start of the year, exchange inflows peaked at 2.7 billion XRP, but they’ve since dropped significantly, with only 74 million XRP flowing into exchanges on Monday. Binance, the largest exchange by daily traded volume experienced the biggest drop, especially around February. This steady decline suggests investors are optimistic about XRP’s potential and are choosing to hold the asset longer, easing sell-side pressure.
-1745297471919.png)
XRP Exchange Inflows | Source | CryptoQuant
However, the massive drop in the number of 24-hour active addresses on the XRP Ledger from the yearly local top of roughly 612,000 on March 19 to approximately 36,000 as of April 17 is worth noting. This indicates that fewer unique addresses interact with the network (sending or receiving XRP) and reflects reduced network activity.
%20%5B05-1745297524405.53.23,%2022%20Apr,%202025%5D.png)
XRP Active Addresses | Source: Santiment
If this downtrend progresses, traders may want to acclimatize to lower transaction volume, weakening bullish momentum and dwindling market sentiment. Hence, there is a need to prepare for all outcomes to avoid being caught off guard by sudden price movements.
XRP price holds support at $2, but for how long?
XRP price holds between a rock and a hard place, trading at $2.08 at the time of writing on Tuesday. Support at $2.00 is intact, but upside movement has been capped at under $2.22, a resistance highlighted by the 100-day Exponential Moving Average (EMA).
The Relative Strength Index (RSI) indicator on the daily chart sits above a descending trendline, suggesting that bullish Optimism is still intact. However, it has yet to break above the midline, hinting at gradually building sell-side pressure.
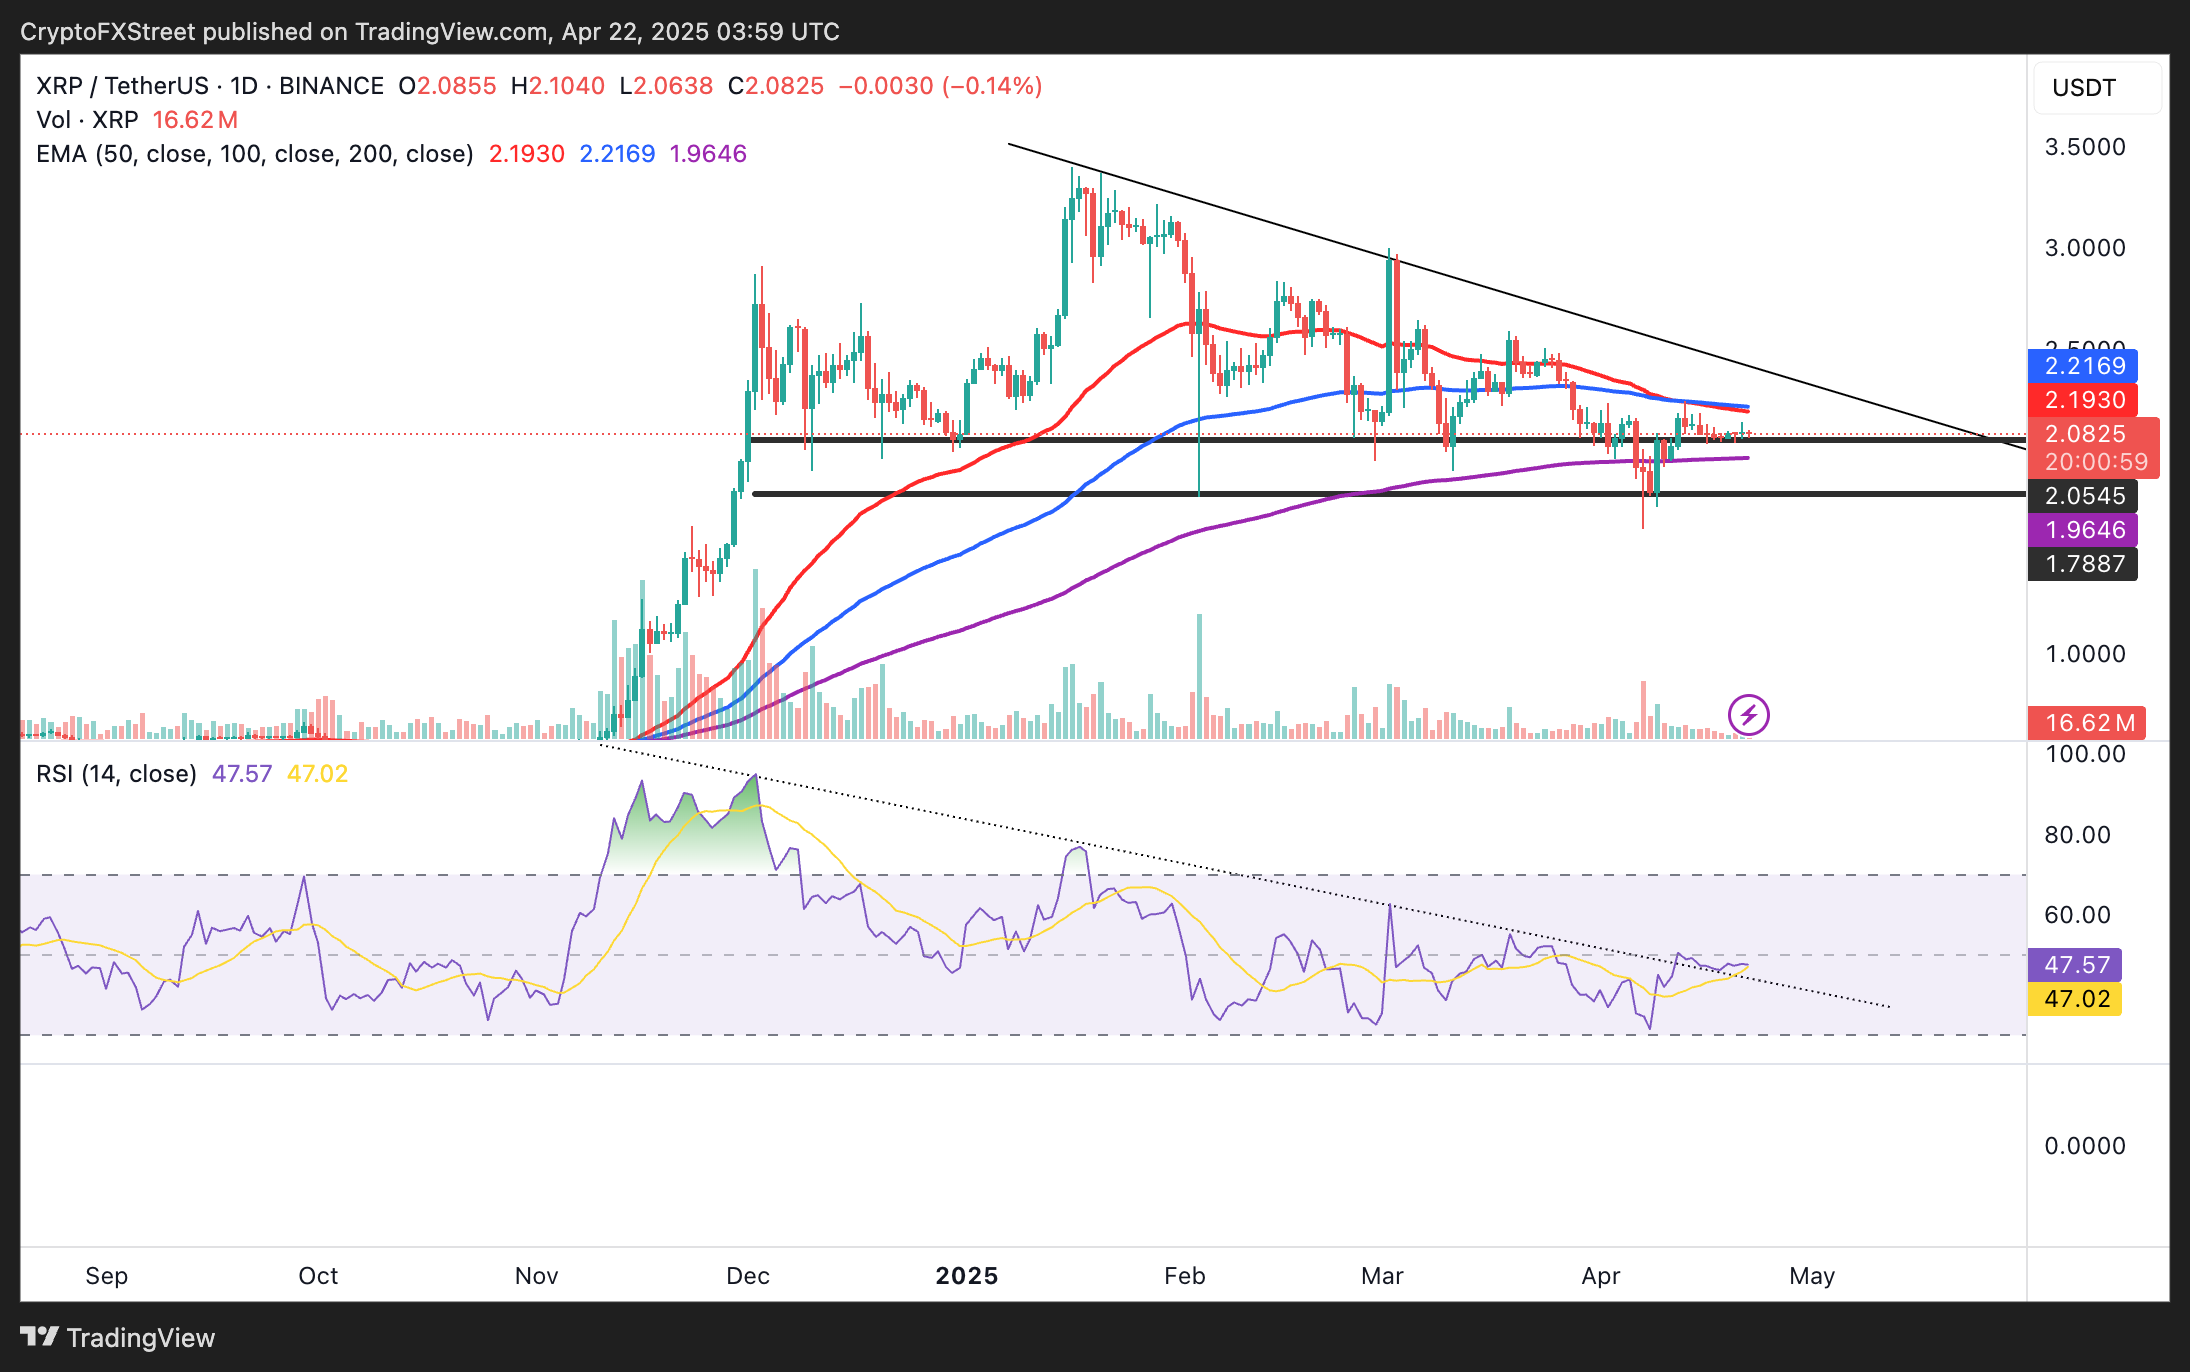
XRP/USDT daily chart
A break above the upper range limit at $2.22 would confirm the bullish grip, encouraging more traders to buy XRP and creating bullish momentum to support a breakout toward $3.00.
However, if support at $2.00 is lost, XRP may drop to retest the 200-day EMA around $1.96 before extending the leg down to the April 7 low of $1.62, seeking liquidity ahead of another recovery attempt.
Cryptocurrency metrics FAQs
What is circulating supply?
The developer or creator of each cryptocurrency decides on the total number of tokens that can be minted or issued. Only a certain number of these assets can be minted by mining, staking or other mechanisms. This is defined by the algorithm of the underlying blockchain technology. On the other hand, circulating supply can also be decreased via actions such as burning tokens, or mistakenly sending assets to addresses of other incompatible blockchains.
What is market capitalization?
Market capitalization is the result of multiplying the circulating supply of a certain asset by the asset’s current market value.
What is trading volume?
Trading volume refers to the total number of tokens for a specific asset that has been transacted or exchanged between buyers and sellers within set trading hours, for example, 24 hours. It is used to gauge market sentiment, this metric combines all volumes on centralized exchanges and decentralized exchanges. Increasing trading volume often denotes the demand for a certain asset as more people are buying and selling the cryptocurrency.
What is the funding rate?
Funding rates are a concept designed to encourage traders to take positions and ensure perpetual contract prices match spot markets. It defines a mechanism by exchanges to ensure that future prices and index prices periodic payments regularly converge. When the funding rate is positive, the price of the perpetual contract is higher than the mark price. This means traders who are bullish and have opened long positions pay traders who are in short positions. On the other hand, a negative funding rate means perpetual prices are below the mark price, and hence traders with short positions pay traders who have opened long positions.
