Stellar Price Forecast: XLM Set to Explode as TVL Surges and Bearish Momentum Fades

XLM rockets toward breakout territory as fundamental metrics scream bullish.
Total Value Locked Soars
Stellar's ecosystem isn't just growing—it's accelerating. The network's TVL metrics paint a picture of robust health and expanding utility. Projects building on the platform are attracting real capital, not just speculative hype.
Bearish Pressure Evaporates
Technical indicators show the bears are losing their grip. Selling pressure that dominated recent charts has noticeably weakened. Key resistance levels that previously held strong now appear vulnerable to breakthrough.
The Perfect Storm
Combine strengthening fundamentals with fading technical headwinds and you get a setup that institutional traders dream about. Market structure suggests the path of least resistance points upward.
Remember when traditional finance experts called crypto a passing fad? Meanwhile, Stellar keeps building actual utility while banks struggle to update their legacy systems. The future isn't coming—it's already here, and XLM looks positioned to lead the charge.
On-chain and derivatives data show a bullish bias
Arthemis Terminal data shows that XLM’s TVL increases to $144.4 million on Tuesday from $139.1 million on Saturday, nearing its record high levels of $153.6 million reached in August. Rising TVL indicates growing activity and interest within Stellar’s ecosystem, suggesting that more users are depositing or utilizing assets within XLM-based protocols.
%20(1)-1759220039661-1759220039663.jpeg)
Stellar TVL chart. Source: Artemis
On the derivatives side, XLM bullish bets among traders reach the highest level in over a month. The CoinGlass chart below shows that the XLM long-to-short ratio stands at 1.07 on Tuesday, indicating that traders are betting on the asset’s price to rise.
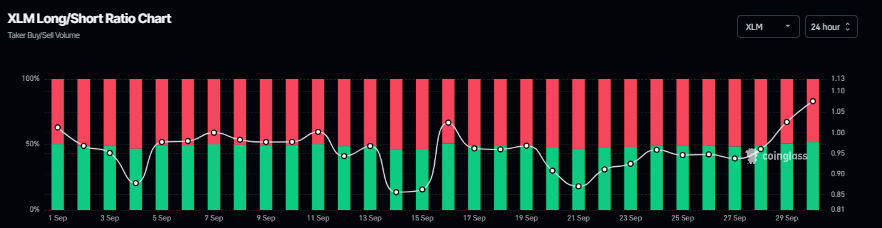
XLM long-to-short ratio chart. Source: Coinglass
Stellar Price Forecast: XLM shows fading bearish momentum
XLM price trades within a falling wedge pattern (drawn by connecting multiple highs and lows with two trendlines since mid-July) on the daily chart. At the time of writing on Tuesday, XLM trades around $0.367, NEAR the upper trendline boundary.
If XLM breaks above the upper trendline and closes above the daily resistance at $0.382, it could extend the rally toward the July 18 high of $0.520.
The Relative Strength Index (RSI) on the daily chart reads 45, nearing its neutral level of 50, which indicates a fading of bearish momentum. However, for the breakout of the wedge pattern to be sustained, the RSI must MOVE above its neutral level. Moreover, the Moving Average Convergence Divergence (MACD) lines are also about to flip to a bullish crossover, while the falling red histogram bars also indicate the fading of bearish momentum.
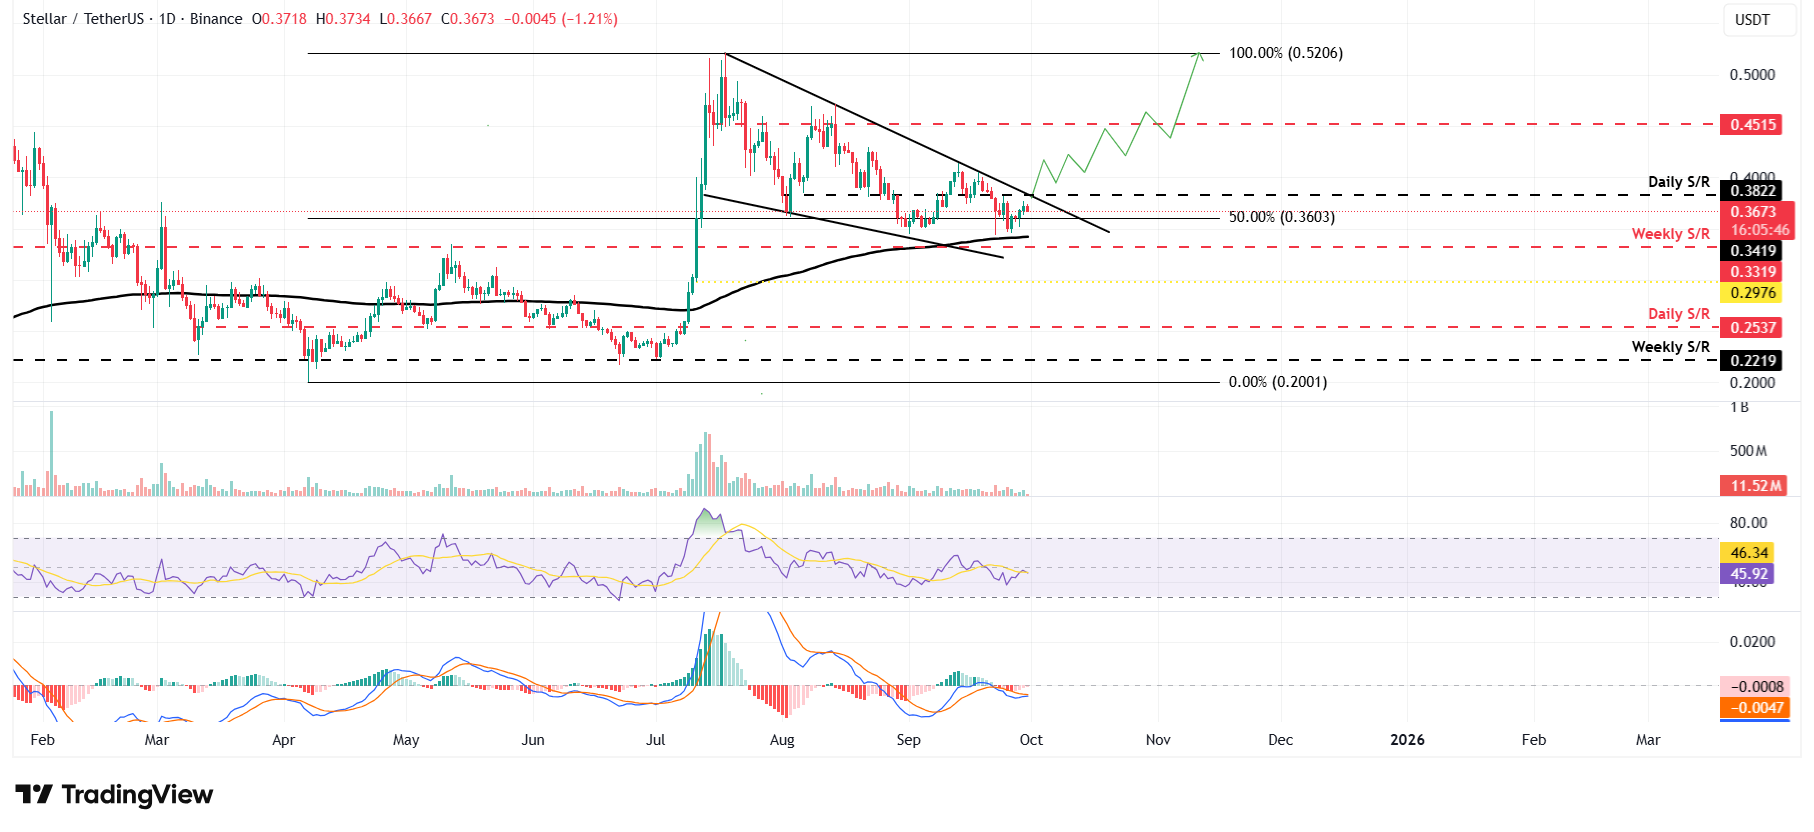
XLM/USDT daily chart
However, if XLM faces a correction, it could extend the decline toward the 200-day Exponential Moving Average (EMA) at $0.341.
