BNB突破1000美元大关强势反弹——稳定币市值创历史新高点燃市场

币安币上演绝地反击!在稳定币总市值突破历史峰值的推动下,BNB强势收复1000美元心理关口。
流动性海啸来袭
稳定币市场总市值飙升至前所未有的高度,为整个加密生态系统注入巨量流动性。这场资本洪流直接催化了BNB的暴力拉升——24小时内涨幅超过15%,彻底粉碎空头防线。
生态效应全面爆发
作为币安智能链的核心燃料,BNB的反弹同步激活了整个DeFi生态。交易量激增、质押收益攀升、Gas费波动——所有指标都在呼应这场资本狂欢。毕竟在加密世界,流动性从来都是最诚实的看涨信号。
机构玩家暗流涌动
虽然散户为价格波动欢呼,但真正聪明的资金早已通过稳定币渠道布局。传统金融机构一边公开质疑加密货币波动性,私下却忙着搭建法币出入金通道——典型的华尔街式虚伪。
技术面呈现多重共振
周线级别MACD金叉确认,布林带突破上轨,链上大额转账频现。所有技术指标都在诉说同一个故事:这轮反弹有着坚实的底层支撑。
当稳定币成为市场晴雨表,当BNB重新站上四位数关口,我们或许正在见证新一轮加密牛市的序章。不过建议各位保持清醒——在加密货币市场,任何「这次不一样」的宣言,最后往往都被证明没什么不一样。
BNB’s stablecoin market cap hits record high
DefiLlama data shows that BNB's stablecoin market capitalization currently stands at $13.22 billion, a new all-time high, and has steadily risen since early 2025. Such stablecoin activity and value increase on the BNB project suggest a bullish outlook, as it boosts network usage and can attract more users to the ecosystem, driven by Decentralized Finance (DeFi), meme coins, and payment use cases.
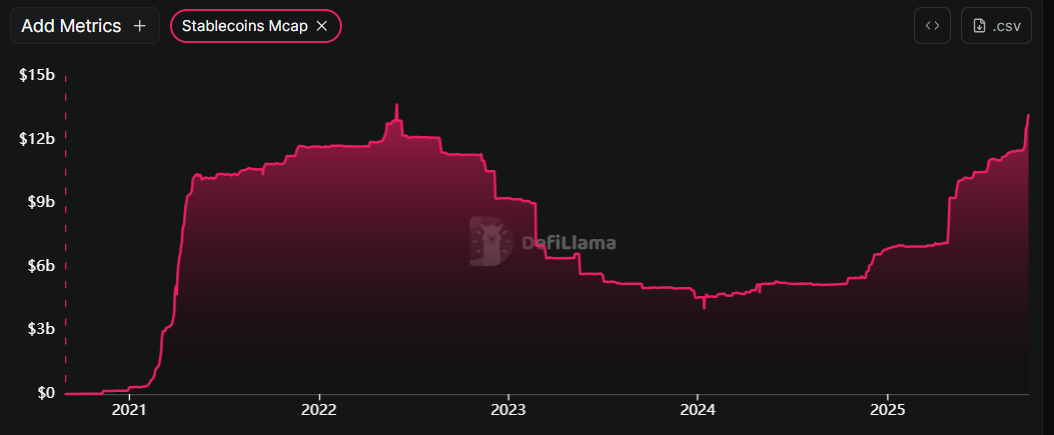
BNB stablecoin market capitalization chart. Source: DefiLlama
Apart from the rising stablecoin market capitalization, according to DefiLlama data, BNB weekly fee collection spiked to $7.58 million last week, the highest weekly collection since April, indicating a growing interest among traders and liquidity in the BNB chain.
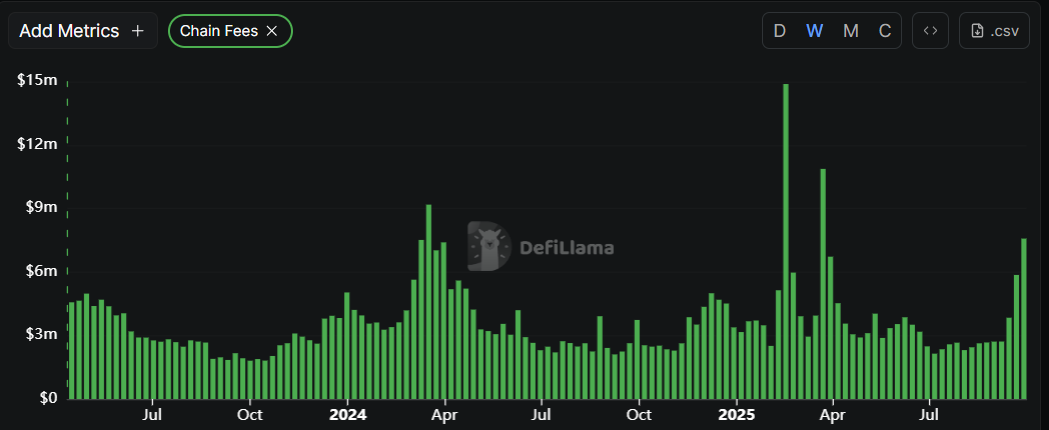
BNB fees chart. Source: DefiLlama
BNB Price Forecast: BNB bulls aiming for record highs
BNB price declined nearly 10% since September 22 till Thursday, revisiting a key accumulation zone between $900.71 (daily support level) and $948.45, the 61.8% Fibonacci retracement level (drawn from the August 3 low of $730.01 to the all-time high of $1,083.47). BNB bounced back on Friday after finding support around $948.45, recovering 4.78% by Sunday. At the time of writing on Monday, it continues to trade higher at above the $1,000 mark.
If BNB continues its upward momentum, it could extend the rally toward its all-time high of $1,083. A successful close above this level could extend the gains to test the 141.4% Fibonacci extension level at $1,229.80.
The Relative Strength Index (RSI) on the daily chart reads 61 after rebounding from its neutral level of 50 last Thursday, suggesting bullish momentum is gaining traction.
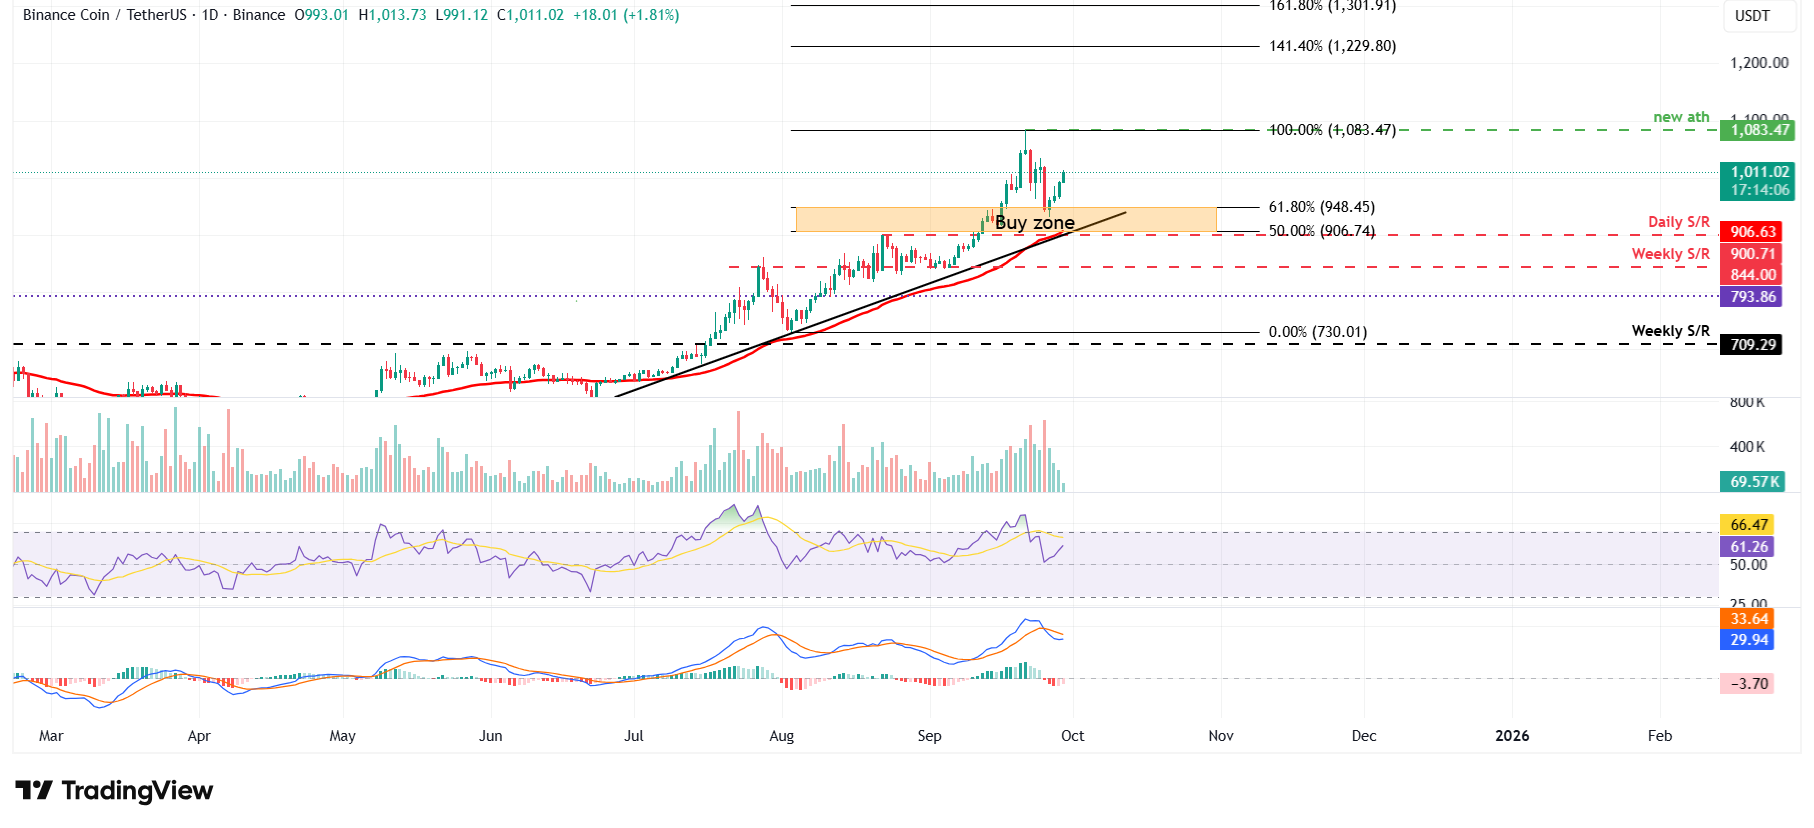
BNB/USDT daily chart
However, if BNB faces a correction, it could extend toward the 61.8% Fibonacci retracement level at $948.45.
