Meme Coins Price Prediction: Why Dogecoin, Shiba Inu, and Pepe Face Continued Downside Risk

Meme coins wobble as gravity reasserts itself in crypto markets.
The Reality Check
Dogecoin, Shiba Inu, and Pepe—the holy trinity of internet joke tokens—face mounting pressure as speculative fever cools. These assets built on viral momentum rather than utility now confront their ultimate test: surviving when the memes stop spreading.
Technical Breakdown
Chart patterns suggest weakening support levels across all three tokens. Trading volumes decline as retail interest shifts toward assets with actual development teams and roadmaps—what traditional finance folks call 'fundamentals,' a concept meme coin traders treat like a vampire treats garlic.
Market Psychology Shift
The 'number go up' mentality hits resistance when numbers start going down. Traders who bought the dip discover there's always a deeper dip—the crypto version of 'this time it's different' meets 'oh, it's exactly the same.'
The Silver Lining?
History shows meme coins can defy logic longer than rational observers expect. But betting on that requires the confidence of someone who'd short volatility right before a market crash—a move so bold it either makes you rich or becomes a cautionary tale.
Wall Street's favorite saying—'markets can remain irrational longer than you can remain solvent'—feels particularly relevant when your investment thesis relies on Shiba Inu memes outperforming the S&P 500.
Losses and capital outflows flash risk-off sentiment among meme coin investors
Santiment data shows a downward spike in Network Realized Profit/Loss of Dogecoin, Shiba Inu, and Pepe, indicating that investors offloaded 187.58 million DOGE, 34.31 million SHIB, and 11.4 million Pepe at a loss in the last week.
Additionally, a decline in the percentage of supply in profit to 78.00%, 19.89% and 34.46% in DOGE, SHIB, and PEPE, respectively, suggests that investors are under pressure.
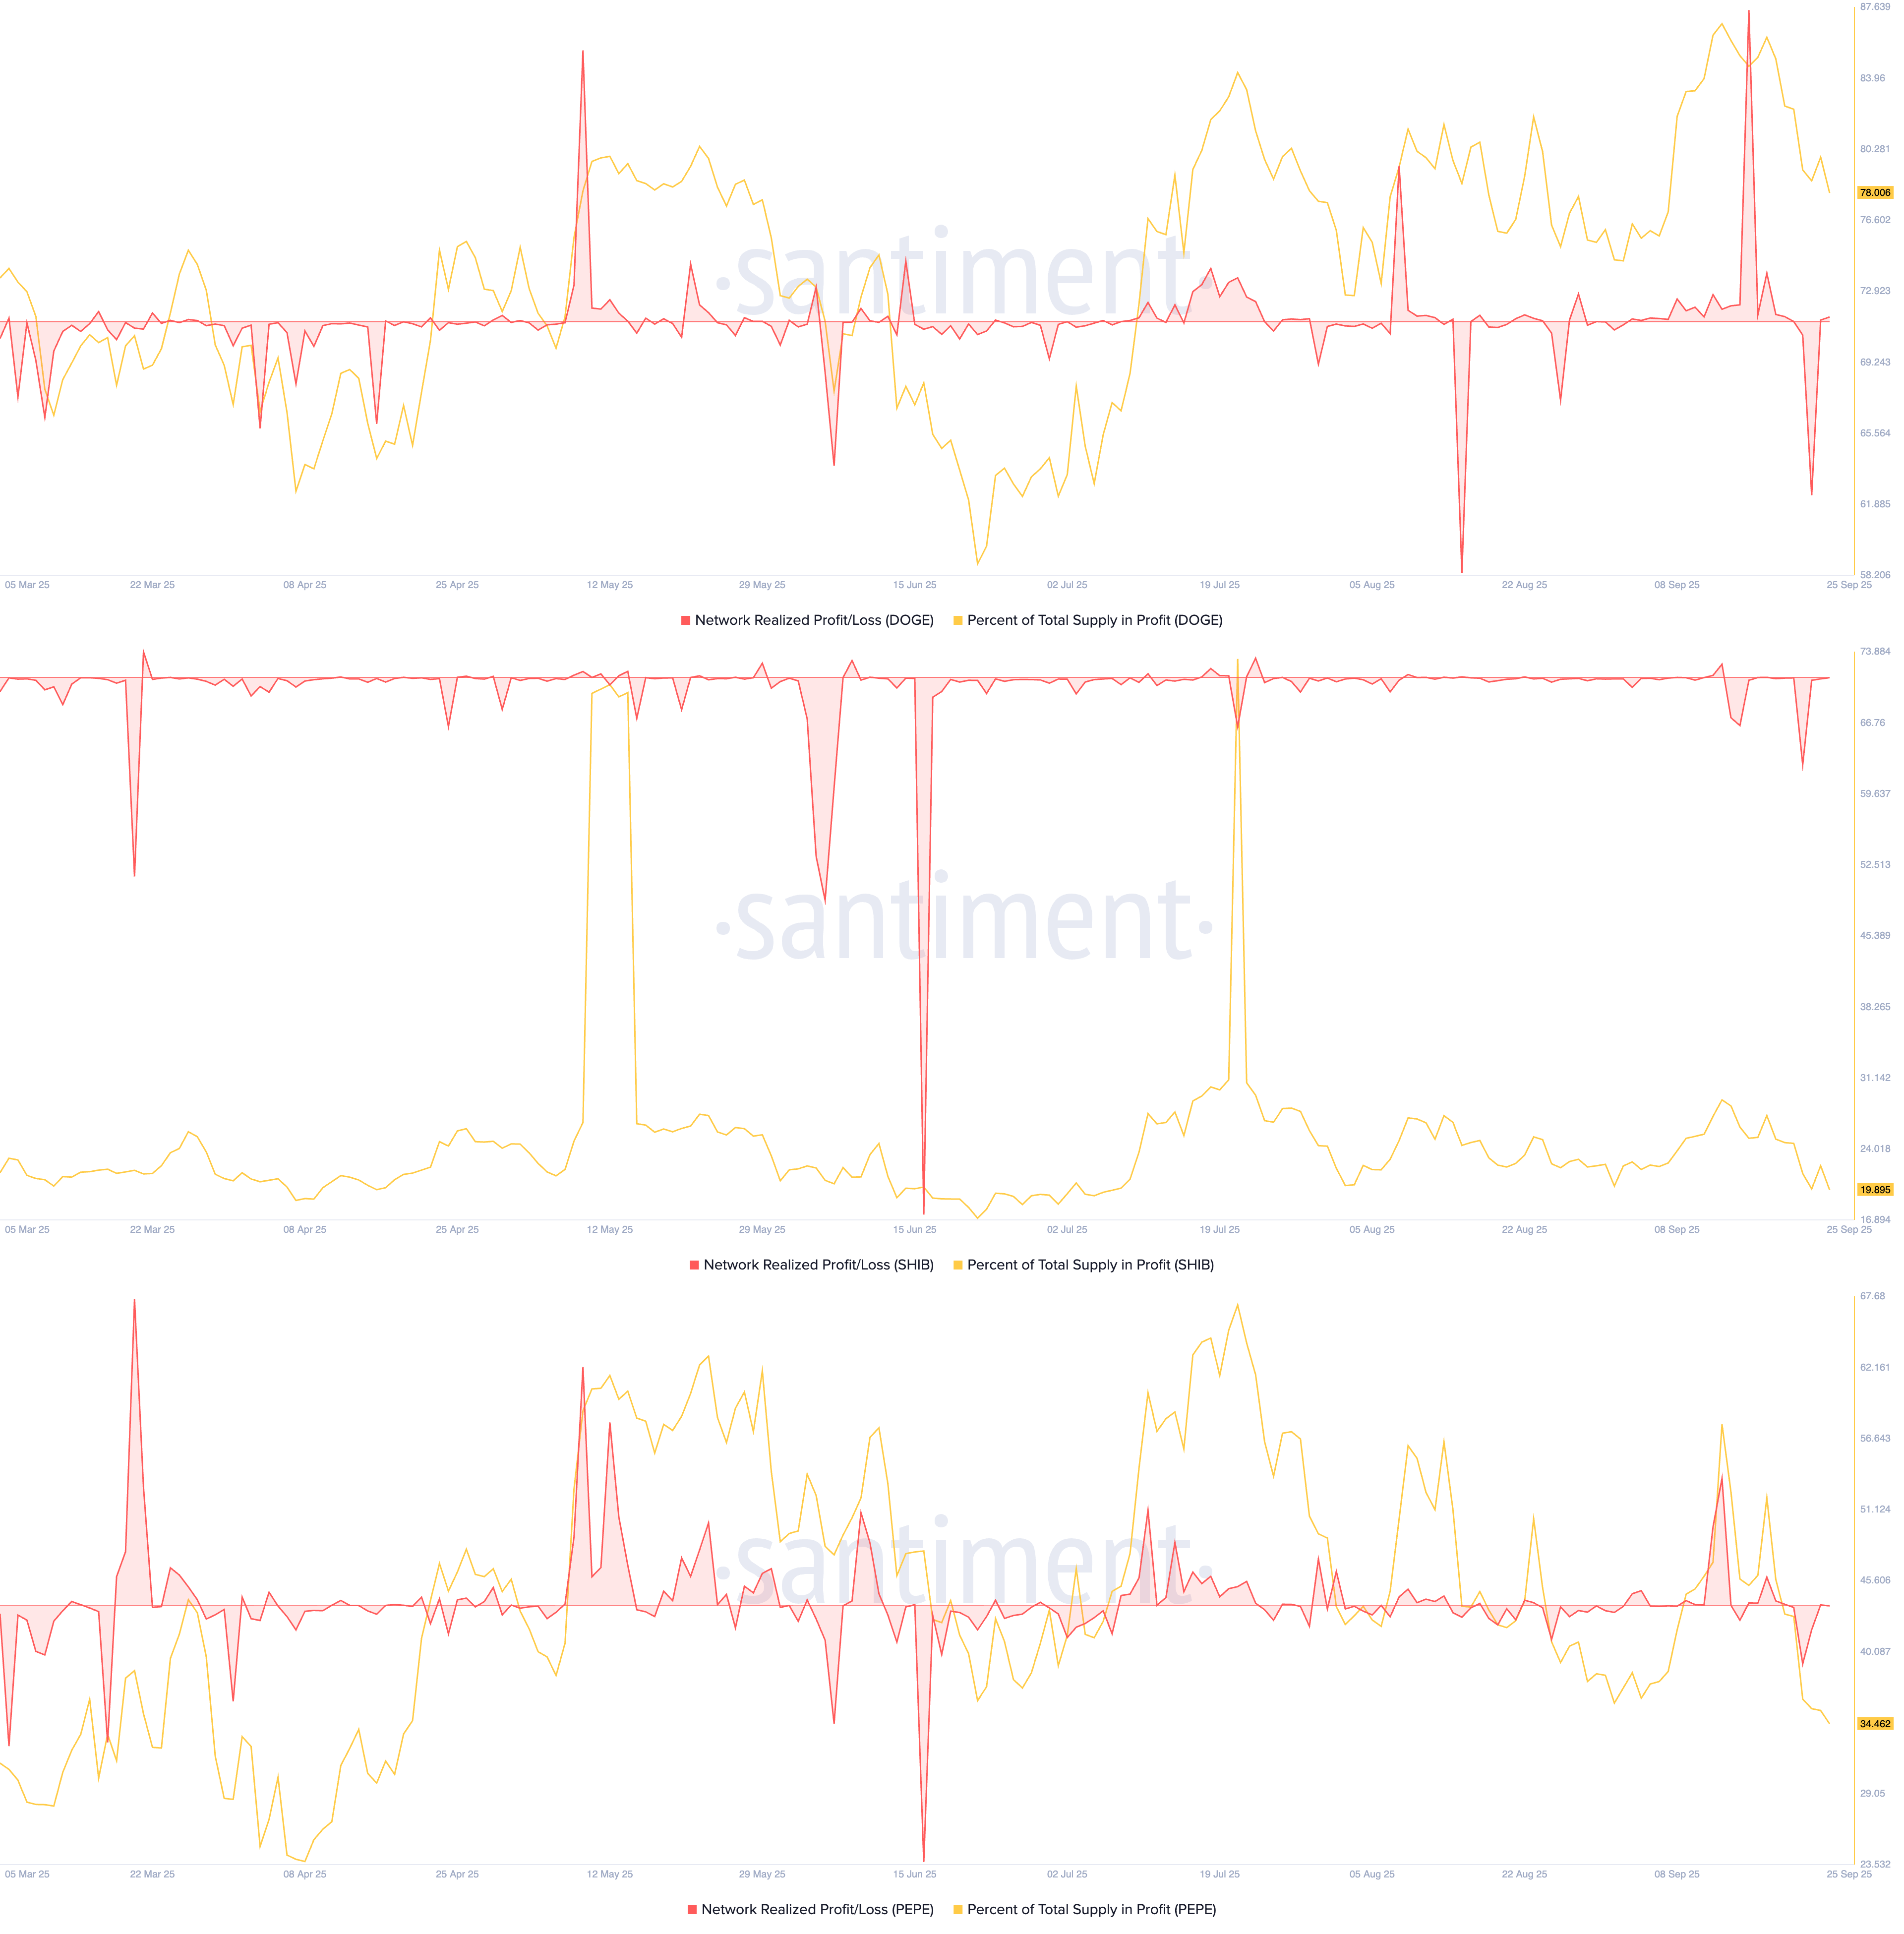
Network Realized Profit/Loss. Source: Santiment
Validating the risk-off sentiment, CoinGlass data shows that the Open Interest of Dogecoin, Shiba Inu, and PEPE have declined by over 1% in the last 24 hours, to $4.01 billion, $189.50 million, and $542.56 million, respectively. This capital outflow from the meme coin derivatives suggests that the investors are opting for a wait-and-see approach.
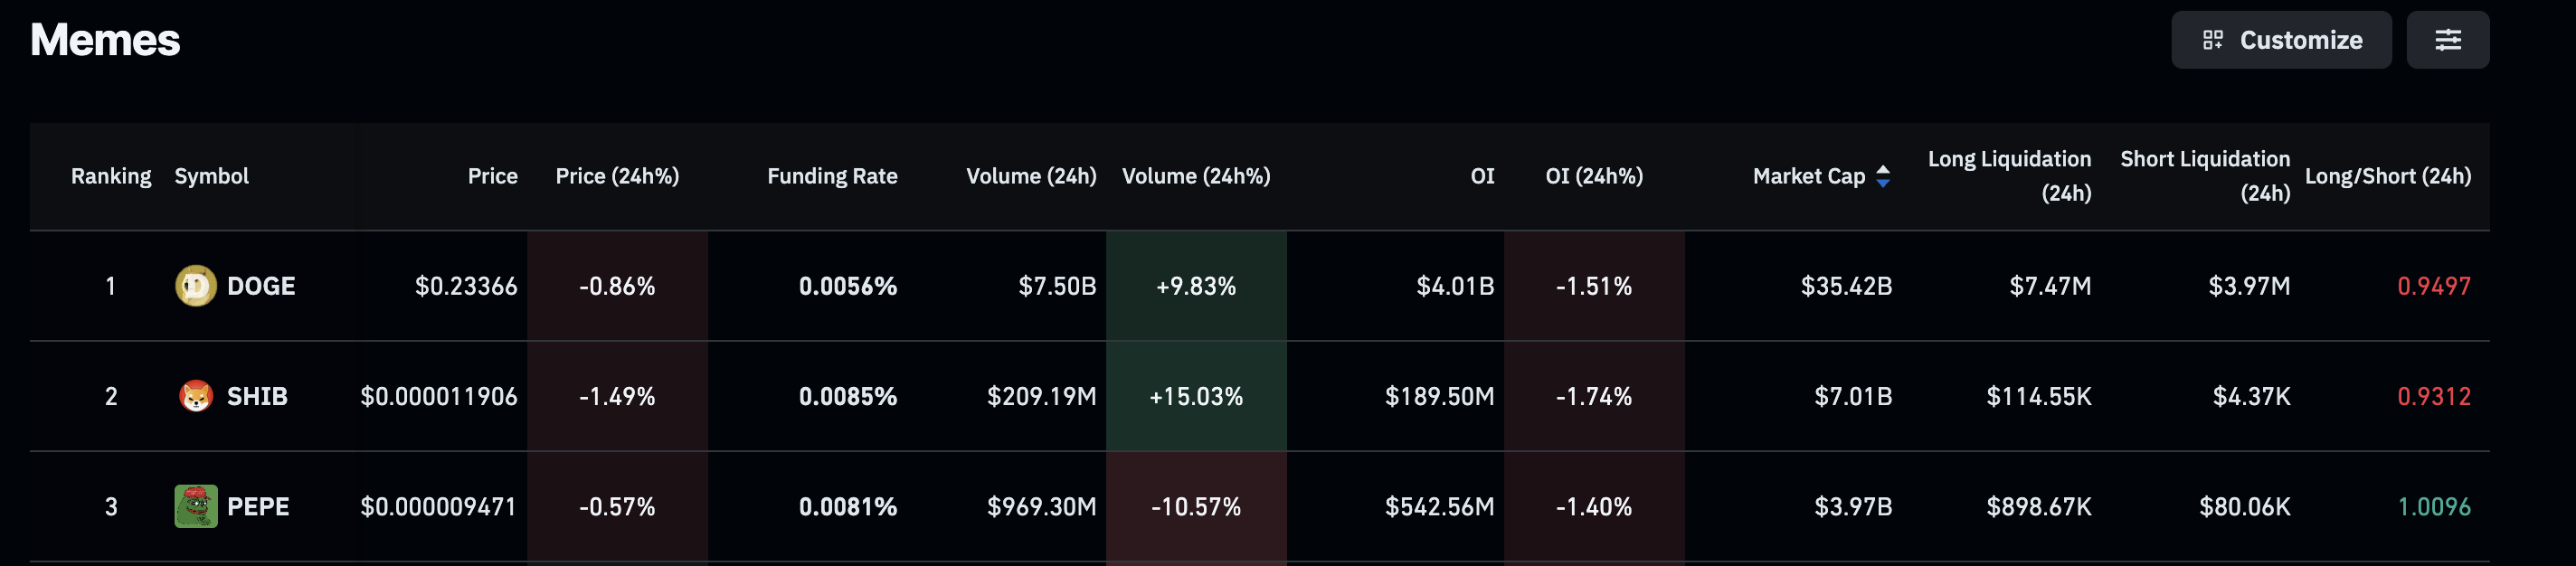
Meme coins derivatives data. Source: CoinGlass
Dogecoin risks testing the 200-day EMA
Dogecoin edges lower by over 2% at press time on Thursday, reversing from the 50-day Exponential Moving Average (EMA) at $0.2386. The declining trend targets the 200-day EMA at $0.21955.
If Doge marks a decisive close below this level, it could extend the decline to the $0.1909 support level, marked by the August 2 close.
The technical indicators on the daily chart suggest a rise in bearish momentum, as the Moving Average Convergence Divergence (MACD) continues to hold a declining trend with its signal line. Even the successive rise in red histogram bars suggests a surge in selling pressure.
Additionally, the Relative Strength Index (RSI) is at 44, sloping downwards, with further room for correction before reaching the oversold zone.
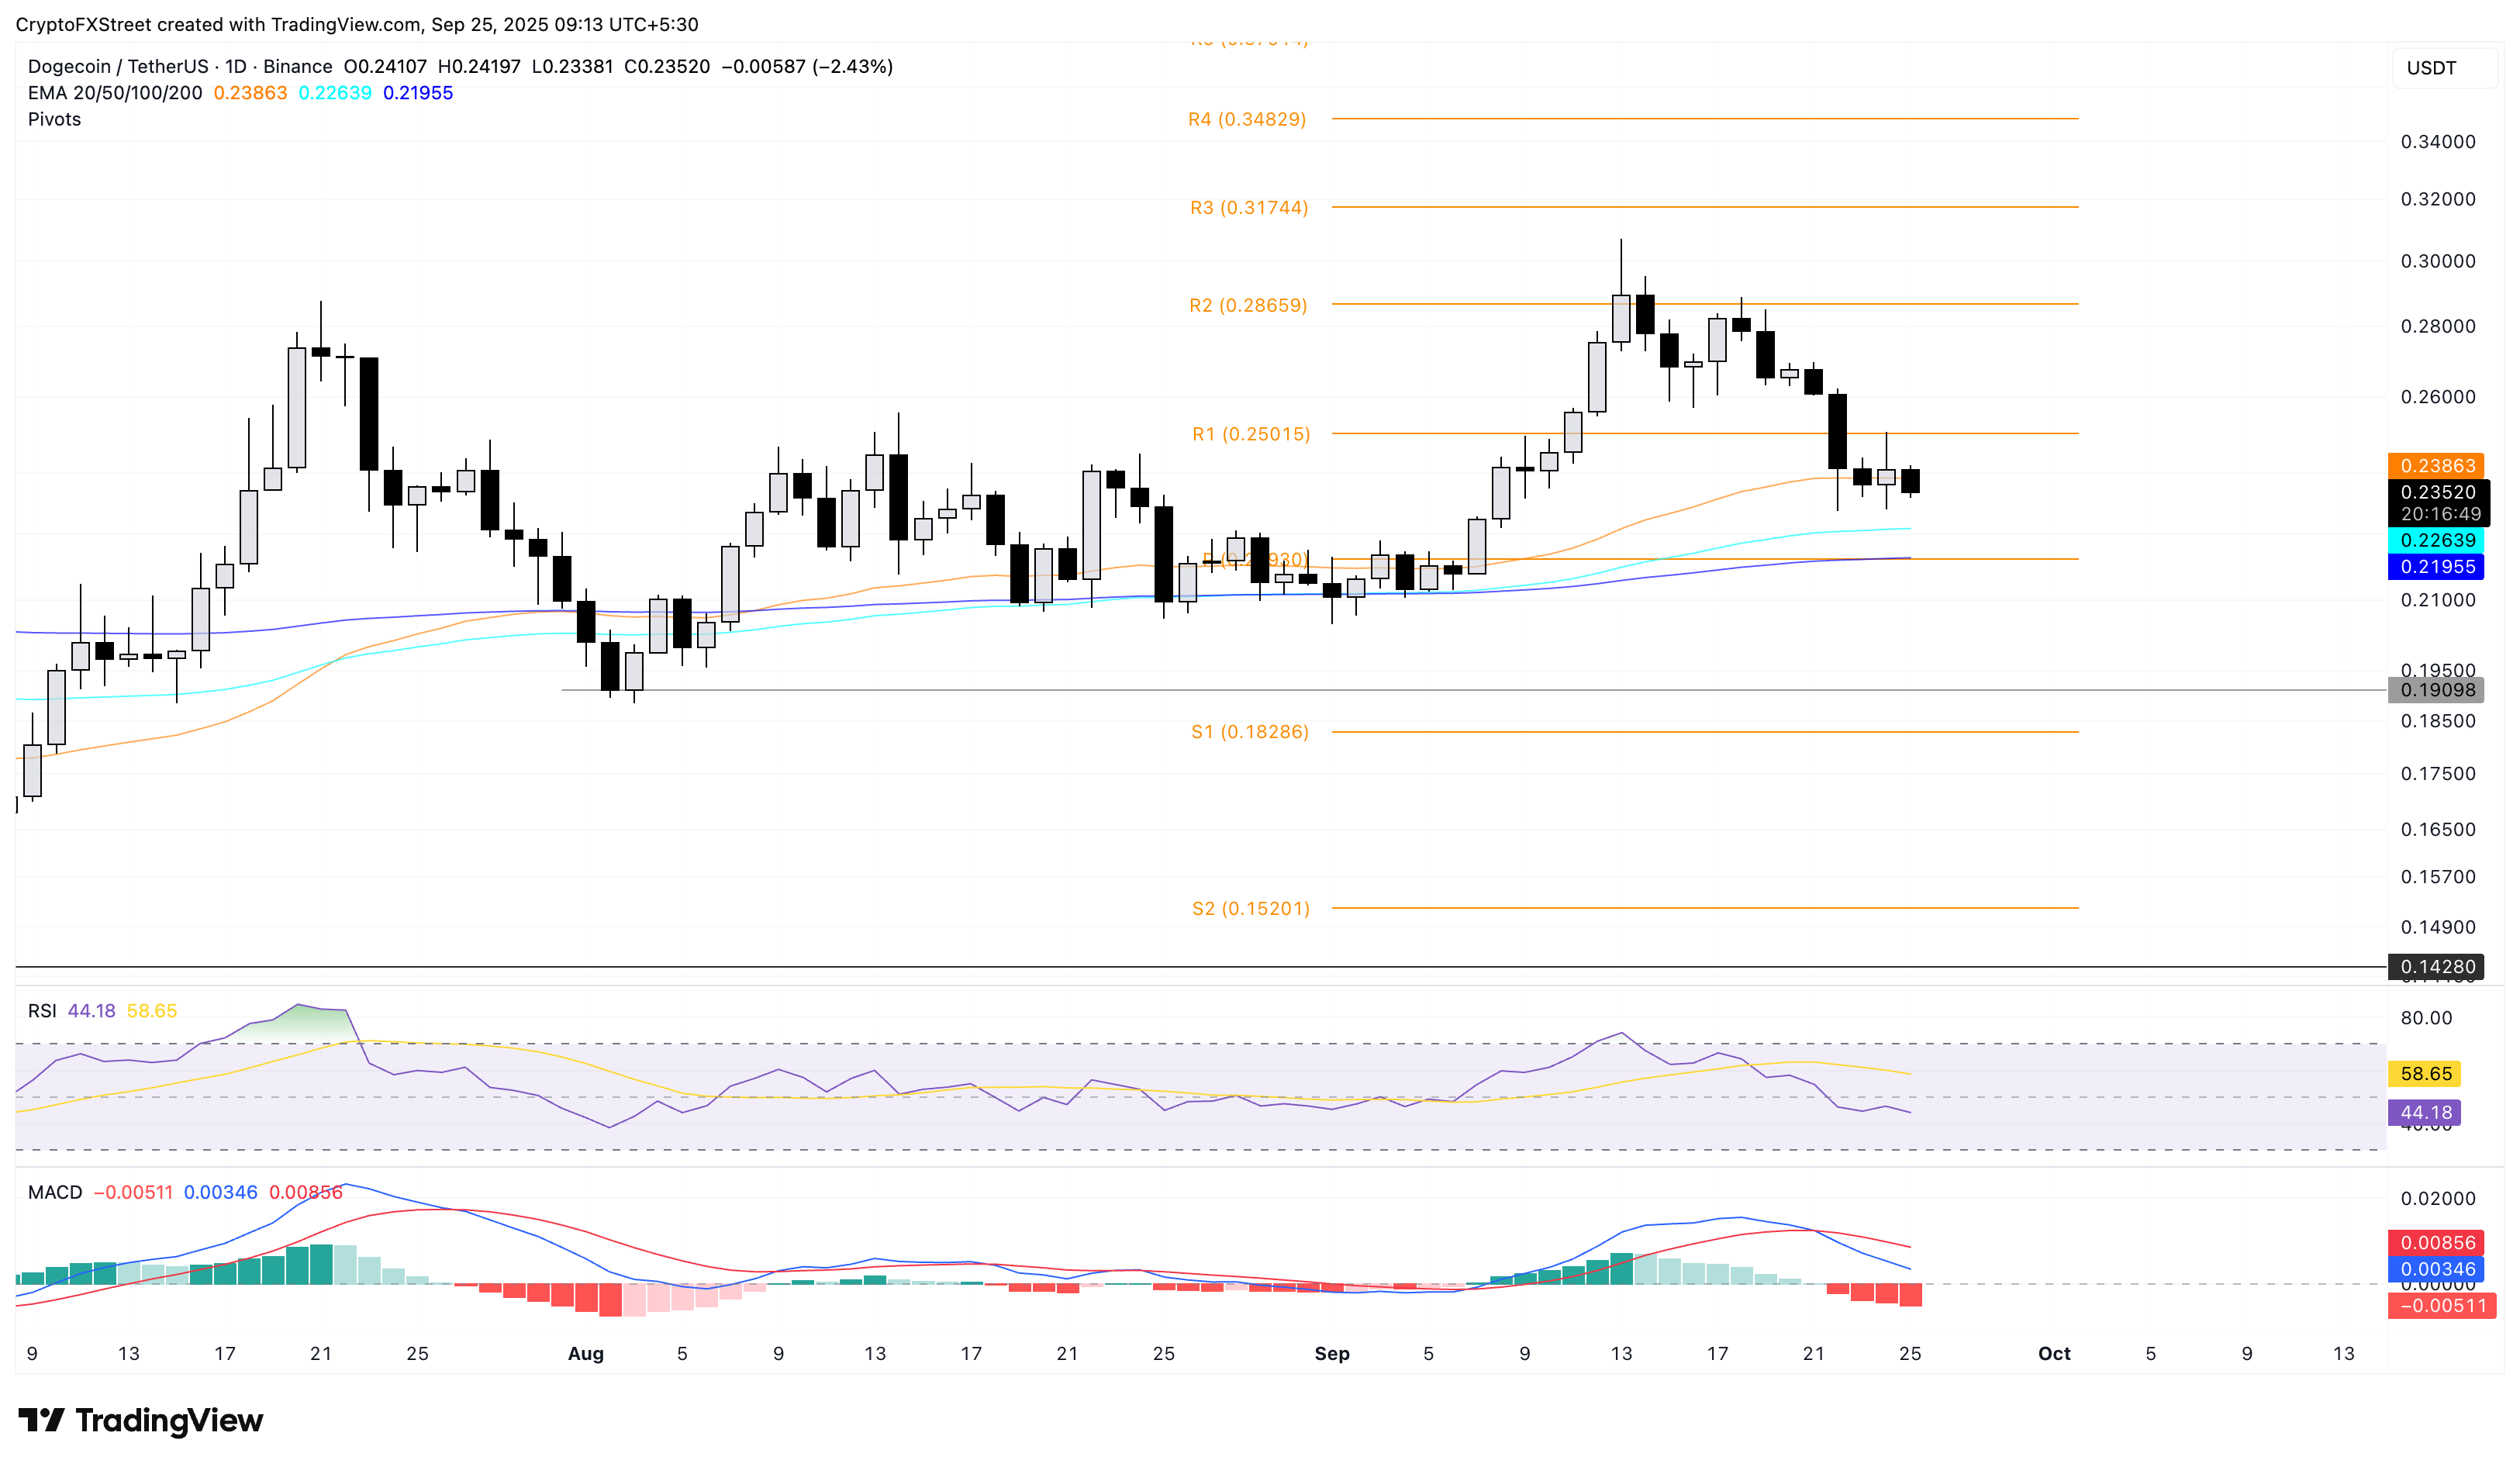
DOGE/USDT daily price chart.
To reinstate an upward trend, DOGE should reclaim the R1 pivot level at $0.2501, which could extend the rally to R2 resistance at $0.2865.
Shiba Inu extends downtrend as it gains bearish momentum
Shiba Inu edges lower by 1% at the time of writing on Thursday, trading below $0.00001200. The immediate support for SHIB lies at $0.00001166, marked by the low of August 3.
If SHIB closes below this level, the meme coin could plummet to the $0.00001060 level, which was marked by its close on June 22.
Similar to DOGE, SHIB is gaining bearish momentum as the MACD and its signal line slip below the zero line. Additionally, the RSI is at 39, inching closer to the oversold zone, indicating a rise in selling pressure.
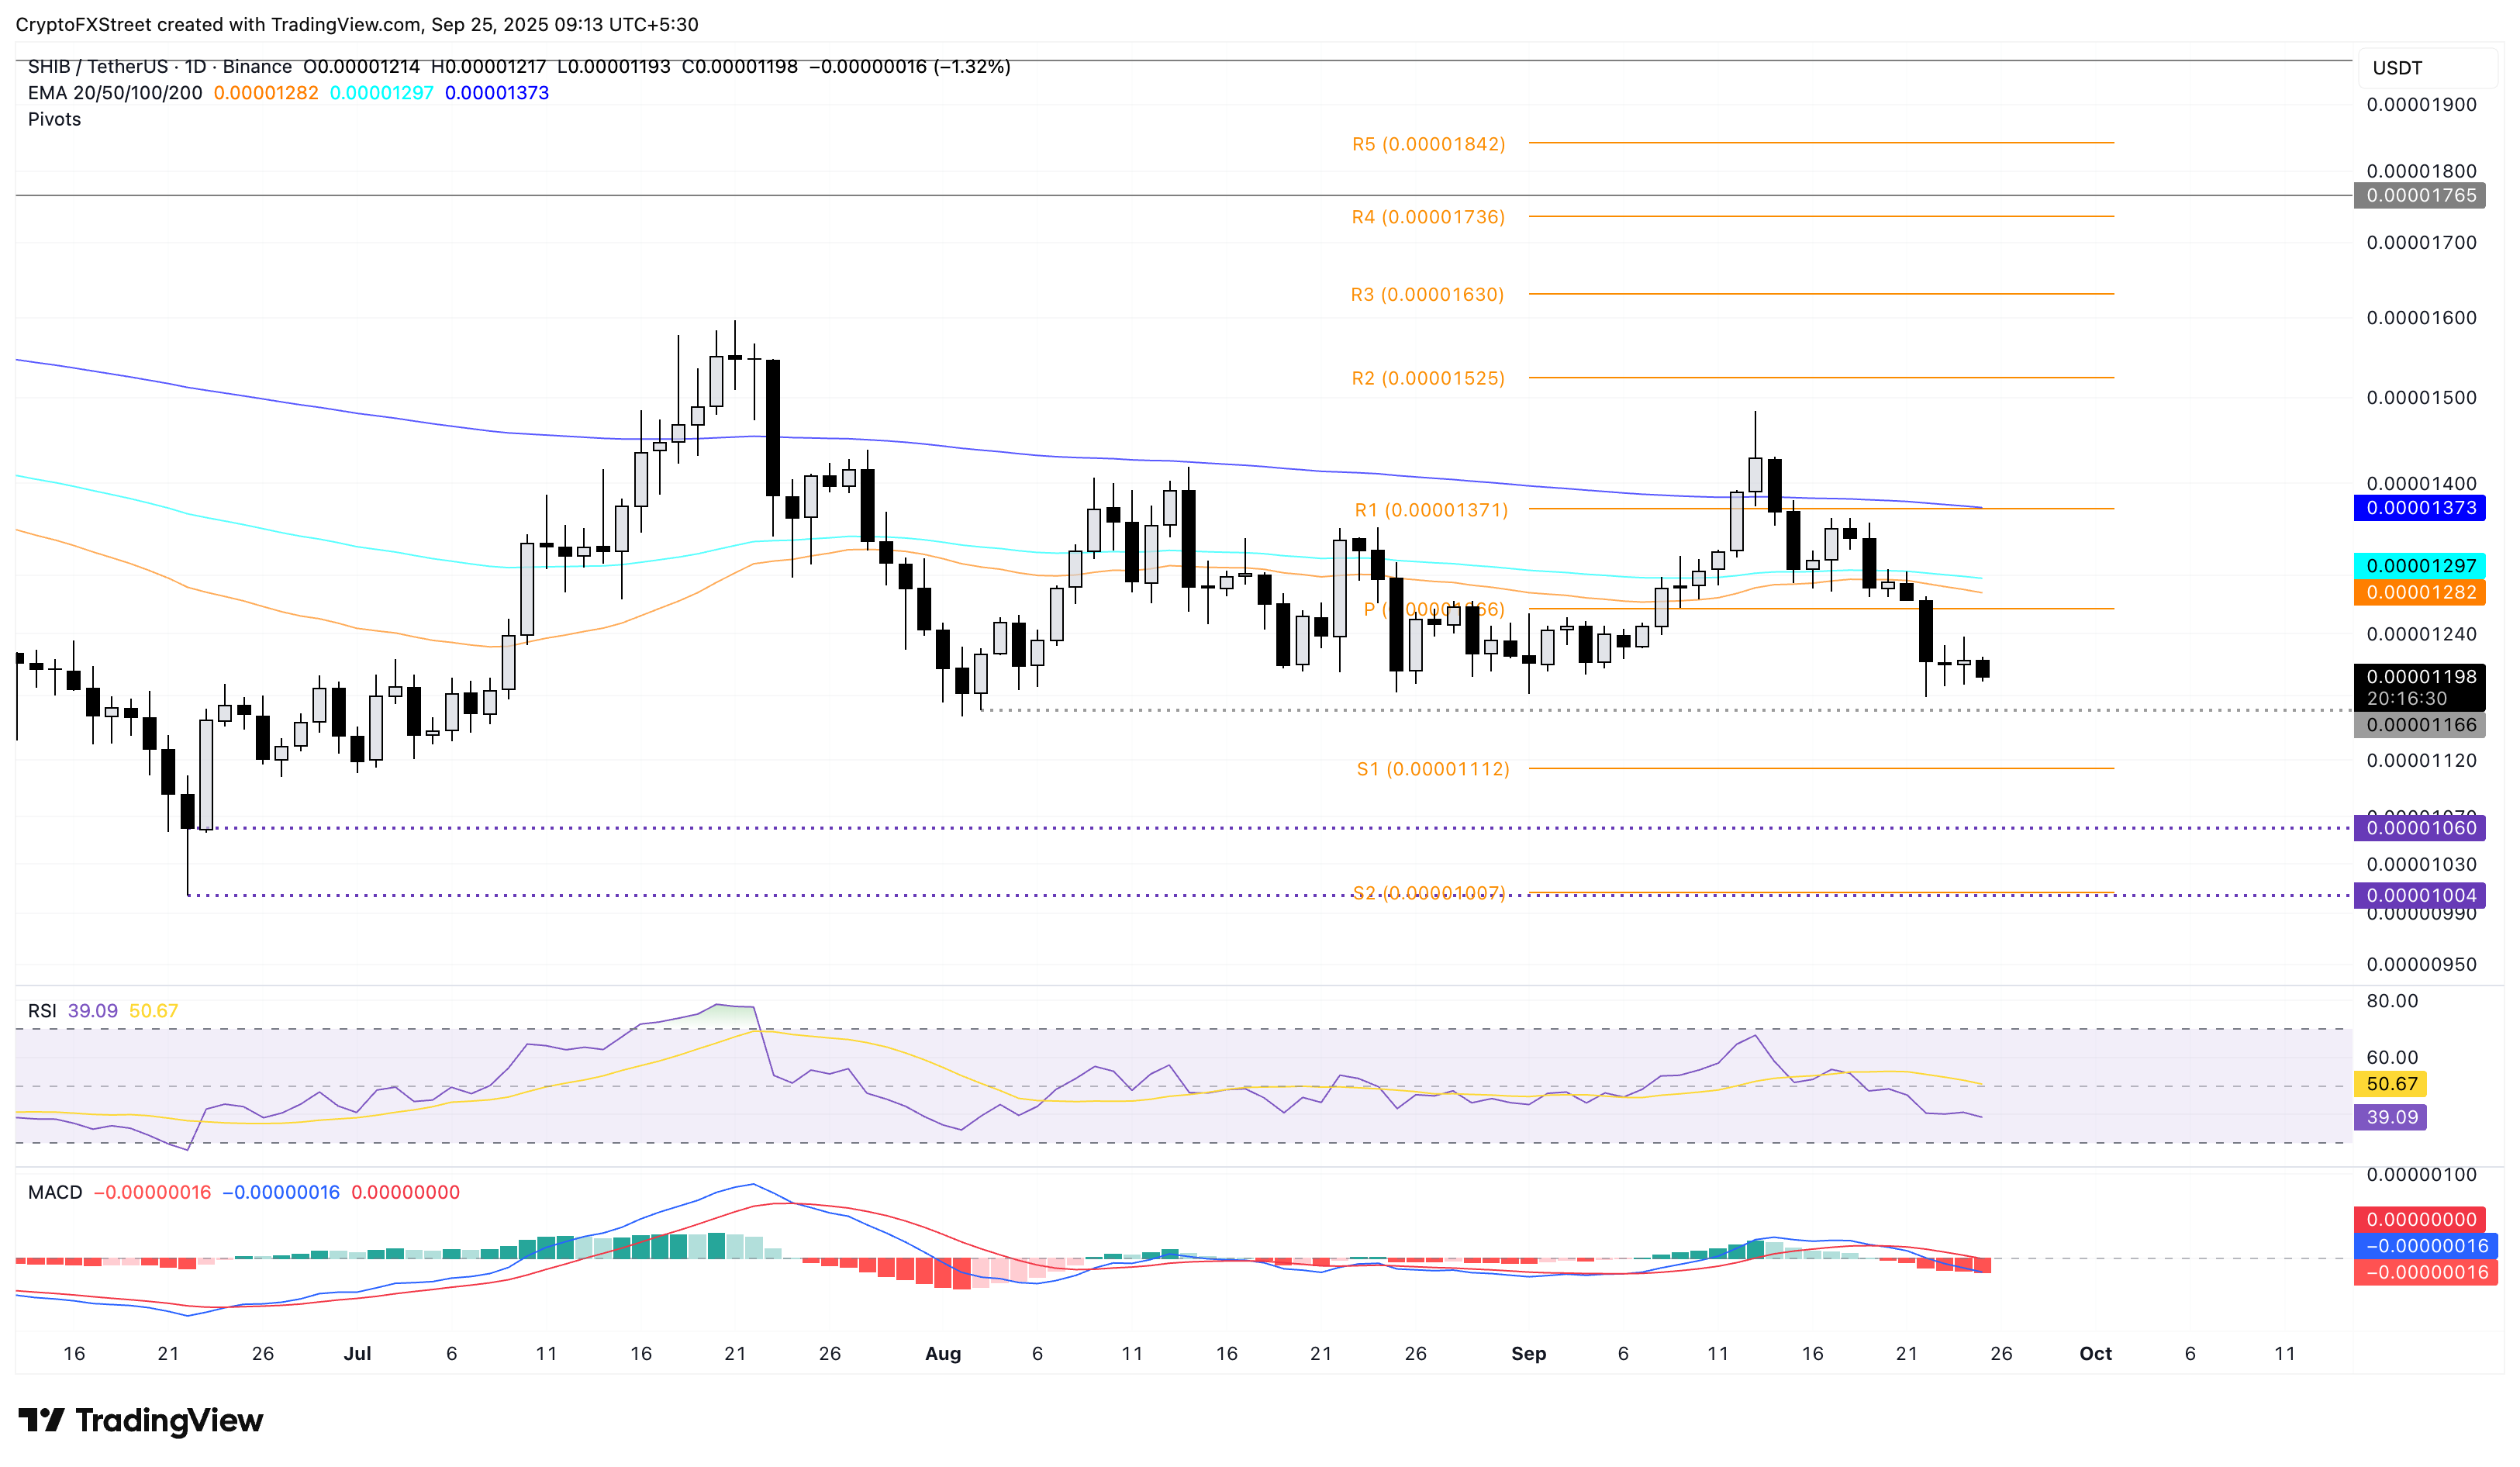
SHIB/USDT daily price chart.
Looking up, SHIB could target the 50-day EMA at $0.00001282 as the immediate resistance.
Pepe under pressure risks triangle pattern fallout
Pepe trades below the $0.00001000 psychological milestone at press time on Thursday, facing a loss of over 1% on the day. The frog-themed meme coin trades NEAR the support trendline of a symmetrical triangle pattern on the daily chart.
The downside risk persists for PEPE if it marks a close below the $0.00000944 level, confirming the breakdown of the triangle pattern. This could extend the decline to the $0.00000887 support, followed by the $0.00000758 low from May 6.
The RSI is at 38, maintaining a declining trend towards the oversold zone, indicating bearish dominance. Furthermore, the MACD and its signal line are in negative territory, with red histograms on the rise, indicating a steady increase in bearish momentum.
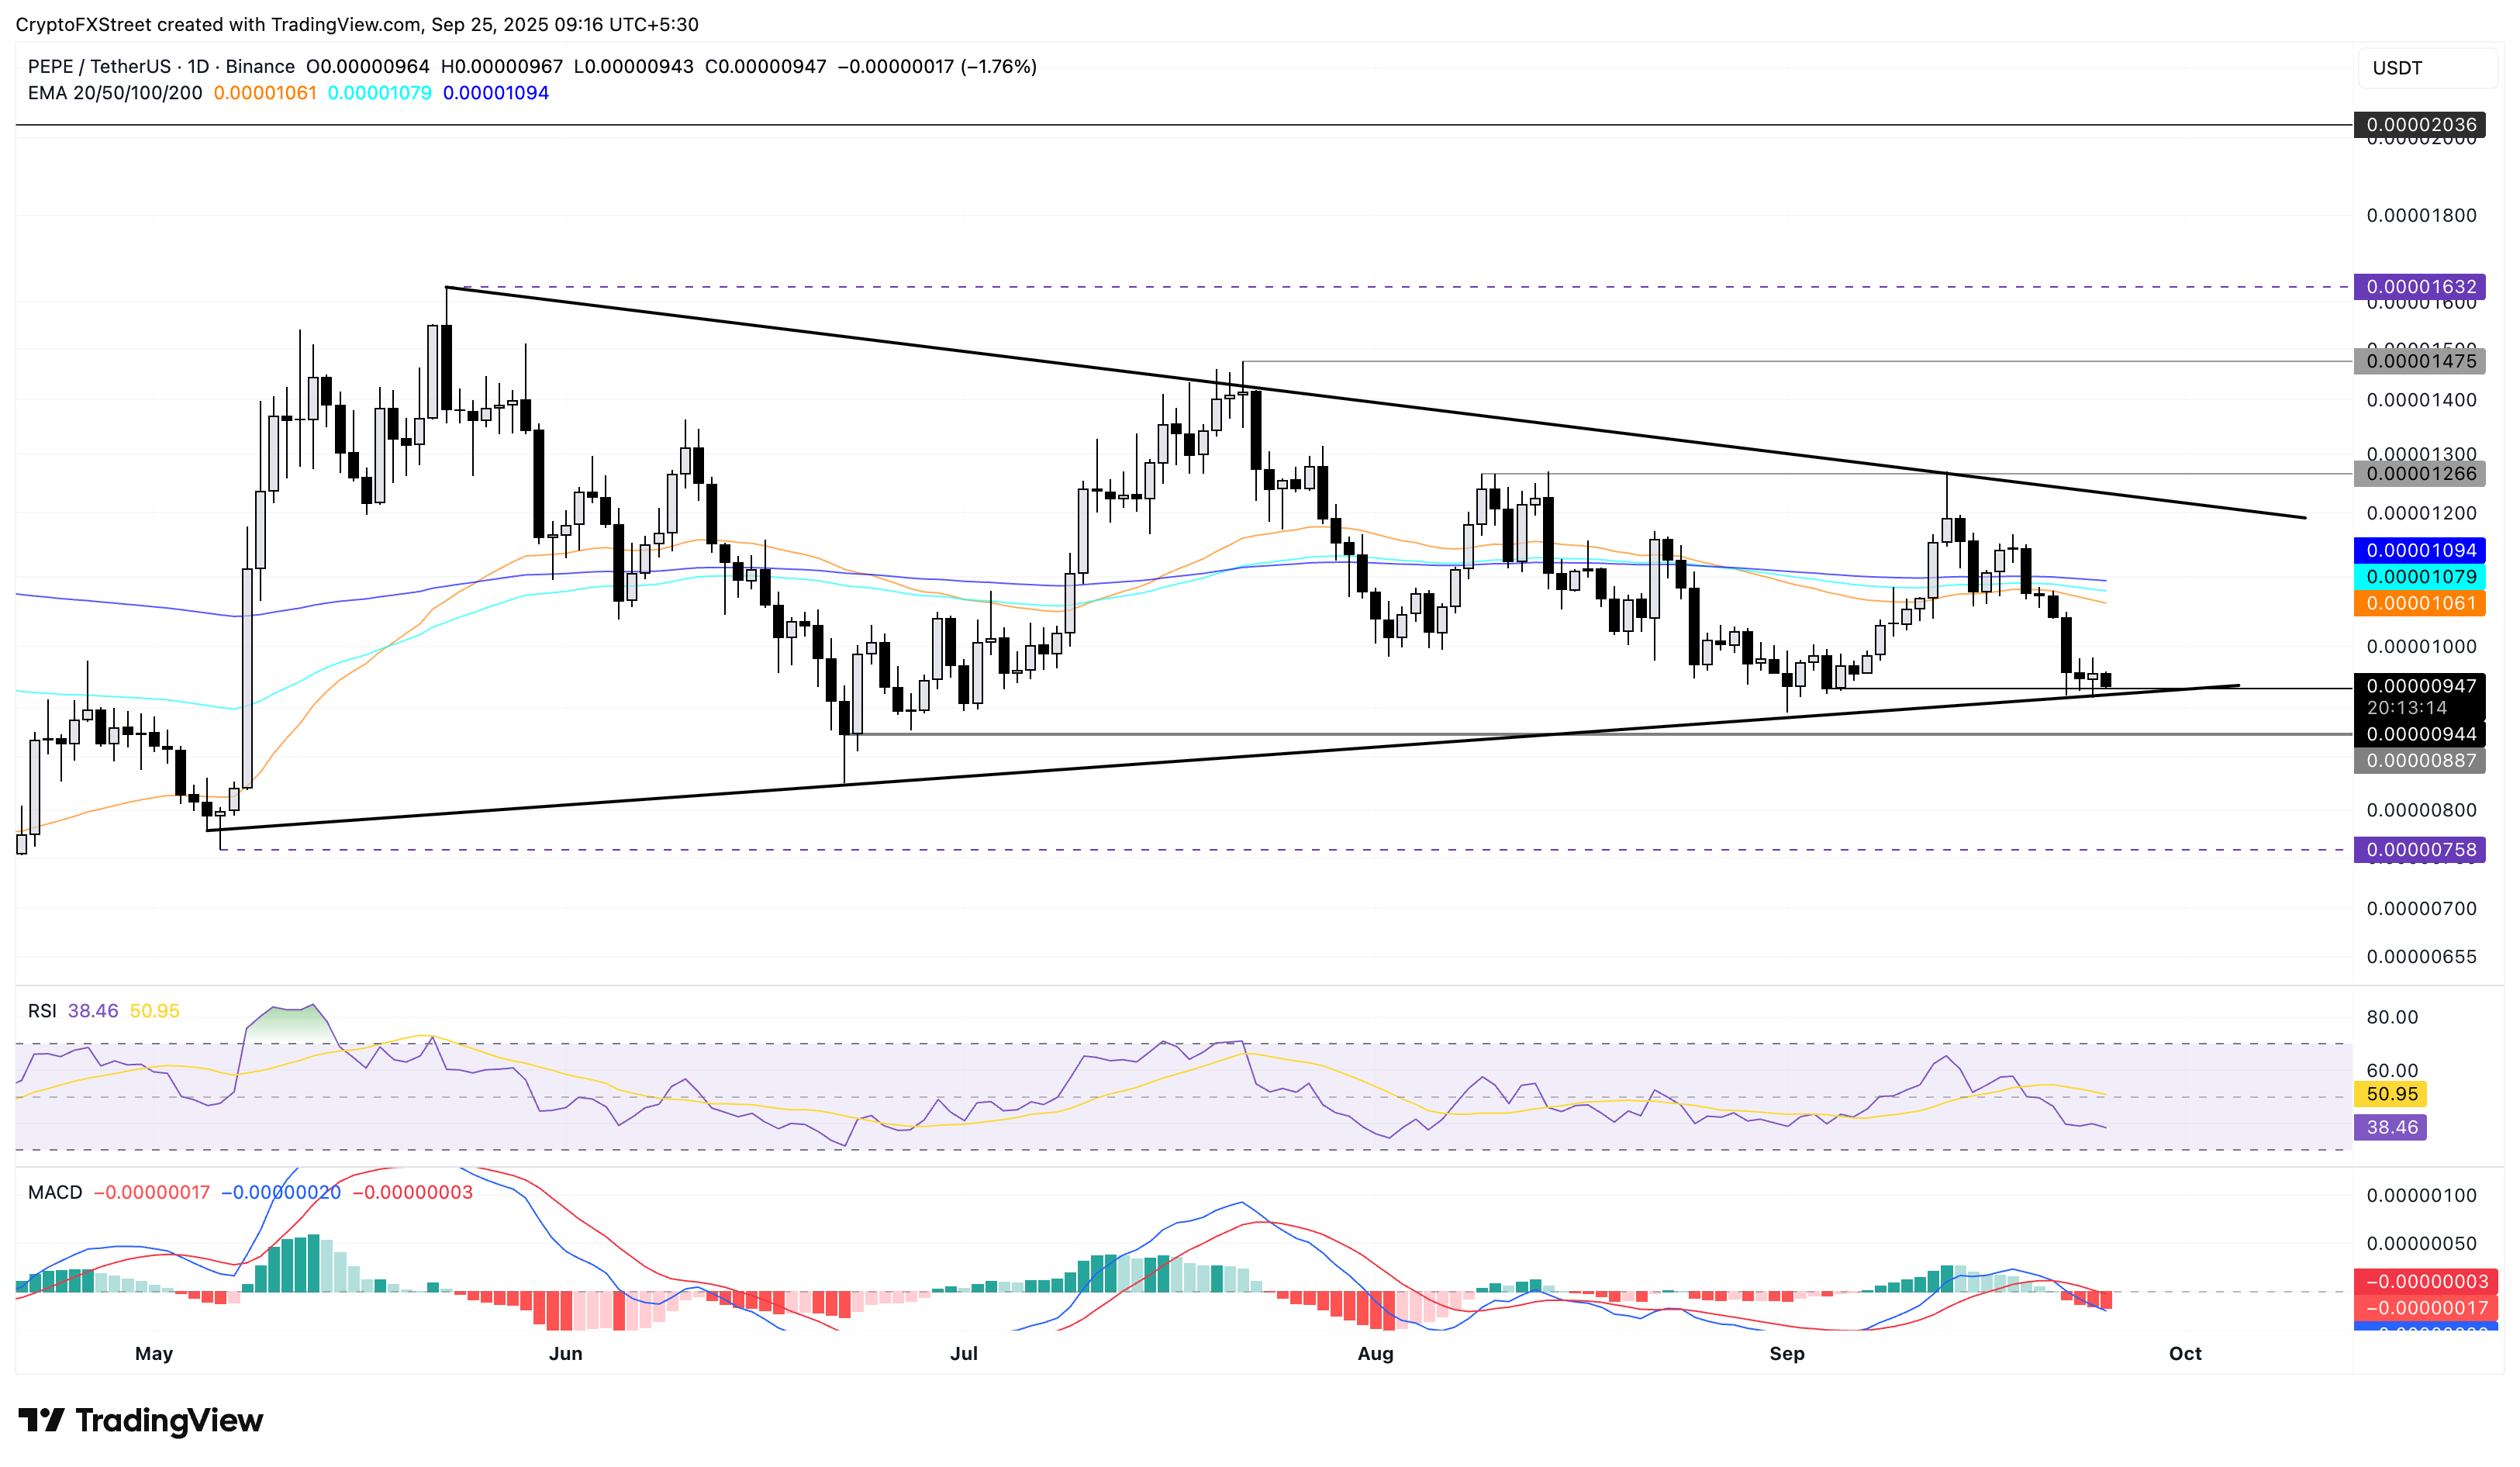
PEPE/USDT daily price chart.
Looking up, if PEPE bounces off the trendline, it could retest the 50-day EMA at $0.00001061.
