Dogecoin Price Forecast: DOGE Battles Whale Exodus Amid Network Activity Slump

Dogecoin faces mounting pressure as major holders dump holdings while network metrics flatline.
Whale Exodus Accelerates
Large-scale DOGE investors are fleeing en masse—transferring millions of tokens to exchanges in a clear liquidation pattern. The sell-off creates relentless downward momentum that retail traders can't counter.
Network Activity Hits Critical Lows
Transaction volumes and active addresses have plummeted to concerning levels. Without fundamental utility driving adoption, DOGE relies purely on speculative sentiment that's rapidly evaporating.
Technical Breakdown Looms
Key support levels are crumbling as buying interest dries up. The meme coin's correlation with Bitcoin isn't helping either—when BTC stumbles, DOGE gets crushed.
Market analysts watch in morbid fascination as the 'people's crypto' demonstrates why fundamentals still matter—even in a sector where 'to the moon' counts as financial analysis.
Dogecoin’s downtrend persists as whales de-risk
Large volume holders of Dogecoin have been selling aggressively over the last few months, as evidenced by Santiment’s on-chain data. Wallets with between 10 million and 100 million DOGE currently account for 15.86% of the total meme coin’s supply, down from 16.85% in July.
Despite the cohort holding between 1 million and 10 million Doge increasing their exposure through July and August, the chart below highlights a local top of 7.3% of the total supply on September 8. These wallets now hold approximately 7.18% of Dogecoin’s supply, reflecting the surge in risk-off sentiment over the past few days.
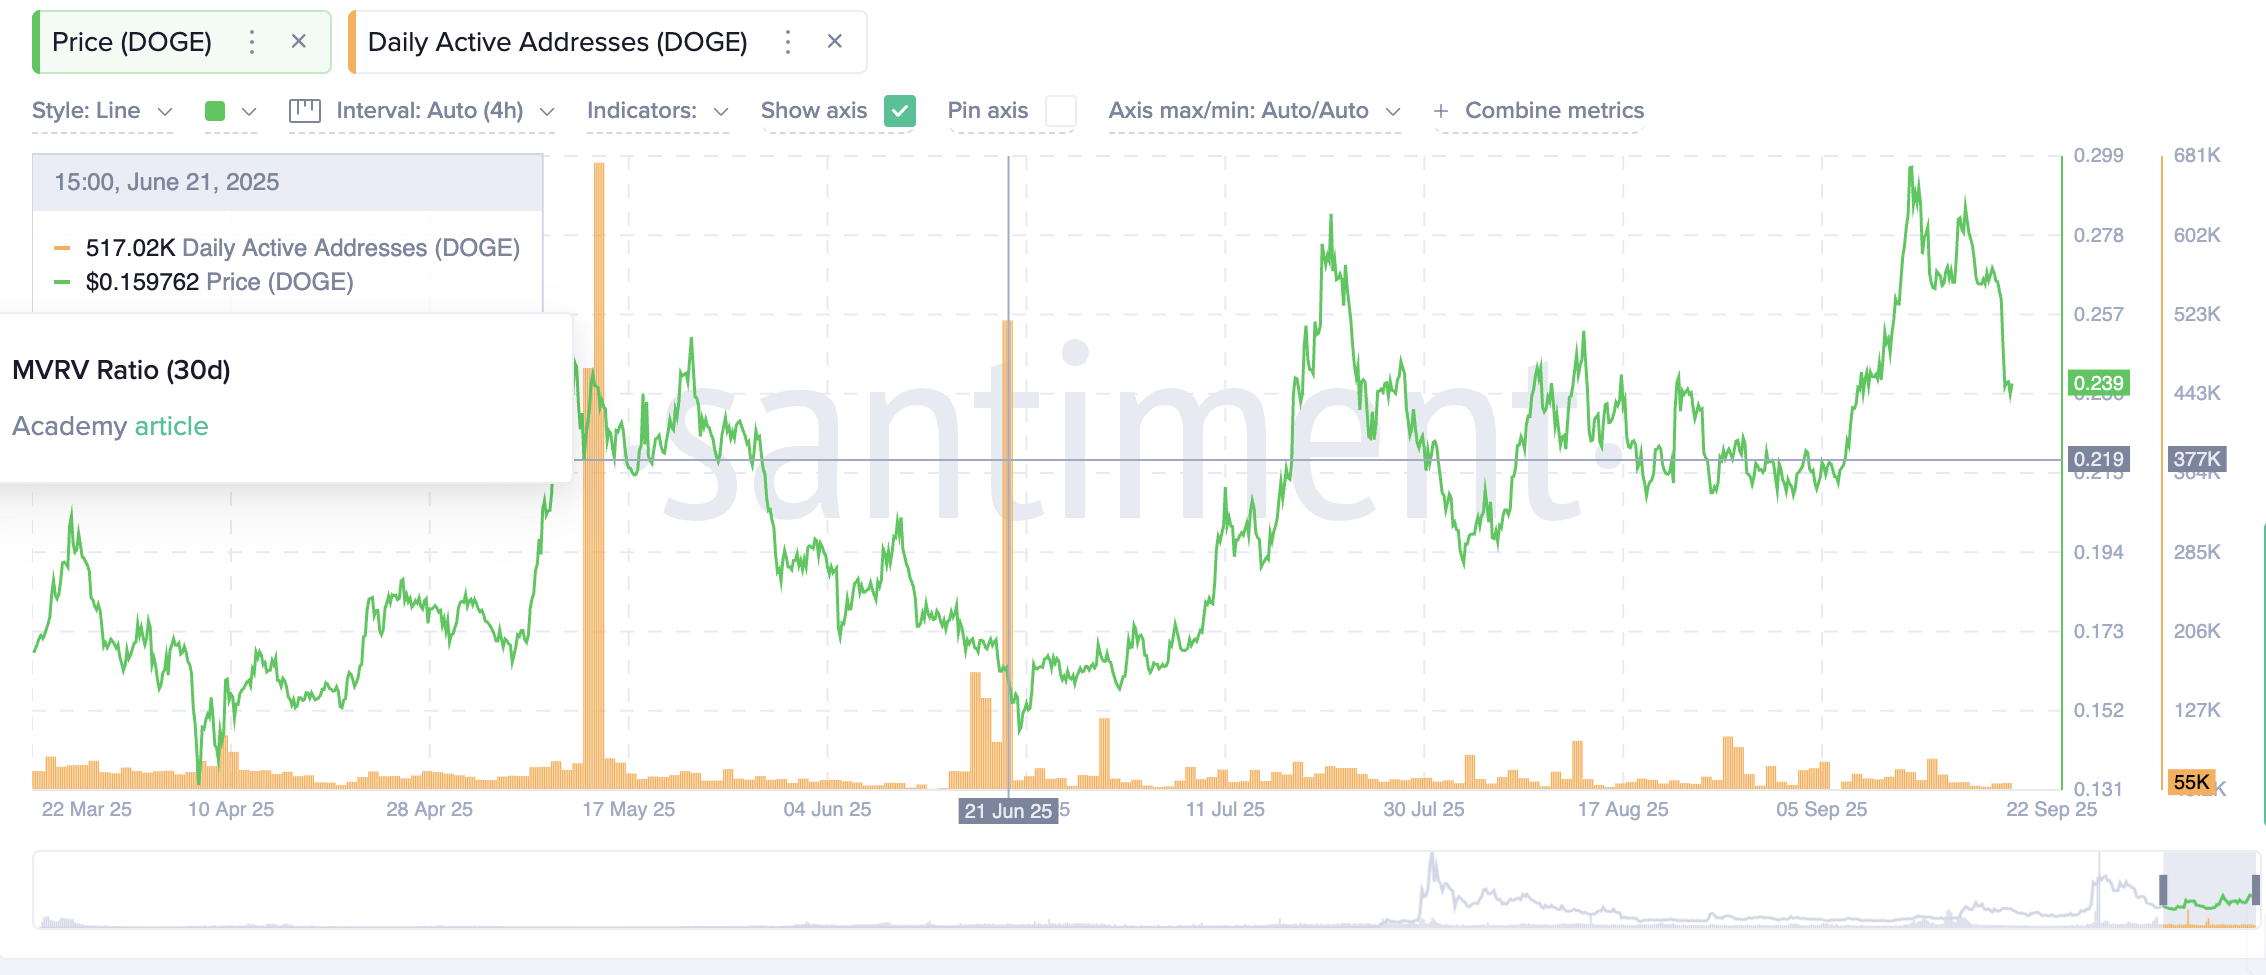
If whales continue to de-risk, a short-term recovery in Dogecoin’s price could be a pipe dream. The Supply Distribution metric by Santiment is worth monitoring to gauge the level of interest in DOGE and whether a rebound toward last week’s peak of $0.3072 can be supported.
%20%5B13-1758627679672-1758627679673.48.24,%2023%20Sep,%202025%5D.png)
Dogecoin Supply Distribution | Source: Santiment
Additional on-chain data confirms the risk-off sentiment among whales, particularly with the number of active addresses averaging 55,000 as of September 22. This highlights significantly low network activity compared to approximately 517,000 daily active addresses in June. The increase in addresses transacting on the protocol in June preceded the steady rally in the price of DOGE to $0.2873 in July.
Suppressed network activity reflects a decline in adoption and demand for the meme coin. If this trend continues, it WOULD be increasingly difficult for bulls to sustain an uptrend, leaving DOGE vulnerable to selling pressure.
Dogecoin Supply Distribution | Source: Santiment
Technical outlook: Dogecoin decline could persist
Dogecoin trades slightly above the 50-day Exponential Moving Average (EMA), marking a short-term support at $0.2387. The meme coin’s short-term path of least resistance appears downward based on key technical indicators.
The Moving Average Convergence Divergence (MACD) indicator continues to highlight a bearish outlook, maintaining a sell signal since Monday. Investors may continue to reduce their exposure if the blue MACD line remains below the red signal line, as the indicator generally declines.
Bearish momentum appears to be steady, as indicated by the position of the Relative Strength Index (RSI) at 45, which is falling. A further decline toward oversold territory would imply a significant reduction in buying pressure.
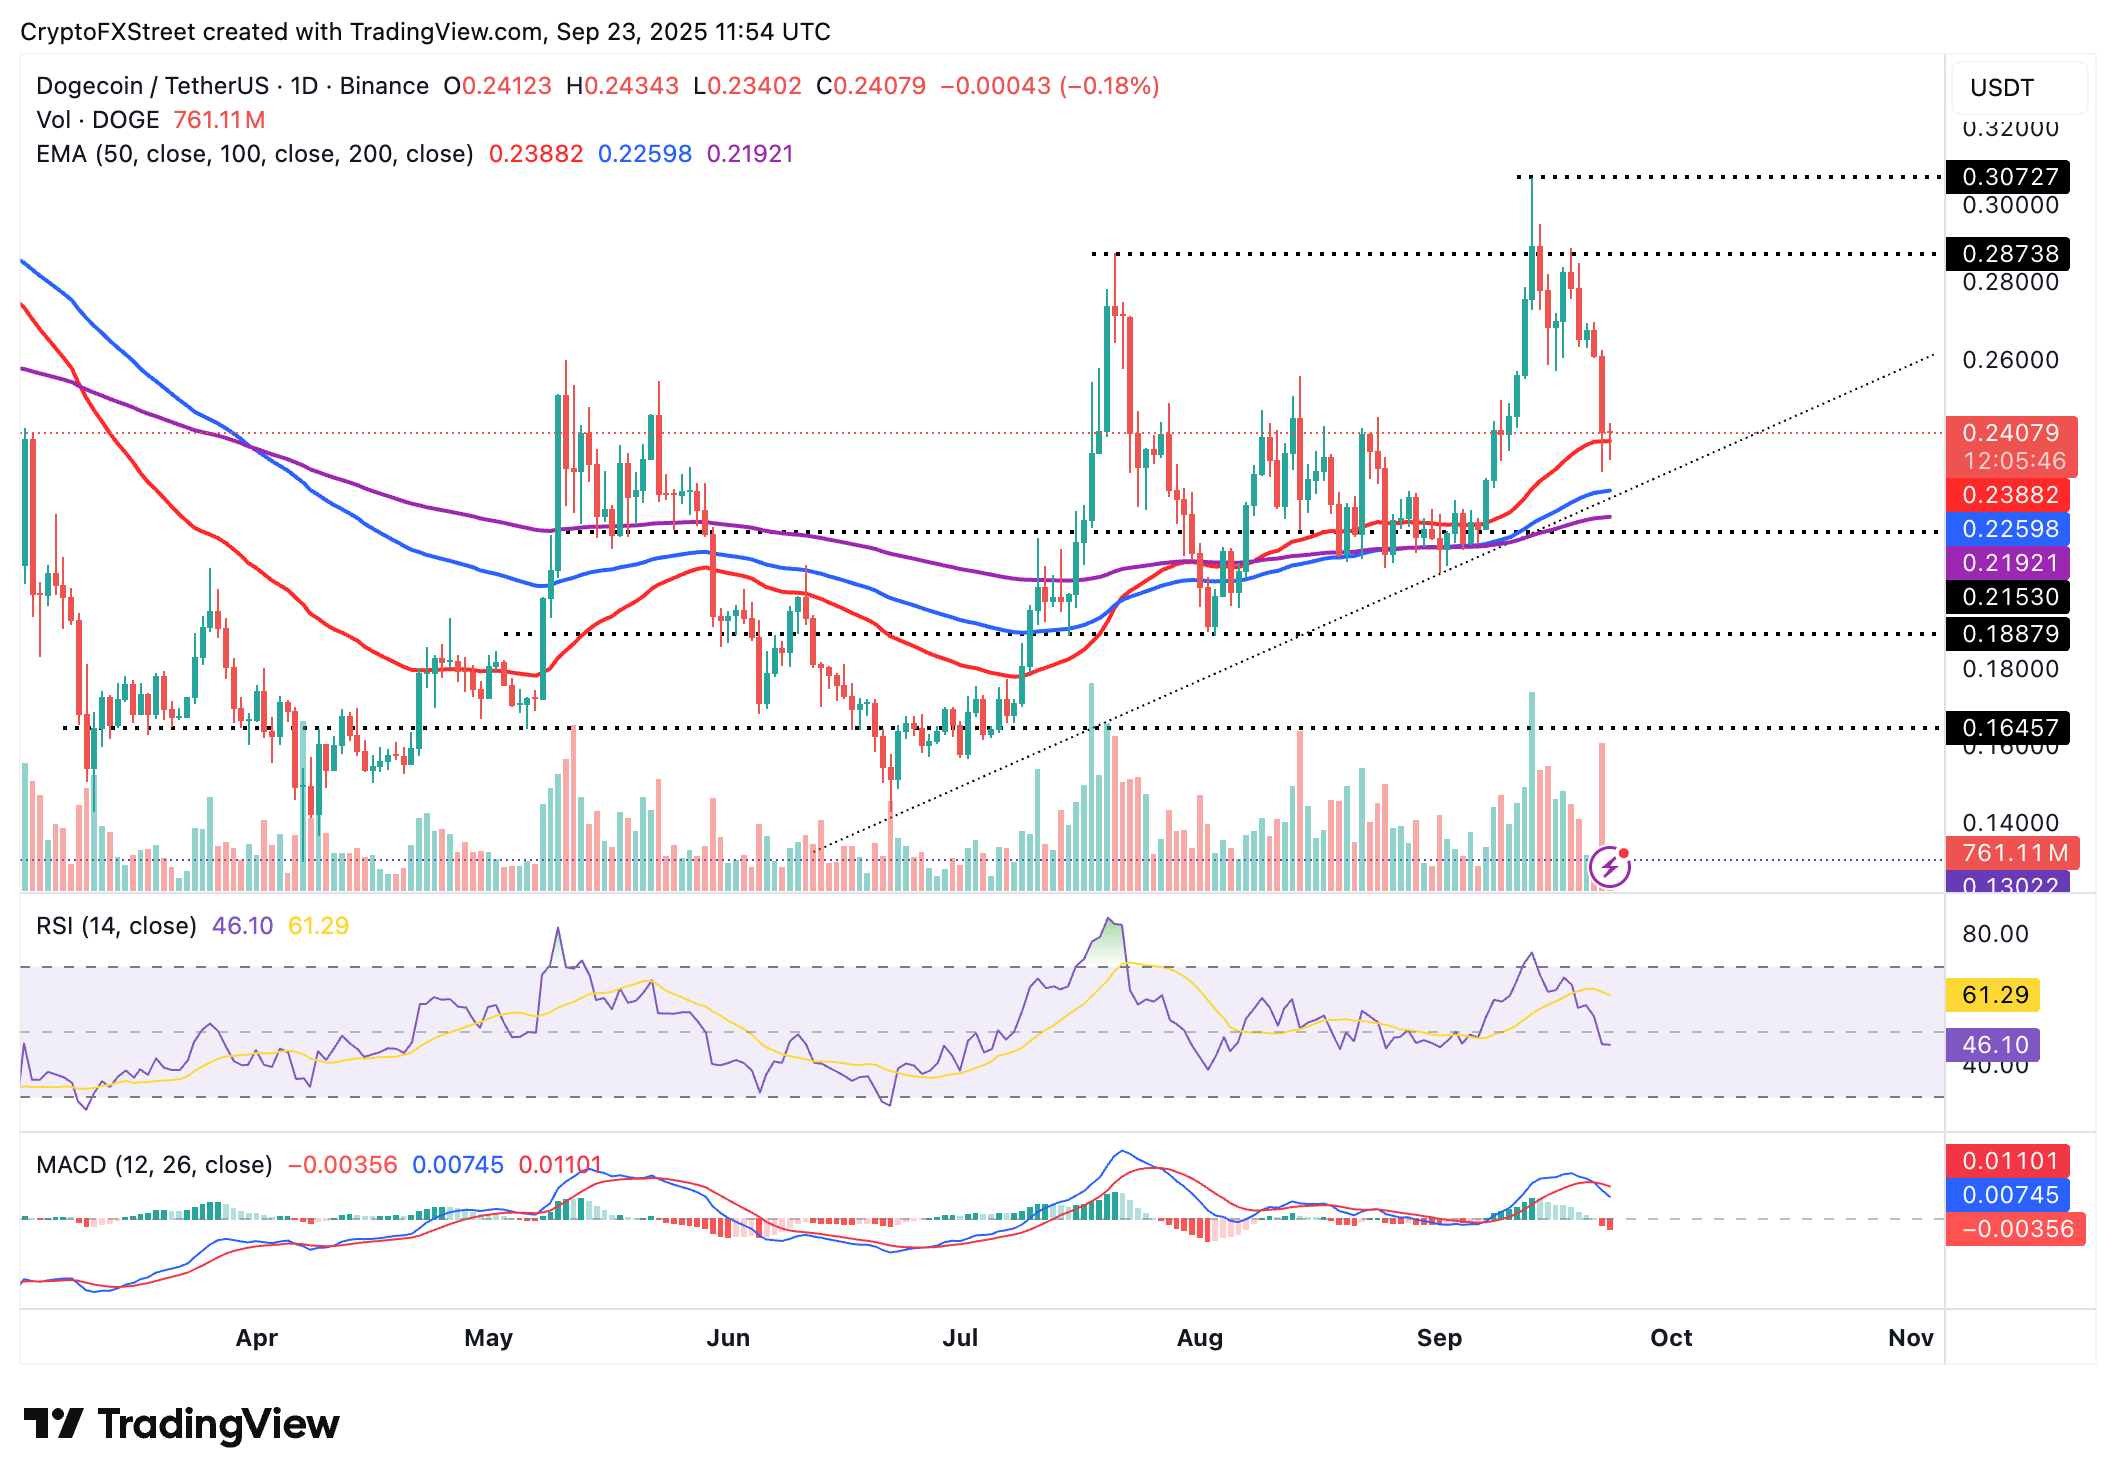
DOGE/USDT daily chart
Key levels for traders in upcoming sessions are the 50-day EMA, providing support at $0.2387; the 100-day EMA at $0.2259; and the 200-day EMA at $0.2192, all of which would serve as tentative support if declines accelerate.
Still, a daily close above the 50-day EMA cannot be ruled out. If traders aggressively buy the dip, dogecoin could begin its recovery toward last week’s peak of $0.3072 as the tailwind steadies.
Cryptocurrency metrics FAQs
What is circulating supply?
The developer or creator of each cryptocurrency decides on the total number of tokens that can be minted or issued. Only a certain number of these assets can be minted by mining, staking or other mechanisms. This is defined by the algorithm of the underlying blockchain technology. On the other hand, circulating supply can also be decreased via actions such as burning tokens, or mistakenly sending assets to addresses of other incompatible blockchains.
What is market capitalization?
Market capitalization is the result of multiplying the circulating supply of a certain asset by the asset’s current market value.
What is trading volume?
Trading volume refers to the total number of tokens for a specific asset that has been transacted or exchanged between buyers and sellers within set trading hours, for example, 24 hours. It is used to gauge market sentiment, this metric combines all volumes on centralized exchanges and decentralized exchanges. Increasing trading volume often denotes the demand for a certain asset as more people are buying and selling the cryptocurrency.
What is the funding rate?
Funding rates are a concept designed to encourage traders to take positions and ensure perpetual contract prices match spot markets. It defines a mechanism by exchanges to ensure that future prices and index prices periodic payments regularly converge. When the funding rate is positive, the price of the perpetual contract is higher than the mark price. This means traders who are bullish and have opened long positions pay traders who are in short positions. On the other hand, a negative funding rate means perpetual prices are below the mark price, and hence traders with short positions pay traders who have opened long positions.
