Ethereum Stumbles Below $2.5K—Can Bulls Defend Gains After 40% Weekly Rocket Ride?

Ethereum’s gravity-defying surge hits turbulence as ETH dips under $2,500—traders now eye key support levels after a blistering week fueled by spot market frenzy.
• The pullback comes as no surprise to veterans who’ve seen this movie before: retail FOMO pumps, whales dump. Will the ’hold the line’ brigade step in?
• Behind the 40% weekly explosion: institutional accumulation meets Main Street discovering ’digital gold 2.0’ (just as Wall Street bankers start calling it a ’mature asset class’ with straight faces).
Next move? Charts whisper ’buy the dip’ while skeptics count down to leveraged longs getting liquidated. Place your bets—the casino never closes.
Organic Demand Fuels ETH Price Action as Leverage Declines
Unlike many crypto rallies motivated by too high leverage and speculation, Ethereum’s recent price motion is mostly driven by actual spot market demand. Early May saw Ethereum’s estimated leverage ratio (ELR) decline dramatically from 0.75 to 0.69 based on on-chain statistics, suggesting traders are utilizing less leverage in derivative markets.
Along with significant trade outflows—roughly 323,700 ETH left exchanges in only the past four days—this drop in leverage coincides with With Ethereum’s Total Value Staked rising by more than 180,000 ETH in the previous week alone, much of this outflow has been focused on staking methods. These measures strongly imply that rather than short-term speculative trading, investors are using longer-term holding techniques.
“The current momentum appears to be primarily spot-driven, rather than driven by speculative futures trading,” said CryptoQuant analyst ShayanMarkets, who underlined that ETH funding rates have remained “relatively flat” despite the considerable price increase—a rare occurrence in such significant rallies.
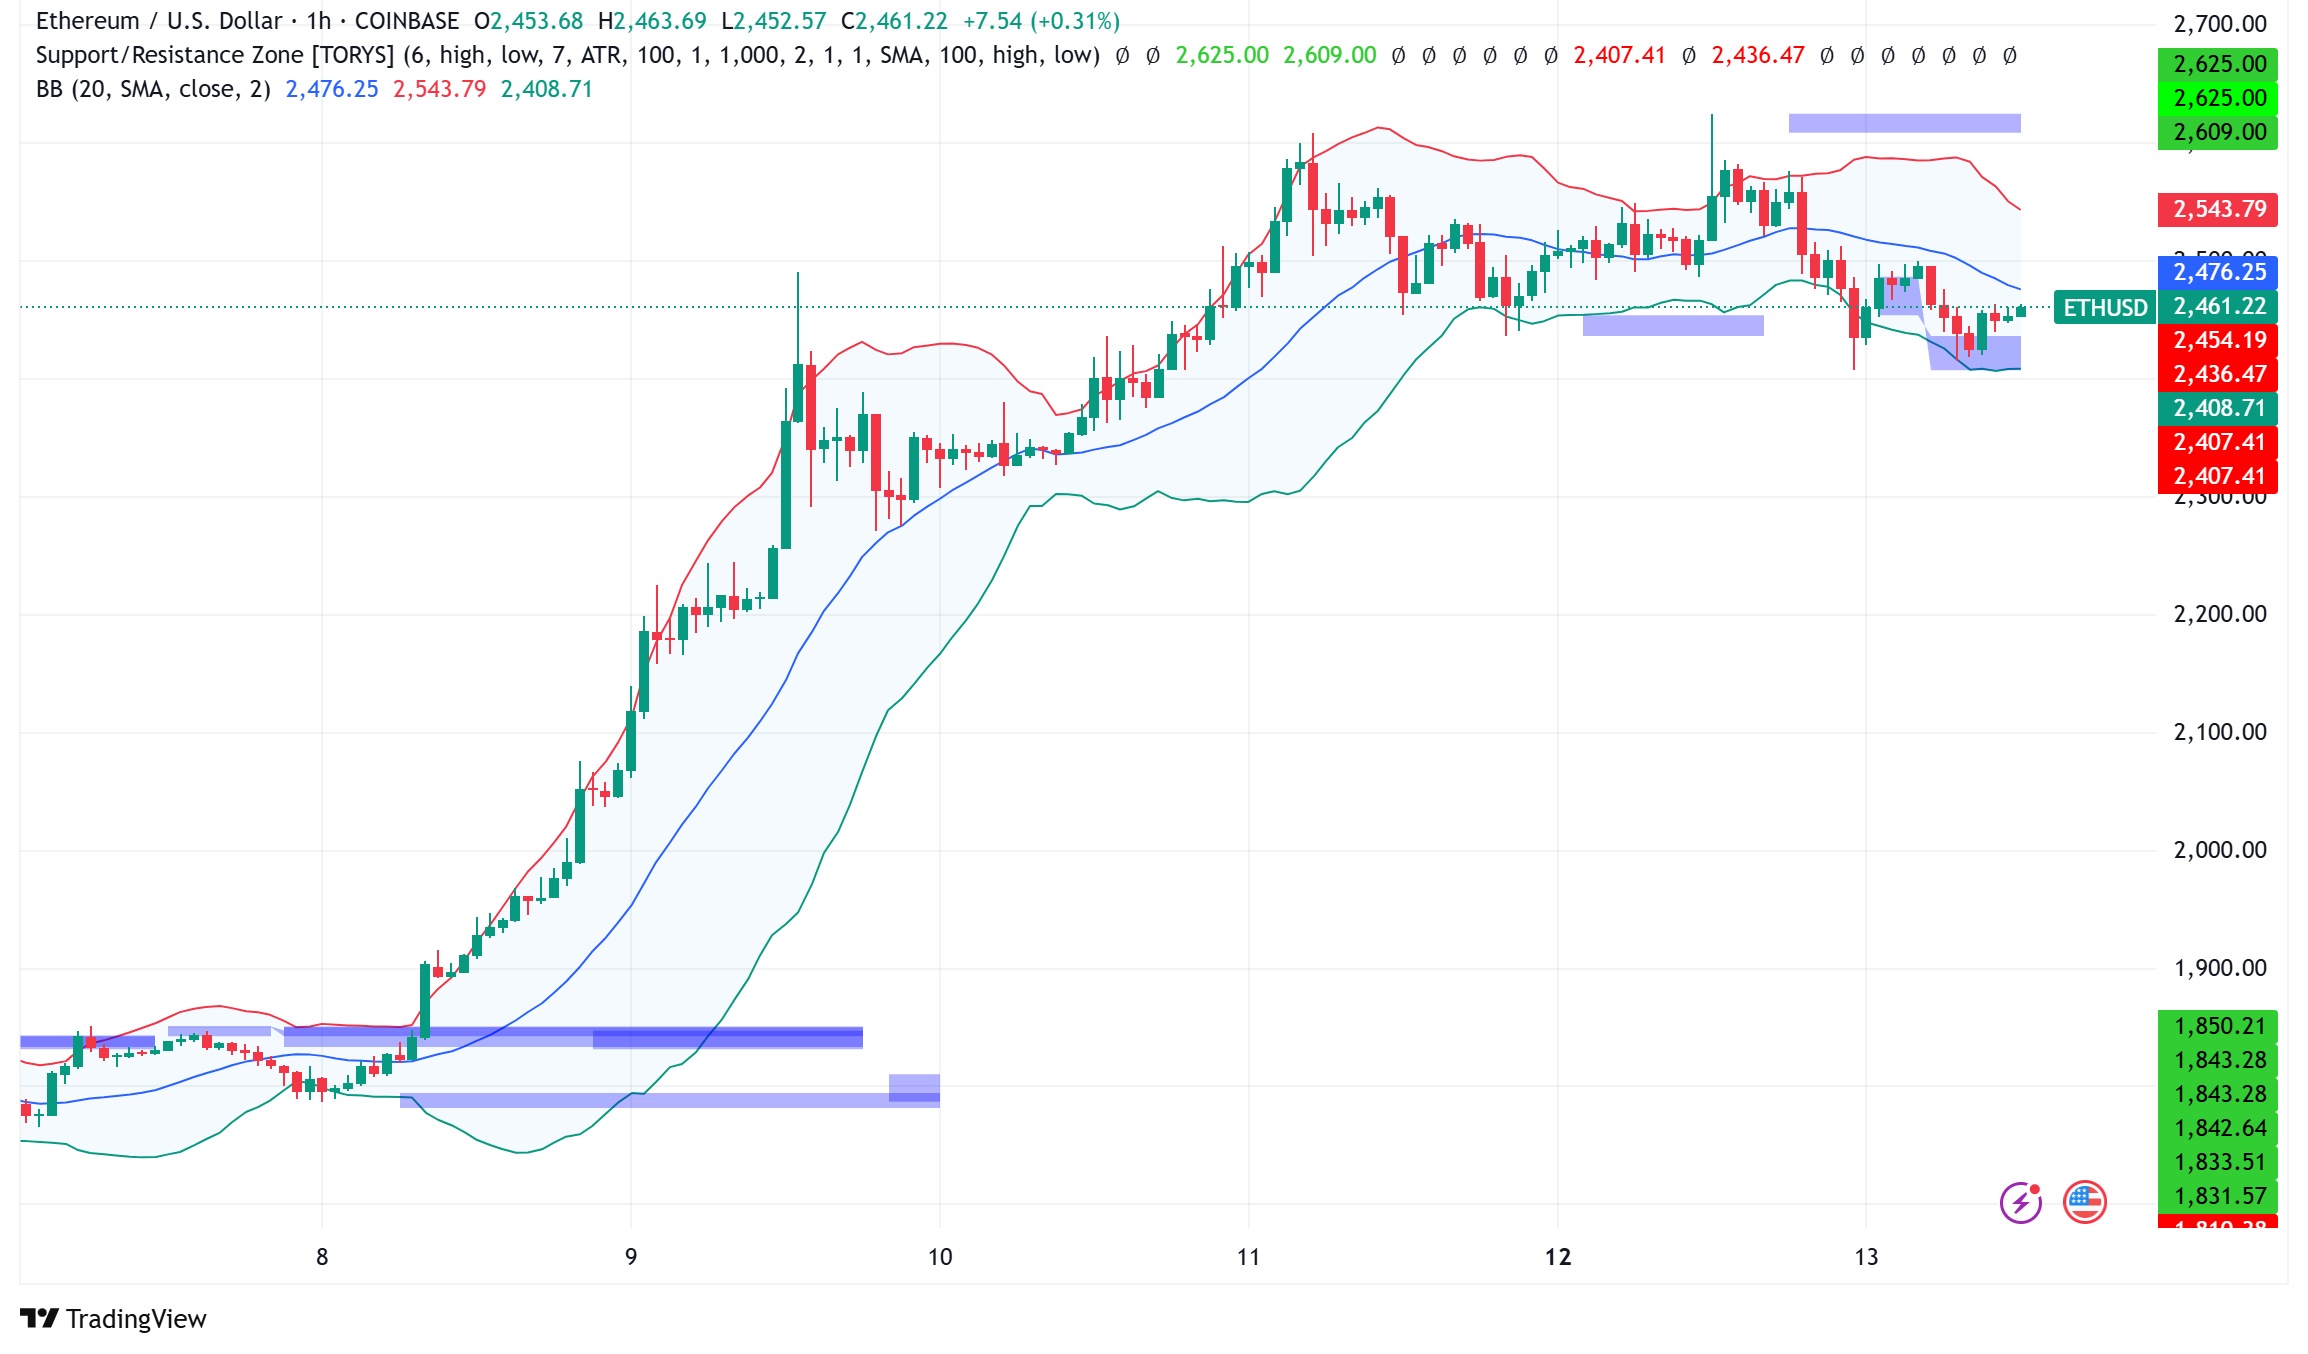
ETH/USD Technical Analysis: Key Support and Resistance Levels
Technically, Ethereum is now negotiating a turning point following a peak of $2,624 before starting a correction phase. Though bulls remain active above the $2,400 level and the 100-hourly Simple Moving Average, the price has broke below a bullish trend line with support at $2,500 on the hourly chart.
Key resistance levels to watch
- $2,500 (immediate resistance)
- $2,550 (secondary resistance)
- $2,620-$2,650 (major resistance zone)
On the downside, Ethereum has established strong support at:
- $2,400 (initial support)
- $2,350 (major support coinciding with the 76.4% Fibonacci retracement level)
- $2,260-$2,110 (deeper support range strengthened by the 100-day SMA)
With about 10 million wallets containing almost 69 million ETH between $2,060 and $2,420, crypto expert Ali Martinez notes that Ethereum’s essential support now falls inside this range. During any pullback, this large holder concentration could offer notable pricing support.
Recent Ether Liquidations and Potential for Continued Growth
Over the previous 24 hours, the current slump has produced roughly $166.89 million in futures liquidations; bullish positions account for $112.08 million and short positions for $54.81 million. By eliminating too much market froth, this rebalancing may even help Ethereum’s position to be strengthened.
Technical indicators including the Relative Strength Index (RSI) and Stochastic oscillator have entered overbought territory following such a significant rise, implying a time of consolidation may be required before yet another leg up. ETH might attempt the $2,850 resistance level in the short term, nevertheless, provided it can keep support and create a bullish flag pattern.
Fundamental Catalysts Behind the Rally
There are numerous main basic reasons why Ethereum performs so brilliantly:
- Successful Pectra Upgrade Rollout: Applied on May 7, the most recent Pectra network upgrade has raised Ethereum’s scaling capacity’s confidence. The upgrade increased wallet usability and staking restrictions, therefore improving the general functionality of the network.
- Improving Macro Environment: Reducing world trade tensions—especially between the US and China—has made risk assets, including cryptocurrency more welcome.
- Institutional Interest: Although Ethereum ETFs have witnessed minor withdrawals ($55 million), the total crypto market has drawn significant institutional money; last week’s net inflows for Bitcoin ETFs were $600 million.
- Shifts in Market Psychology: After languishing behind other big cryptocurrencies including Bitcoin, Solana, and XRP for much of the past year, Ethereum seems to be gaining up as investor mood moves in its favor.
Ethereum Price Prediction: Cautious Optimism, Further Upside
Several analysts have optimistic medium term views for Ethereum based on present measurements and market dynamics. Derive.xyz’s volatility models indicate that, from just 9% last week, there now is a 20% chance Ethereum will surpass $4,000 by year-end.
Strong ETF inflows and favorable legislative developments are among five bullish elements crypto expert Ted Pillows has identified that might drive ETH over $12,000 in 2025. More conservative calculations, however, indicate Ethereum must first pass the 200-day Simple Moving Average barrier at $2,544 to support the present upward trend.
Analysts advise funding rates should start to rise, reflecting rising confidence and more aggressive positioning by futures traders, if the surge keeps with conviction. Consolidation could be required before testing new highs without this validation and continuous institutional impetus.

Log in to Reply
Log in to comment your thoughtsComments
Related Articles
|Square
Get the BTCC app to start your crypto journey
Get started today Scan to join our 100M+ users