Solana’s V-Shaped Recovery Targets $250 as Network Activity Surges

Solana (SOL) stages a dramatic comeback, with price action forming a textbook V-shaped recovery pattern as on-chain metrics flash bullish signals. The network’s daily active addresses and transaction volume hit 90-day highs, fueling speculation of a retest of the $250 resistance level.
Market Structure Breakthrough: SOL’s 30% weekly surge coincides with a spike in DeFi TVL and NFT trading volume—proving the chain isn’t just surviving last year’s outages, but thriving. Validators report the highest staking participation since FTX collapsed.
Institutional Whisper: OTC desks note hedge funds accumulating SOL while retail traders remain distracted by meme coins. "The smart money’s betting on infrastructure plays again," says a Genesis Block trader, "even if they’ll deny it at the next Davos panel."
Solana’s Booming On-Chain Activity and Rising Demand
Currently standing as the second-largest Layer-1 by Total Value Locked (TVL), Solana is establishing its status as a premier blockchain; it has grown by around 25% over the previous 30 days to over $8 billion. Daily DEX volumes are rising by more than 90% since April 11th to $3.14 billion, on-chain activity is skyrocketing. With $21.6 billion in volume last week, Solana oversaw the whole Ethereum Layer-2 ecosystem in weekly distributed exchange activity. TVL and weekly volumes of specific protocols such Sanctum, Raydium, and Lifinity show notable increase indicating a robust comeback in network utilization and basic strength.
Demand signals also point ahead. Open long holdings in the futures market rose before SOL’s most recent surge over $150. At $5.86 billion, Solana’s Open Interest stands third in the crypto world; meanwhile, perpetual futures funding rates have turned positive, suggesting more capital is into the market and driving buying demand.
SOL/USD Technical Analysis: Bullish Patterns Point to Significant Upside
Solana’s recent price action presents a convincing optimistic picture. Starting in January, a V-shaped recovery pattern has been building on the weekly chart, implying a quick rebound following a significant downturn. This pattern targets the $250 level as its “neckline” for completion.
Moreover, SOL clearly broke out from a long-term declining price channel on the daily chart in April with more volume, therefore verifying a change from a bearish trend to a bullish one marked by better lows and higher highs. One could consider the present phase of consolidation as inevitable in the continuance of this rise.
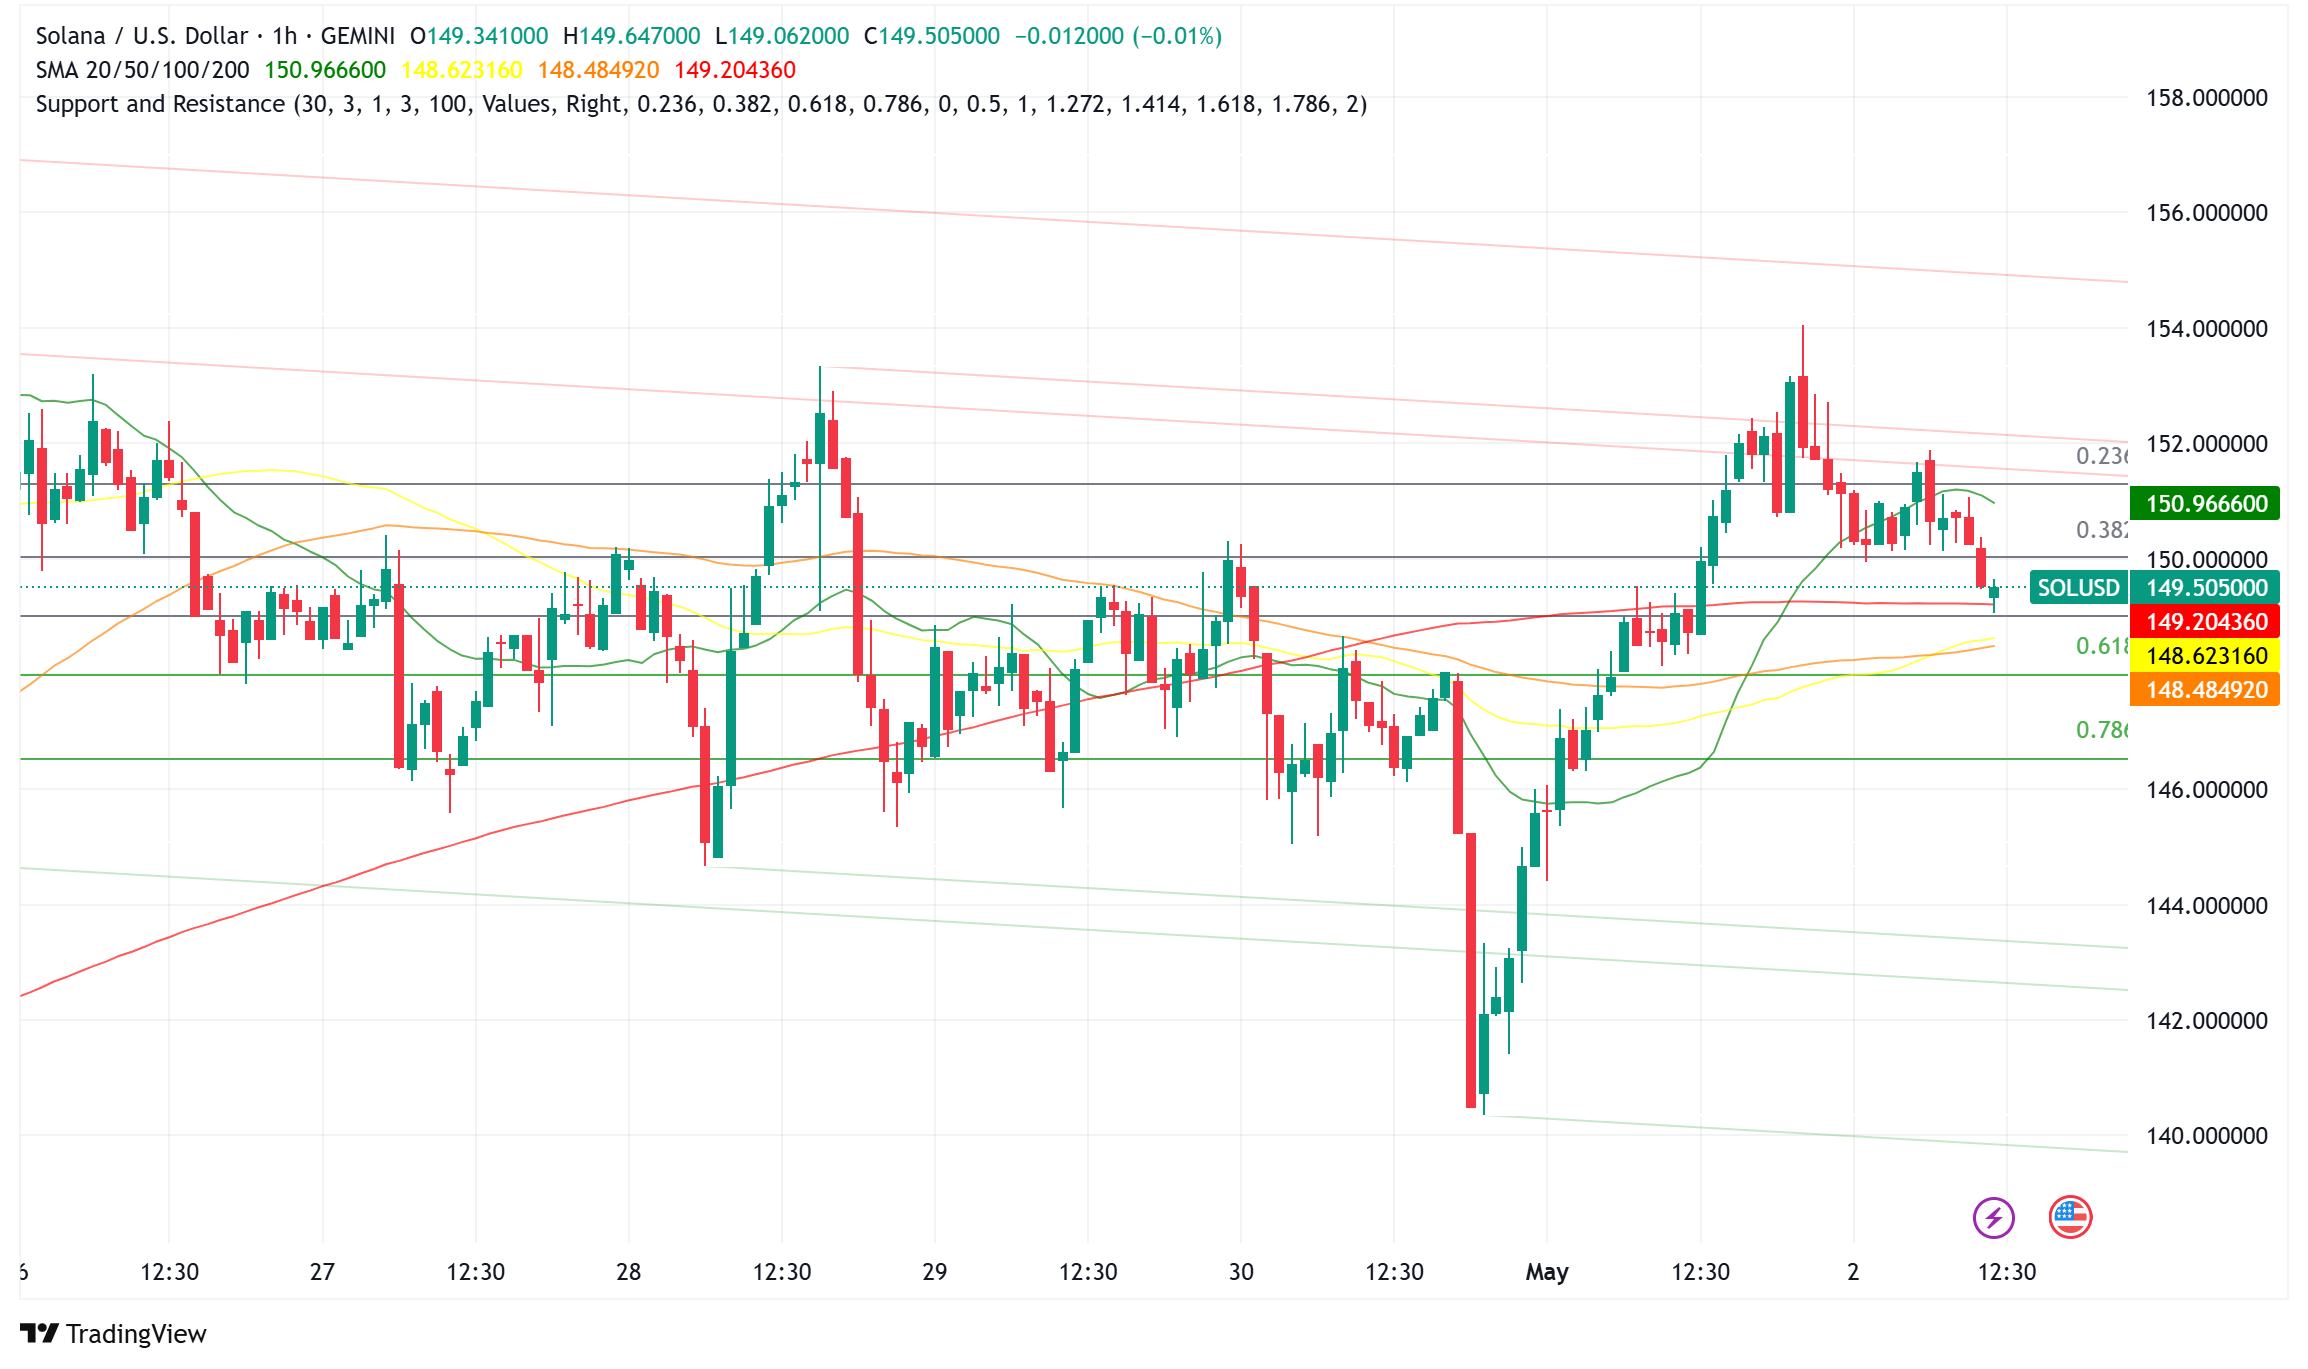
Particularly important technical levels are under close observation. Having broken over a negative trend line close to $149, Solana is trading above the $150 mark and the 100-hourly Simple Moving Average. Between $160 and $200 there is a notable resistance zone where the 50-day SMA resides.
The bulls must clear this area if they are to keep on the V-shaped recovery toward $250. Strong support has developed in the $145-$148 range below current price, indicating a good price structure. Previously acting as resistance, this range indicates Acting as strong dynamic support, the 4-hour chart displays EMAs grouped below the price. The rising RSI points to hopeful momentum gathering.
Solana Price Prediction: Breaking Resistance Eyes $250 and ATHs
Solana’s capacity to clear the resistance zone between $152 and $154 will directly affect its price horizon. A good advance above $154, especially closing above the primary barrier at $158, might open the path for more gains above $165 and maybe $180. Getting beyond the $160–$200 supply-demand zone is the key difficulty.
Targeting $250, clearing this region would confirm the V-shaped recovery pattern. Beyond the $250 neckline, experts see a strong 92% gain from current levels reaching Solana’s all-time highs around $294. On the other hand, failing to clear $154 would see SOL test supports at $150, $147, and $145, with a closure below $145 running a danger towards the $140 support zone.
Spot Solana ETF Hopes Add to Long-Term Potential
The possibility of a US spot Solana ETF adds to the optimism. Reflecting increasing confidence and adding a major potential fundamental driver for future institutional demand and more market access, Bloomberg Intelligence analysts have greatly raised their projected odds of approval in 2025 to 90%.
Ultimately, Solana is displaying strong fundamental growth along with increasing demand signals and explosive on-chain activity under favorable technical patterns including the V-shaped rebound and channel breakout. Supported by rising ETF approval possibilities, unlocking the road towards $250 and maybe new all-time highs depends on clearing the critical $160-$200 resistance zone.
