USD GDP & Inflation Data Drops Alongside Big Tech Earnings—Market Braces for Impact

April 30 brings a double whammy for traders: US economic data and tech giant earnings collide. Will Meta and Microsoft’s numbers outweigh inflation jitters—or just add fuel to the fire?
GDP figures drop first—expect the usual spin from both bulls and bears. Then comes the PCE inflation print, because apparently we needed another reminder that prices won’t stop rising.
Meanwhile, Meta and Microsoft report earnings. Will AI hype save their stocks, or will reality bite? Either way, traders are glued to screens—coffee consumption spikes expected.
Bonus cynicism: If past performance is any indication, today’s market reactions will make perfect sense... next week.
Today’s Market Outlook: Major Earnings Reports to Watch
Today we will have more earnings from some big names such as Microsoft (MSFT), Meta (META), Caterpillar (CAT), Robinhood (HOOD), Qualcomm (QCOM) etc which will keep stock traders on edge.
Australian Inflation TrendsAcross the Pacific, Australian inflation data showed slightly hotter-than-expected figures. Headline CPI for Q1 2025 came in at 2.4% year-on-year, ahead of the anticipated 2.2%, though unchanged from the previous quarter. On a quarterly basis, CPI ROSE 0.9%, above the forecast of 0.2%.
Core inflation measures were mixed. The trimmed mean rose 0.7% quarter-on-quarter and 2.9% annually—matching expectations on a quarterly basis but showing a decline from the previous year’s 3.2%. The weighted median also showed a 0.7% quarterly gain and a 3.0% year-on-year rise, slightly above forecasts but down from the prior 3.4%.
Despite the mild upside surprise, the overall picture suggests inflation is moderating, giving the Reserve Bank of Australia potential room to lower interest rates again at its May meeting.
US GDP & Inflation ExpectationsAttention now turns to key upcoming U.S. economic data. The first estimate of Q1 GDP is due later today, and expectations have been sharply revised downward. The consensus forecast calls for just 0.4% quarter-on-quarter growth, a significant drop from 2.4% in the previous quarter. Some forecasts suggest annualized GDP growth could come in as low as 0.1%, reflecting a notable slowdown from recent quarters when consumer spending had underpinned stronger performance.
Markets are also watching U.S. Personal Consumption Expenditures (PCE) data closely. This key inflation metric, monitored closely by the Fed, is projected to have risen just 0.1% in March—down from 0.4% in February—signaling cooling inflationary pressures that may support further dovish moves by the central bank.
Last week, markets were chaotic, with gold soaring $500 in the final three days, the EUR/USD surging 5 cents, and stock markets opening down before turning upward. The moves were big, and the volatility was enormous, so we opened 40 trading signals in total, finishing the week with 25 winning signals and 15 losing ones.
Gold Continues Range Bound Trading
Gold had a volatile fortnight. After breaking above $3,500 per ounce for the first time, the precious metal quickly plunged by $250. But sentiment flipped rapidly after dovish commentary from Fed Chair Jerome Powell and escalating global tensions. This reignited bullish momentum, lifting gold back above $3,300 and eventually pushing it to a new record high of $3,444—more than $500 above its recent low. Still, renewed Optimism around trade talks temporarily weighed on gold, dragging it briefly below $3,300 again before buyers stepped in, sending it $100 higher in a matter of hours.
GBP/USD Surges to the Highest Level Since 2022
The foreign exchange market also saw notable developments. GBP/USD broke through 1.34 for the first time since late 2022, although it failed to hold that level by the close. Resistance at 1.3440 remains the key level to watch, unchanged since September last year. Overall, the British pound outperformed major peers, including the euro, U.S. dollar, and commodity-linked currencies such as the CAD and AUD, ending April on a strong note.
GBP/USD – Weekly Chart
Cryptocurrency Update
Bitcoin Rebounds Off the 500 Weekly SMA
In cryptocurrencies, Bitcoin experienced another dramatic swing. After dipping below $75,000 and testing its 50-week moving average, it staged a powerful comeback, fueled by renewed enthusiasm for growth and tech, partly stoked by Trump’s campaign rhetoric. Bitcoin soared past $93,000 and is now consolidating just under $95,000, having cleared the crucial 100-day moving average.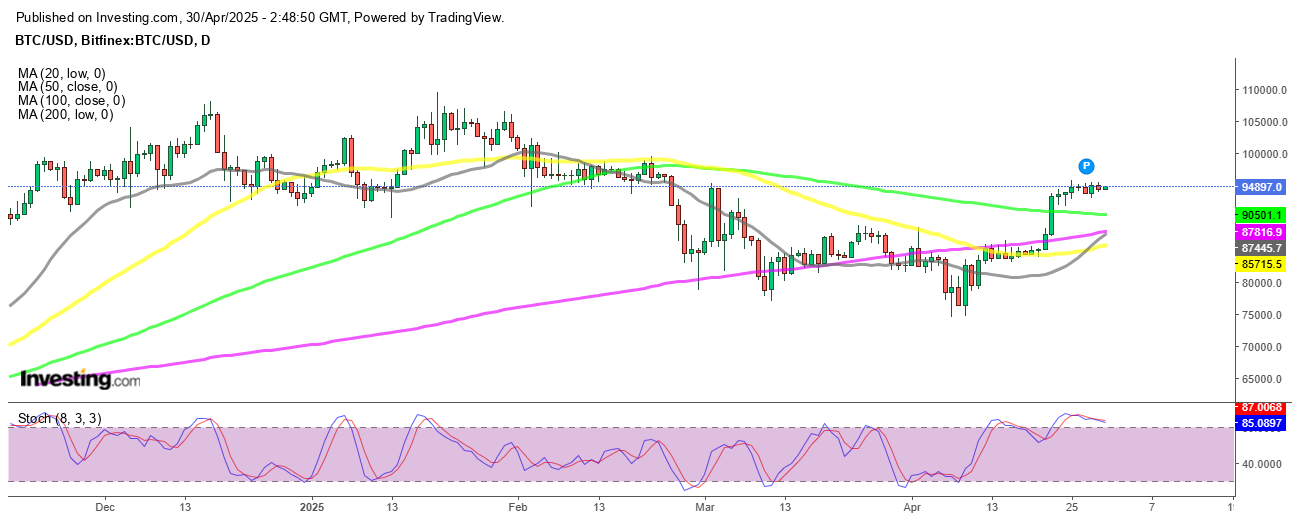
BTC/USD – Weekly chart
XRP Climbs Above the 50 Daily SMA
Ripple (XRP) also held firm, bouncing off key support between $1.80 and $2.20. It now trades steadily at $2.20, above its 50-day moving average, with technical momentum suggesting more upside potential if broader altcoin sentiment remains positive.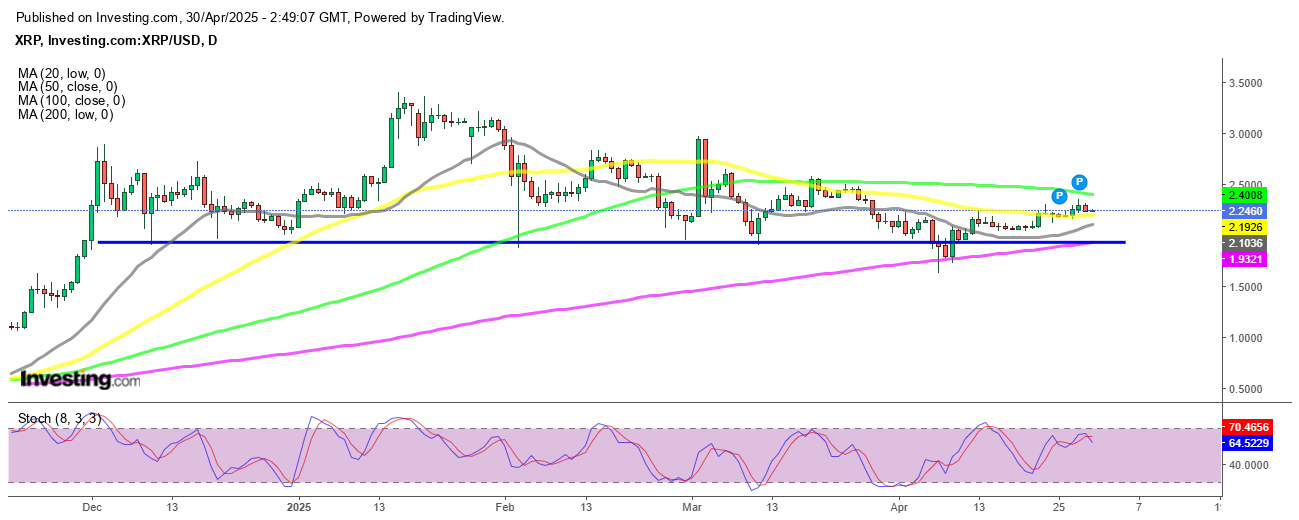
XRP/USD – Daily Chart

Log in to Reply
Log in to comment your thoughtsComments
Related Articles
|Square
Get the BTCC app to start your crypto journey
Get started today Scan to join our 100M+ users