WTI Crude Teeters at $64.26 as Symmetrical Triangle Tightens Ahead of OPEC+ Decision

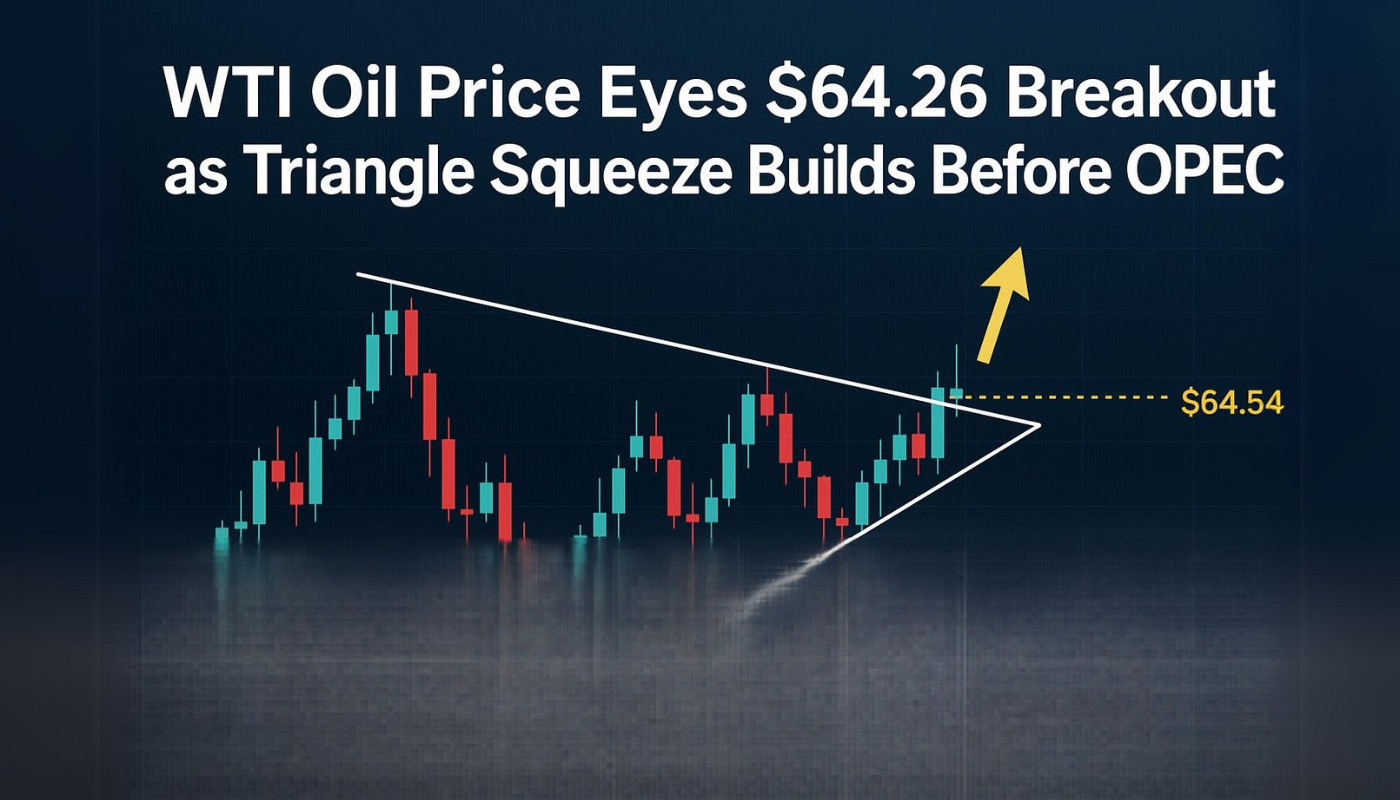
Oil traders are glued to their screens as WTI forms a textbook symmetrical triangle—the kind of setup that makes technical analysts salivate. A breakout above $64.26 could trigger algorithmic buying frenzies, while failure here might see crude tumble back toward April lows.
All eyes on OPEC+’s next move. Will they cut production to prop up prices, or let ‘market forces’ (read: hedge fund algo clusters) decide? Either way, someone’s getting squeezed—probably retail traders.
Funny how these ‘supply-demand’ meetings always seem to coincide with max pain points on the options chain. Just saying.
OPEC+ and Global Trade Jitters
While traders wait for supply decisions, broader geopolitical trends are adding volatility. Investors are following nuclear talks between Iran and US, with Iranian Foreign Minister Abbas Araqchi saying there’s limited optimism.
Separately, an explosion at Iran’s Bandar Abbas port – the country’s largest – killed at least 40 and injured over 1,200, raising concerns about infrastructure stability in an oil producing nation.
Meanwhile, US-Ukraine talks are showing diplomatic progress, but markets are focused on trade disputes as the bigger economic risk.
Key factors affecting oil sentiment:
Iran’s nuclear talks uncertainty
Middle East supply disruption risks
Cautious optimism for a Russia-Ukraine deal
IMF/World Bank Spring Meeting signals on global demand
WTI Crude Oil Chart: Breakout or Breakdown?
On the chart, WTI Crude is compressing into a symmetrical triangle on the 1-hour chart. The price is above the 50-hour EMA ($62.88) and between support at $62.27 and resistance at $63.67.For newbies, this is a triangle squeeze. A clean breakout above $63.67 could take prices to $64.26 and $64.84. Below $62.27 and it’s downside to $61.81.
WTI Oil Price Chart – Source: TradingviewTrade Setup:
Buy Breakout: Above $63.67
Targets: $64.26 and $64.84
Support to Watch: $62.27
Stop-Loss: Below $61.81
Be patient. Wait for a clean breakout before entering, as whipsaws are common when patterns compress at apex.

Log in to Reply
Log in to comment your thoughtsComments
Related Articles
|Square
Get the BTCC app to start your crypto journey
Get started today Scan to join our 100M+ users