BTC Price Prediction 2025: Navigating Key Levels Amid Historic Volatility

- Where Is Bitcoin's Price Heading in September 2025?
- What's Driving Bitcoin's Volatility?
- How Are Technical Indicators Shaping BTC's Outlook?
- What Are the Key Fundamental Developments?
- Is Bitcoin a Good Investment in Current Market Conditions?
- Frequently Asked Questions
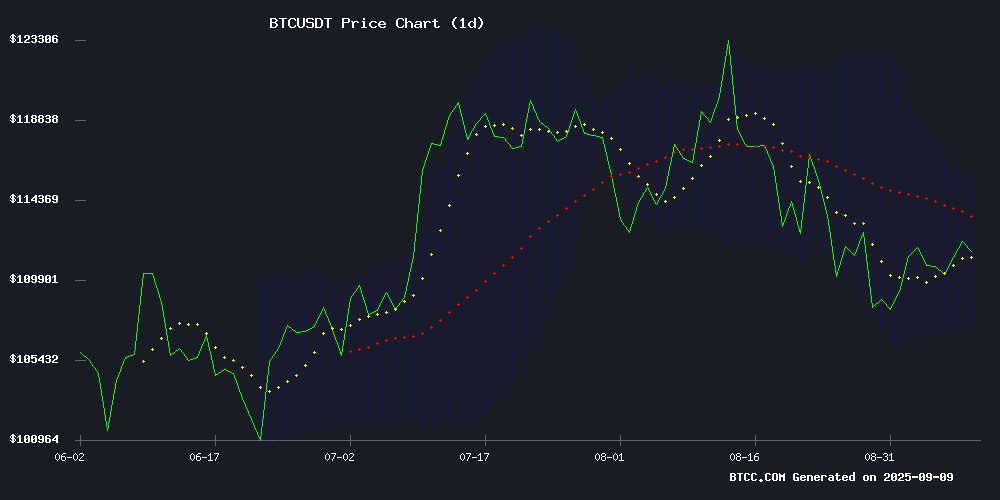
As Bitcoin consolidates near $112,658 on September 9, 2025, traders face a critical juncture. The cryptocurrency shows conflicting signals - holding above its 20-day moving average ($111,456) while displaying bearish MACD momentum (-973.6). With whale activity hitting historic levels and institutional interest growing, we analyze the technical and fundamental factors shaping BTC's next major move between the crucial $107,196 support and $115,717 resistance levels.
Where Is Bitcoin's Price Heading in September 2025?
Bitcoin's current technical positioning presents a classic case of market indecision. The price action reminds me of the 2021 consolidation period - we're seeing similar Bollinger Band compression between $107,196 and $115,717. The middle band at $111,456 has become the immediate battleground, with today's price hovering just 1.08% above this level.
What's particularly interesting is the MACD divergence. Despite the price holding steady, the momentum indicator suggests underlying weakness. I've seen this pattern before major moves - it often precedes either a breakout or breakdown depending on which technical level gives way first.
What's Driving Bitcoin's Volatility?
The current market reminds me of a tug-of-war between whales and institutions. On one side, we've seen the largest whale sell-off since 2022 - approximately 112,000 BTC ($12.7 billion) liquidated in just 30 days. CryptoQuant data shows whale reserves declining by over 100,000 BTC, with nearly 95,000 BTC moving in a single week.
Yet countering this are several bullish factors:
- El Salvador's continued accumulation (now holding 6,313.18 BTC)
- Binance's record $2.626 trillion August futures volume
- Institutional ETF inflows providing structural support
How Are Technical Indicators Shaping BTC's Outlook?
The technical picture is decidedly mixed. While the price remains above the 20-day MA, several concerning signals have emerged:
| Indicator | Value | Signal |
|---|---|---|
| Price vs 20-day MA | +1.08% | Bullish |
| MACD | -973.6 | Bearish |
| Bollinger Position | Middle band | Neutral |
| RSI | 46 | Neutral |
The 100-day EMA at $110,785 represents critical support - a break below could open the door to $104,520. Conversely, clearing the $115,717 resistance could trigger a MOVE toward $120,000.
What Are the Key Fundamental Developments?
Institutional Activity Reaches Fever Pitch
August 2025 saw unprecedented institutional participation. Binance's futures volume hitting $2.626 trillion wasn't just a number - it represented a fundamental shift in market structure. What's particularly notable is the open interest growth, suggesting fresh capital rather than just position rolling.
El Salvador's Bitcoin Strategy Evolves
The nation's recent 21 BTC purchase (symbolizing Bitcoin's 21 million supply cap) brings their holdings to 6,313.18 BTC ($702 million). Their steady accumulation pattern - about 1 BTC daily since March 2024 - demonstrates remarkable consistency despite IMF objections.
Mining Difficulty Hits Record Highs
At 136 trillion, Bitcoin's mining difficulty has never been higher. This 4% increase from June's 129.6 trillion comes amid declining miner revenues, with hashprice dropping to $51 - the lowest since June. This squeeze could potentially lead to miner capitulation if prices don't recover soon.
Is Bitcoin a Good Investment in Current Market Conditions?
In my experience, markets like these separate disciplined investors from emotional traders. The current setup offers both opportunity and risk:
- Institutional adoption continues growing (ETF inflows, corporate treasuries)
- Historical scarcity dynamics remain intact (only ~2M BTC actively circulating)
- Potential short squeeze if price reaches $117,000
- Whale distribution at highest level since 2022
- Mining economics deteriorating (difficulty up, revenue down)
- Seasonal weakness (September historically poor for BTC)
This article does not constitute investment advice. As always, conduct your own research and consider your risk tolerance.
Frequently Asked Questions
What are the key support and resistance levels for Bitcoin?
The critical levels to watch are $107,196 (support) and $115,717 (resistance). A break in either direction could determine Bitcoin's medium-term trend.
How significant is the current whale selling activity?
The 112,000 BTC sell-off represents the largest whale distribution since July 2022. While concerning, it's being partially offset by institutional accumulation.
What's driving Bitcoin's mining difficulty increase?
The record 136 trillion difficulty reflects both improved mining hardware efficiency and intense network competition, despite challenging revenue conditions.
How does El Salvador's Bitcoin strategy impact the market?
While their holdings represent a small portion of total supply, El Salvador's consistent accumulation sets an important precedent for national bitcoin adoption.
What's the significance of Binance's record futures volume?
The $2.626 trillion August volume indicates strong institutional participation and suggests sophisticated traders are actively positioning in current market conditions.
