Bitcoin Plunges Below Critical Support: $1.7B Vaporized in Mass Liquidations

Bitcoin just shattered its support floor—triggering a cascade of liquidations that wiped out $1.7 billion from over-leveraged traders.
Market Carnage Unfolds
The sell-off didn’t just sting—it crushed bullish positions across major exchanges. Futures markets turned into a bloodbath as margin calls hit hard and fast.
Liquidation Domino Effect
Longs got obliterated. Shorts feasted. And the usual ‘buy the dip’ crowd? Nowhere to be found when it actually mattered—classic crypto ‘strategy.’
Where’s the Bottom?
Nobody knows. But one thing’s clear: when support breaks this decisively, even the diamond hands start sweating. Maybe time to reconsider that 100x leverage, huh?
Why Bitcoin fell
Bitcoin’s drop came from a mix of technical weakness, large holders moving funds, and pressure from Leveraged trading.
Bitcoin fell below a key support level at $115,400, triggering automatic selling in the market. It also stayed below its 30-day average of $112,935, showing that short-term momentum was weakening.
Traders use the RSI to measure how strong buying or selling is in the market. Bitcoin’s RSI is currently 53.65, which is neutral, but it indicates that buying momentum is starting to weaken.
Whales, or major market players, increased the selling pressure. Meanwhile, earlier this month, a long-dormant wallet moved 1,000 BTC ($116.6 million) after 12 years, sparking concern among traders.
Leverage trading also made the market fragile. As bitcoin approached $117,000, many traders had large long and short positions. Open interest, which shows the total value of active contracts, jumped to $937 billion. When the price dropped, these positions were automatically closed, which caused a chain reaction of losses.
Market impact and price action
Bitcoin’s market value is now $2.25 trillion, down 2.41%, with trading volume surging 73.7% to $40.62 billion. The total crypto market fell 4.51%, bringing its value to $3.87 trillion.
From September 18–20, Bitcoin moved mostly sideways, but after September 20, it started trending down. On September 22, a sharp drop occurred. During one hour, the price opened at $113,691, reached a high of $113,698, fell to $111,800, and closed at $112,863.
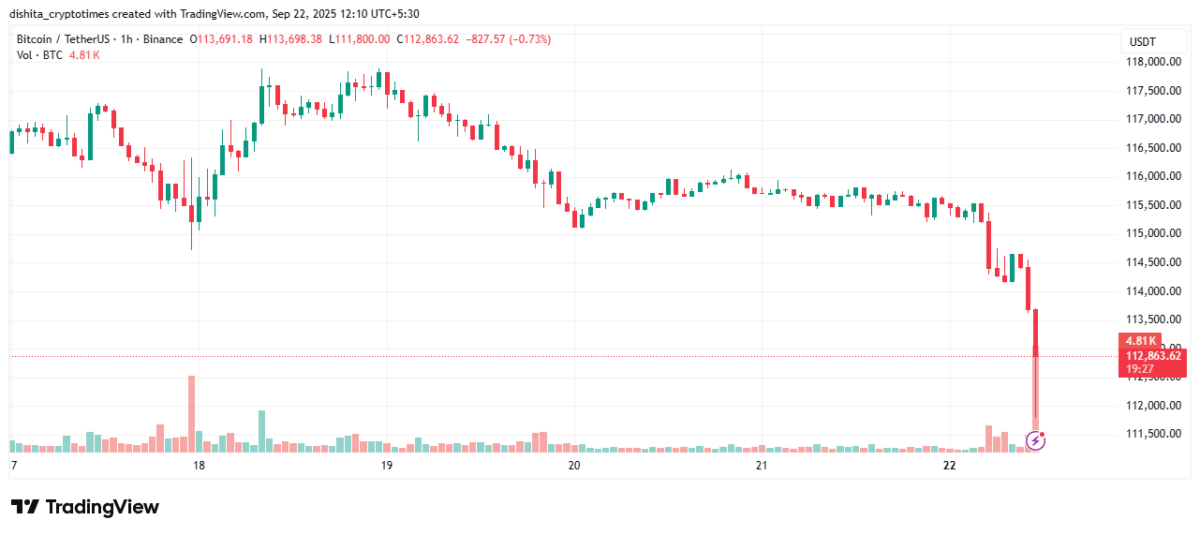
The long lower wick on this candle shows that sellers pushed the price down sharply, but buyers stepped in at $111,800, pushing it back above $112,800 before the hour closed. Buyers tried to hold the price, but it still closed lower, showing sellers were stronger.
What comes next
The key level to watch is $111,800. If buyers continue to defend it, Bitcoin could bounce to $113,500–$114,500. A move above $115,000 WOULD signal recovery. If it breaks below, the price could fall toward $110,000–$111,000, with deeper losses pushing it as low as $108,000–$109,000.
For now, what happens around $111,800 will decide if Bitcoin can hold steady or continue to fall.
Also Read: Bitcoin Whale Buys $680M in BTC Ahead of Fed’s Rate Cut Decision