Bitcoin Defends $113K Support: Will $117.5K Be the Next Breakout?
Bitcoin's holding firm at $113K—traders are watching the charts like hawks. Can the king crypto muster enough momentum to smash through that $117.5K ceiling?
Support Holds—For Now
Buyers stepped in right at the $113K line, propping BTC up and keeping bears at bay. That level's become a battleground—lose it, and things could get messy.
The $117.5K Hurdle
Breaking past $117.5K won’t be a walk in the park. It’s a psychological and technical barrier—one that could trigger another leg up if convincingly taken out.
Market Sentiment: Greed or Caution?
Whales and retail are both eyeing the next move. A clean breakout could spark FOMO; a rejection might invite a deeper pullback. Volatility’s the name of the game.
Institutional players are lurking—always ready to make a move that leaves retail clutching their lattes and lagging behind. Typical.
BTC ETF Shows Strength Despite Recent Outflows
With notable volatility in inflow and outflow of funds, the on-chain data shows a trend pattern. During the last month, bitcoin experienced high purchase and intense selling activities especially during the close period of August where outflow peaked.

Despite recording 3 consecutive days of outflow, the overall net assets are at a high level of $146.18 billion, indicating confidence of long-term holders in the crypto market. Notably, trends of this nature are often recorded prior to large movements in price as the amount of liquidity in and out of the market shifts during this period.
Bitcoin Forms Strong Support At $112,000?
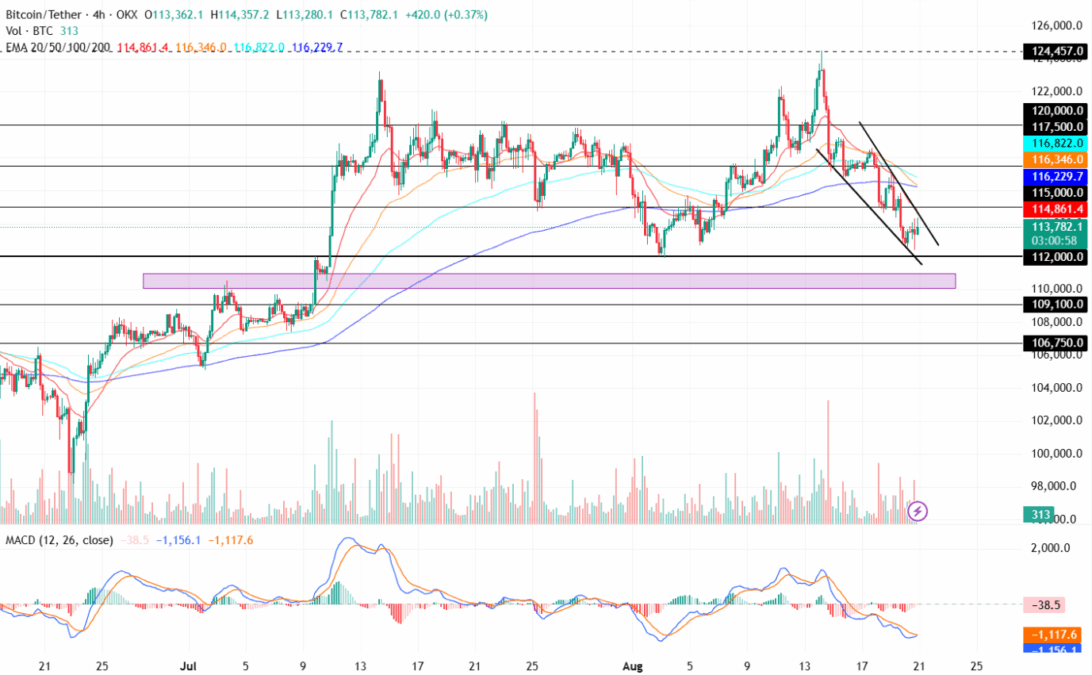
When looking at the chart from TradingView, Bitcoin moved within a dropping channel on the 4-hour time frame after it witnessed a major rejection around the $120,000 level. This type of structure hints at a short-term fix, but in the larger picture, it is considered bullish.

Overall, the structure suggests the favor of the accumulation, and traders impatiently wait for confirmation of a divergence of the trend to upside to start a sizable leg higher.
The MACD (Moving Average Convergence Divergence) is displaying indications of leveling off as it has approached the signal line, necessarily pointing to a possible change in the pace toward the positive side.
In the meantime, the volume of trades is going down and this can be the beginning of a good directional move. Exponential Moving Averages (EMA) are also showing positive setup to support the upward direction. If the rebound sustains enough to push price above 20-day EMA, a range bound action between the 20-day and 500-day EMA, which are currently at around $114,800 to $116,800 respectively.
Moreover, with the 50-day & 200-day trendlines showcasing a bullish convergence, the trend suggests a rising momentum.
Bitcoin Micro Cycle Risk, Source: Willy Woo/X
Despite dropping to $112,500 from a top of around $124,500, the Micro Cycle Risk (MCR) signal line is easing. This suggests that the investor’s liquidity is returning in the market. If this trend continues, the Bitcoin price may record a potential upward price action shortly.
According to on-chain data from glassnode, over 20,000 BTC held for less than 155 days were sold at a loss in the past week, with loss-taking peaking on Tuesday with 23,520 BTC sent to exchanges.
A move out of the channel and a successful retest at $117,500 WOULD confirm the resumed bullish stance and an entry into $120,000 and potentially $124,500.
Considering the Bitcoin chart, the nearest support stands at $112,000. This price point plays an important role as historically the demand has constantly increased at this point.
Crypto Market Structure Bill to Hit Trump’s Desk Before Year End
The Crypto Times does not endorse or promote this digital asset in any manner. This article was created only for educational purposes. Make sure to “DYOR” as the market is highly volatile. New positions should be done by traders being careful and awaiting volume-backed breakouts.


