Cardano’s Price Stalls—Here’s Why the Bullish Supply Signal Isn’t Enough

Cardano's deflationary mechanics are firing on all cylinders—so why is ADA bleeding out?
Supply squeeze meets weak demand
The blockchain's staking rewards and token burns should theoretically send prices soaring. Instead, ADA's chart looks like a lazy river—flatlining while competitors pump. Maybe the 'Ethereum killer' forgot to load its bullets.
Market shrugs at tokenomics
Turns out institutional investors care more about real-world adoption than textbook-perfect supply curves. With Cardano's DeFi TVL still dwarfed by Ethereum's, even the most elegant whitepaper math can't conjure demand from thin air.
Wake-up call for 'perfect asset' theorists
Cardano's predicament exposes crypto's dirty secret: price discovery doesn't give a damn about your beautiful economic models. Until the chain starts processing more than academic praise, ADA risks becoming another case study in 'this time was different' hubris.
Cardano Data Shows Mixed Sentiment
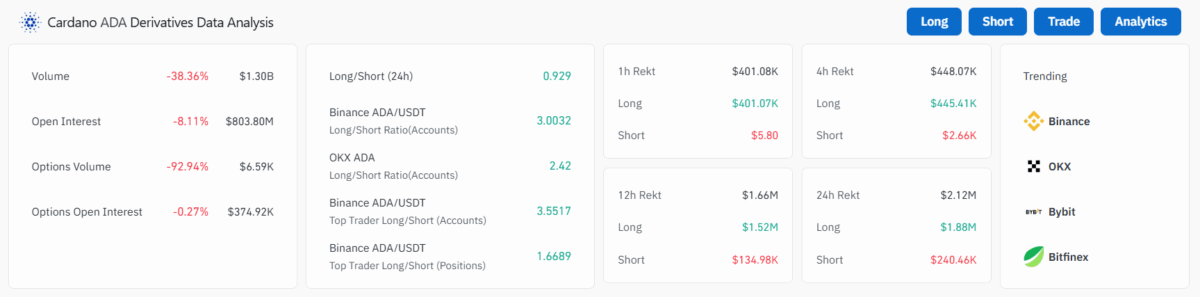
The chart shows declining activity as the volume dropped by 38.36% to $1.30 billion. Moreover, the open interest lost 8.11% or $803.8 million during this period with options volume plunging 92.94%. Despite the drop, long positions significantly outpaced shorts, suggesting Optimism despite the broader uncertainty.
In the last 24 hours, $2.12 million in positions were liquidated, most of which were longs. The overall sentiment is bullish among top traders, but declining volume and open interest suggest weakening market momentum in the shorter time frame.
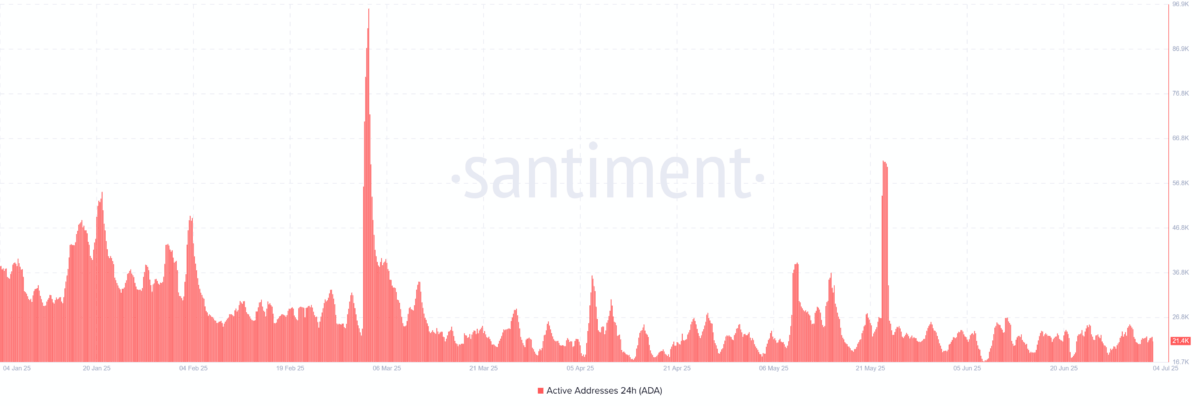
Adding to this, the Cardano activity peaked several times, with significant spikes in early March and May this year. However, recent activity has declined, with current active addresses dipping to around 21,500, indicating reduced user engagement and network activity.
How Could ADA’s Future Price Affect?
The ADA price is currently trading at $0.5776 and has lost 3.60% in the last 24 hours. Furthermore, it has formed a falling channel pattern in the daily time frame, suggesting an increasing negative influence. Moreover, with a market capitalization of $20.24 billion, it has managed to hold its 10th position.
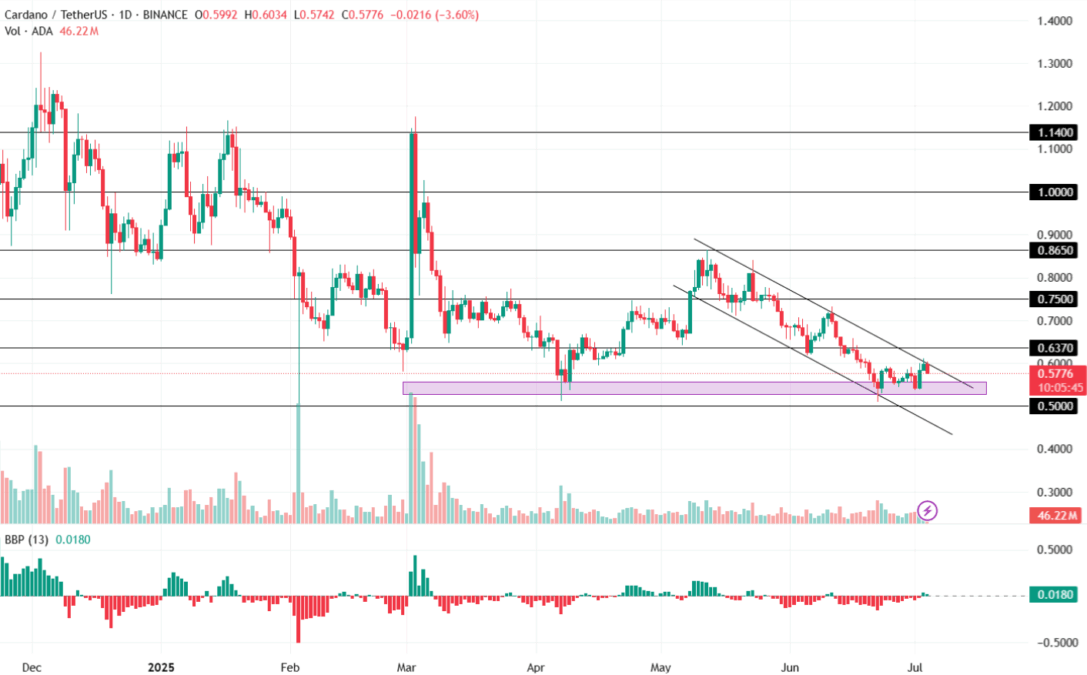
The BBP (Bull-Bear Power) indicator shows slight positive divergence and is at 0.0180 at the time of writing. This suggests weakening bearish momentum in the recent time.
A breakout above the resistance of the channel pattern may signal a bullish reversal, resulting in it heading toward its $0.63. Conversely, a bearish reversal could highlight the risk of it plunging toward its support zone of $0.53 or $0.50.
BREAKING: Proposal to Make Trump-Backed WLFI Tradable is Now Live

