Stellar (XLM) on the Brink: Breakout Pressure Fuels Explosive Price Squeeze

Stellar's XLM is coiled like a spring—technical indicators scream breakout as bulls pile pressure on resistance levels.
The Setup:
A textbook price squeeze has formed on XLM's daily chart, volatility contracting to levels last seen before its 2021 bull run. Traders are front-running the move, betting history repeats.
The Catalyst:
Network upgrades and CBDC partnership rumors (because every blockchain needs a central bank fling) are fueling speculative bids. Liquidity pools show whales accumulating at key support.
The Trade:
Watch the $0.35 zone—a clean break could trigger algorithmic buying cascades. Just don't be the bagholder when Wall Street 'discovers' crypto again and dumps their bags on retail.
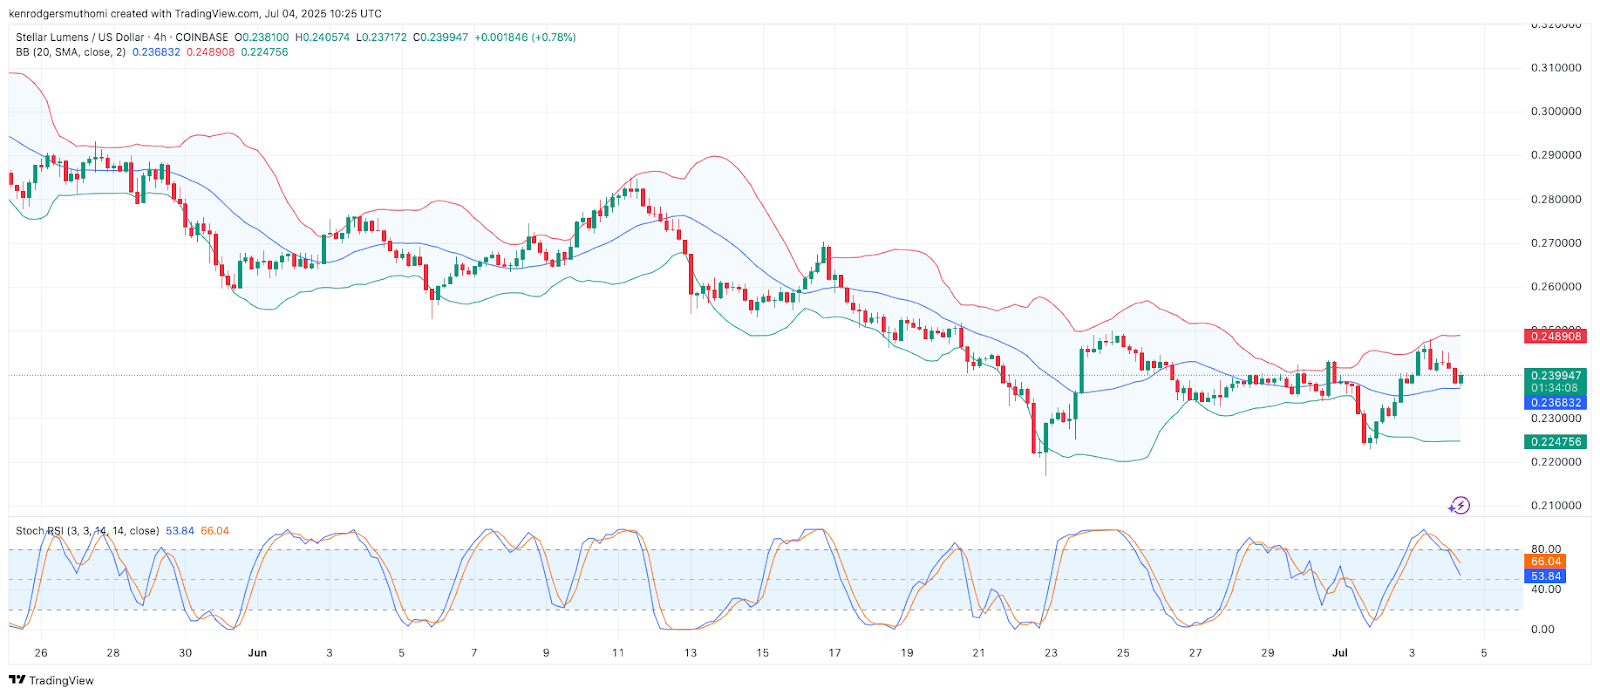 XLM 4H Chart – Source: TradingView
Triangle Tightens as Daily Chart Signals Big Move
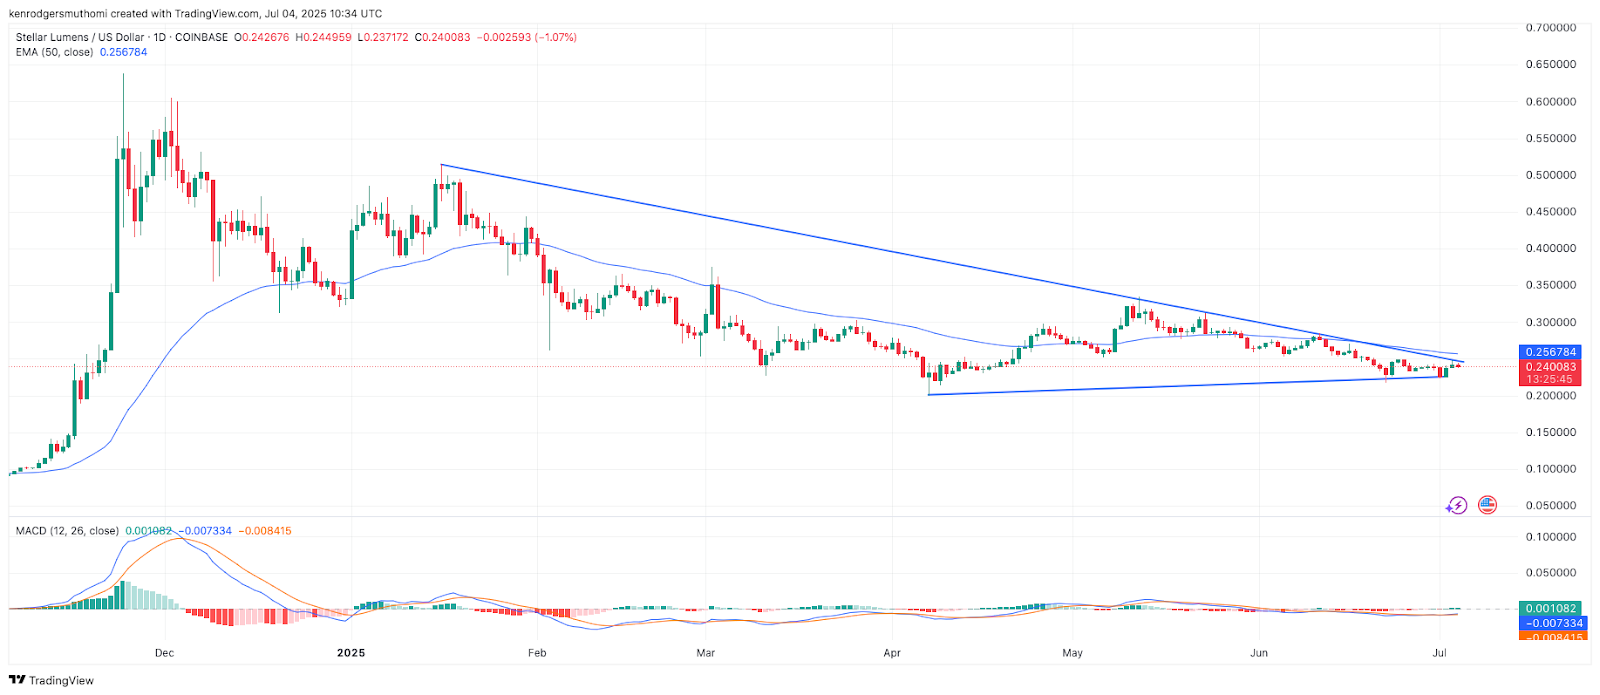
On the daily chart, XLM is moving within a symmetrical triangle and is approaching a breakout point. Its current price movement is trapped between a descending resistance line and a rising support line. Furthermore, stellar is still trading under its 50-day EMA, which hovers around $0.256 and functions as a formidable resistance level. However, the price bouncing off $0.22 recently shows strong buying interest at these low levels.
Notably, the MACD histogram flipped green, suggesting early bullish momentum. Still, a decisive MOVE above $0.256 is needed to confirm trend reversal.
Derivatives Show Cautious Optimism
According to Coinglass, the derivatives data for XLM is sending out mixed signals. There is a 15% drop in trading volume, bringing it down to $174 million and open interest also fell a bit by 0.26%. On the bright side, the long/short ratios on Binance and OKX are both above 1.5, which indicates that traders are still optimistic.

Moreover, Binance’s top traders show even stronger conviction with a 1.64 ratio. Consequently, sentiment leans bullish, though short-term traders show caution. Hence, the next breakout depends heavily on volume strength.
Also Read:

