Ethereum at a Critical Juncture: Will It Surge to $2600 or Plunge to $2200?

Ethereum's price teeters on a knife-edge as traders brace for a decisive move. The $2600 resistance level looms as a bullish target, while bears eye a potential drop to $2200 if support cracks.
Market sentiment remains divided—DeFi whales are accumulating, but institutional investors seem hesitant to commit until regulatory clouds clear (because nothing says 'stable investment' like Congress debating crypto rules).
Technical indicators show weakening momentum after ETH failed to hold above $2400 last week. The next 72 hours could determine whether we see a breakout or breakdown—with leveraged positions on both sides ready to get liquidated in spectacular fashion.
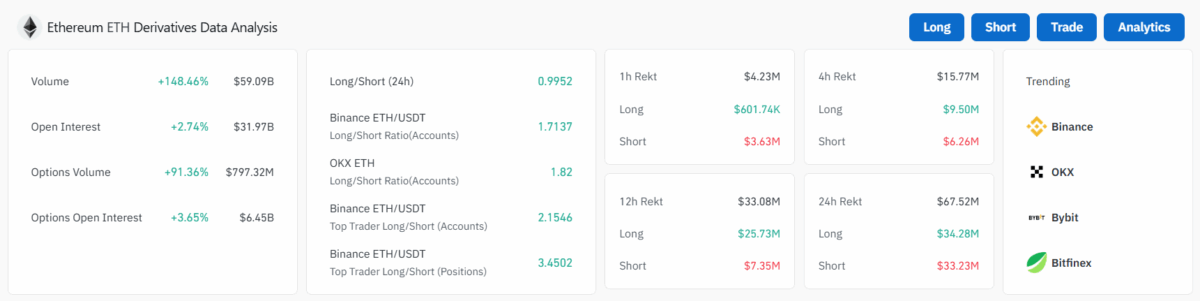
ETH Derivatives Data Suggests Mixed Action
The Ethereum derivatives analysis shows a 2.74% rise in its open interest to $31.97 billion today. Moreover, the options open interest has raised to $6.45 billion with a 91.36% surge in its options volume to $797.32 million. The Long/Short in the past 24 hours stands at 0.9952, hinting at increasing trading activity in the market.
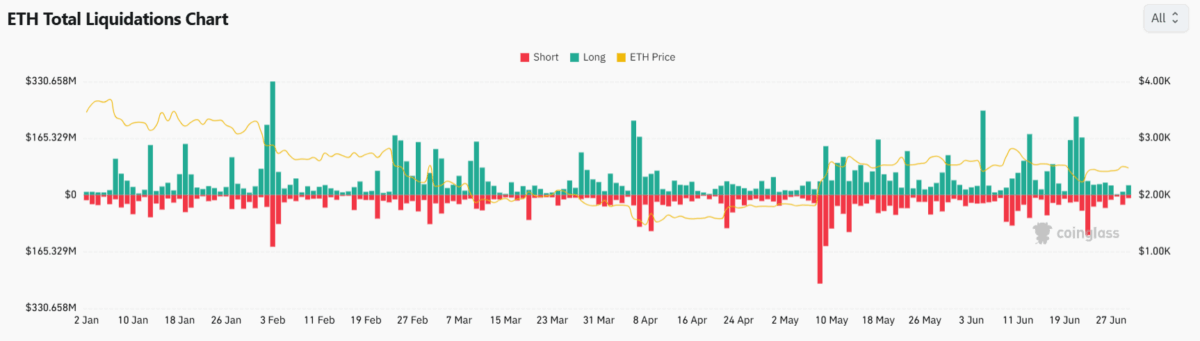
The ETH OI-weighted funding rate shows a fluctuating action from early April until late June. However, the trend has remained mainly positive, highlighting increased long positions in the market. ethereum price generally trended between $2,100 and $3,000. This further suggests aggressive longs, while occasional dips reflect macro and micro corrections or increased short interest.

The ETH liquidations chart shows a spike during price drops and the short liquidations showed a rise in bullish surges. Further, during February and June sell-offs and May short situations, volatility resulted in forced Leveraged position exits, making market sentiment more uncertain.
Despite the ongoing volatility, the Ethereum price continues trading within a consolidated range of $2,384 and $2,525, indicating a strong buying and selling points on the respective levels. With a listing price of $2,476.19 and a 24-hour trading volume of $17.38 billion, it has a market capitalization of $300.98 billion with a dominance of 9.0227%.
The Relative Strength Index (RSI) indicator continues trading above the neutral point (50) in the daily time frame and is currently at 56.86. Additionally, the average trendline is acting as a strong support in the chart, suggesting a mixed market sentiment for the Ether price.

Maintaining the value above the support trendline of $2,450, it could result in it retesting its test range of $2,525 soon. In addition, surging bullish sentiment could result in it heading toward its upper resistance level of $2,600 in the upcoming time.
Conversely, if the bears regain momentum over the market bulls, the ETH coin price may plunge toward its important support level of $2,384.75. If the bulls fail to regain momentum at that point, it could drop toward its lower support level of $2,300.
By evaluating the present market sentiments, under an extreme uncertainty, the price of Ethereum could plunge down to $2,200 during the upcoming month.
Is Bhutan Selling Bitcoin? $14M Binance Transfer Catches Eyeballs

