Ethereum Tanks: The 3 Brutal Truths Behind Today’s Price Plunge

Ethereum's bleeding out—and the crypto bros are scrambling for excuses. Here's what's really driving the dump.
1. Macro Mayhem: Traders flee risk as recession fears spike
2. Gas Fee Guillotine: Network congestion strangles DeFi activity
3. Whale Exodus: Institutional players cash out before the Merge 2.0 hype fades
Bonus truth? The 'fundamentals are strong' crowd just got reminded crypto still dances to Wall Street's tune—even decentralized golden boys can't bypass old-school panic selling. Time to HODL... or fold.
Ethereum Options Expiry Suggests Increasing Bearish Sentiment!
The chart below from Laevitas highlights the ETH volume by expiration. It shows green bars representing calls, and red bars representing puts. The highest activity is observed on 21 of June 2025 (tomorrow) as the total volume of a contract amounted to 56.35K contracts (32.84K calls and 23.51K puts).
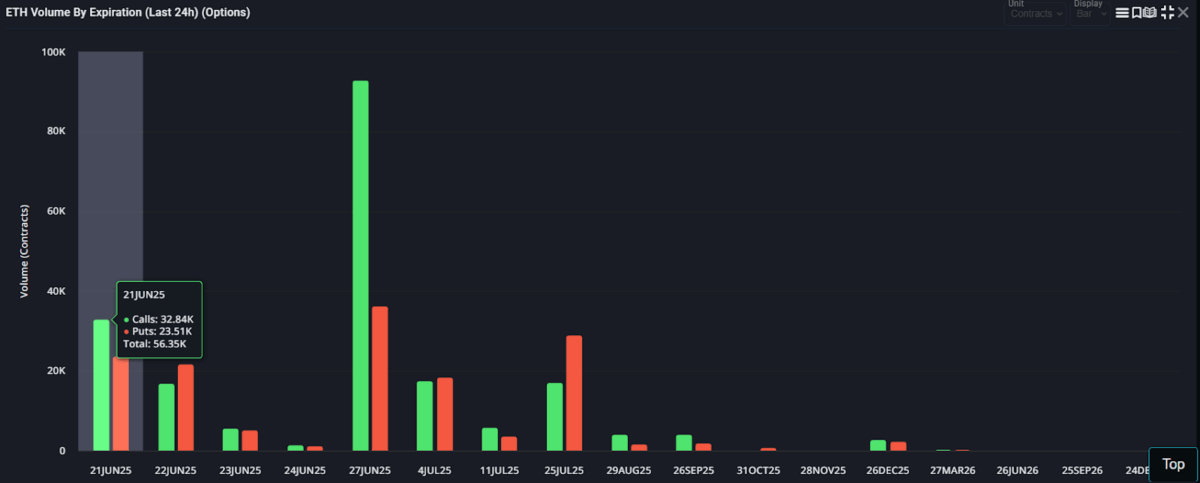
The focus of the chart is that there have been trades around near-month expiration, specifically during this month, suggesting future volatility or market manipulations that may affect the forecast of the price of Ethereum on a significant level.
ETH Crypto Records Increased Outflow:
As per the data of DefiLlama, the Ethereum chain has experienced a significant drop over the past few weeks. Notably, from a peak of 27.99 million ETH on 06th of May, the numbers have dropped to 25.22 million today. This highlights a drop of approximately 10% in a span of 45 days.
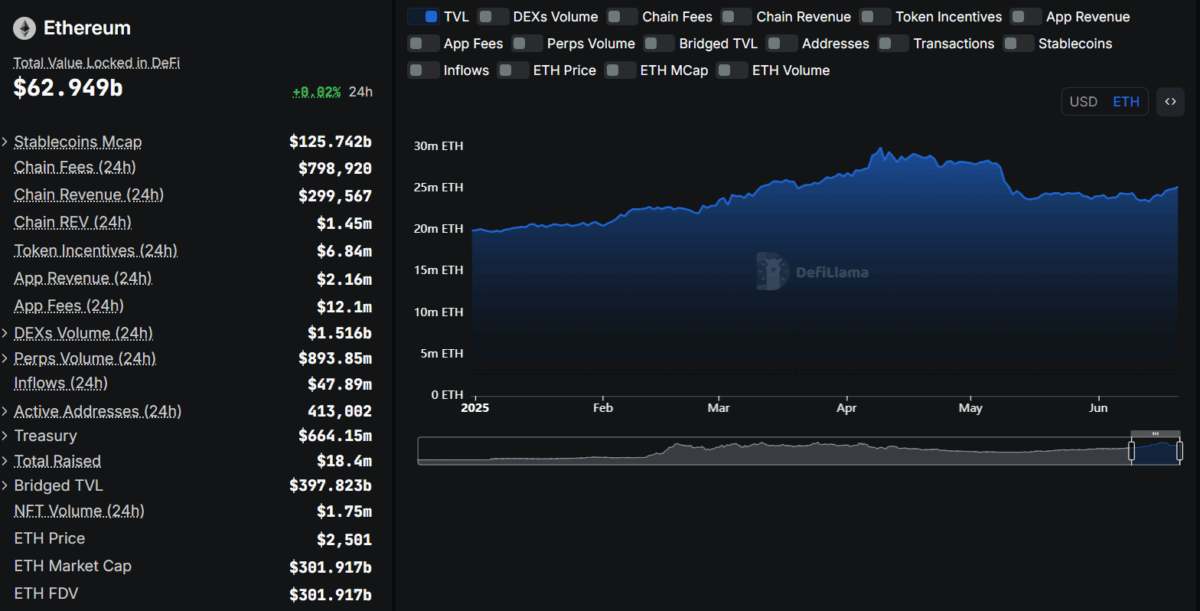
Further, the sentiment highlights that more investors are now exiting the Ethereum chain, hinting at rising disinterest in it.
Ethereum Bulls Struggle At Key Moving Averages
The Simple Moving Averages (SMAs) 10, 50, 100, 200 is a key technical indicator used to analyze market trends by comparing price data over a specific number of periods. In the below chart, the SMA 100 & 200-days are on the verge of a negative crossover.
Moreover, they have acted as a strong resistance for the ETH coin price today as the altcoin faced a rejection at that point. This highlights a strong liquidation zone around that level that is $2,565. Following this, the value has dropped below the $2,500 mark, suggesting a rising bearish angle.
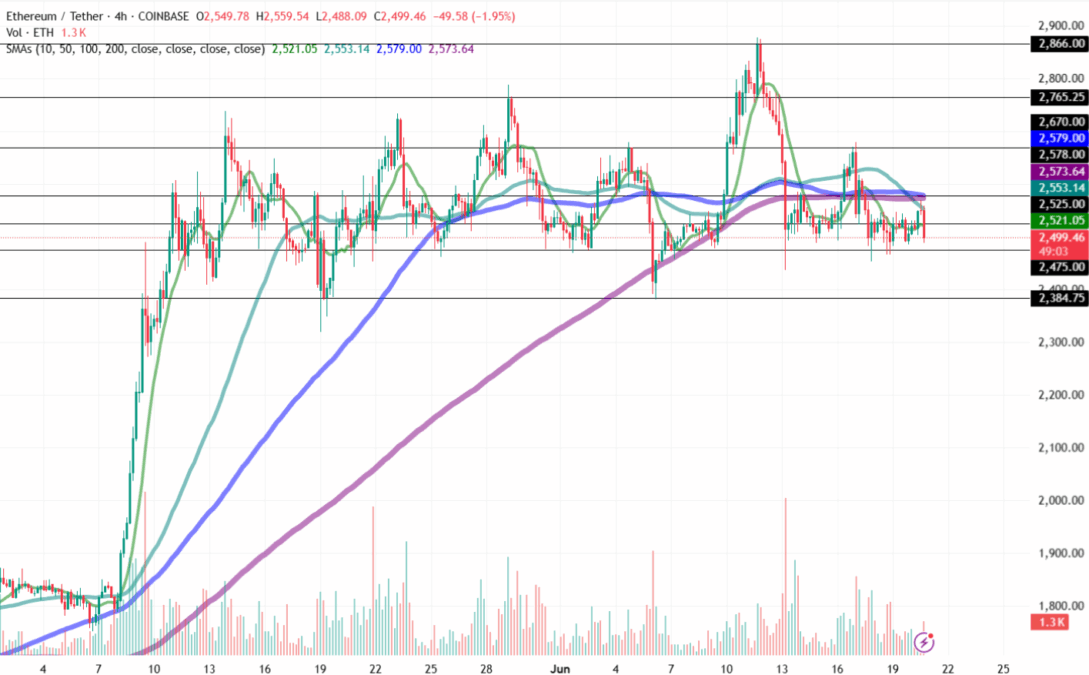
Additionally, the Volume shows a sharp increase in its latest candle, suggesting an increase in the selloff for Ethereum price in the shorter time frame. Volume is a key indicator used by traders to identify the bull and bear power in the market.
Considering the present market sentiments, the immediate test level of ETH coin stands at $2,475. Suppose, the bearish sentiment intensifies, this could lead the price to drop toward its crucial support of $2,384.75 within a short period.
However, a bullish reversal could lead the price toward its resistance of $2,525. A sustained bullish action may push the value of Ethereum price toward its upper resistance level of $2,578 shortly.
Also Read: Fed May Cut Rates in July, How will it Impact Bitcoin and Crypto?

