Sui Price Teeters on Edge as Bearish Momentum Grows—Time to Panic or Buy the Dip?

Sui's market trajectory hits a nerve as bearish signals flash red. Is this a temporary setback or the start of a deeper plunge?
Bearish winds batter Sui
The token's recent performance has traders clutching their charts—volatility spikes while support levels tremble. No fancy jargon here: sellers are gaining ground, and the bulls look tired.
Market psychology at play
Fear’s creeping in faster than a DeFi exploit. Retail investors flip from euphoria to despair, while whales might just be waiting to scoop up discounted bags. Classic crypto whiplash.
Finance jab of the day
Meanwhile, Wall Street ‘experts’ still can’t decide if crypto’s dead or the greatest invention since compound interest—maybe they’ll figure it out by 2030.
Bottom line: Sui’s next move hinges on whether traders still believe in the project—or just the hype. Place your bets.
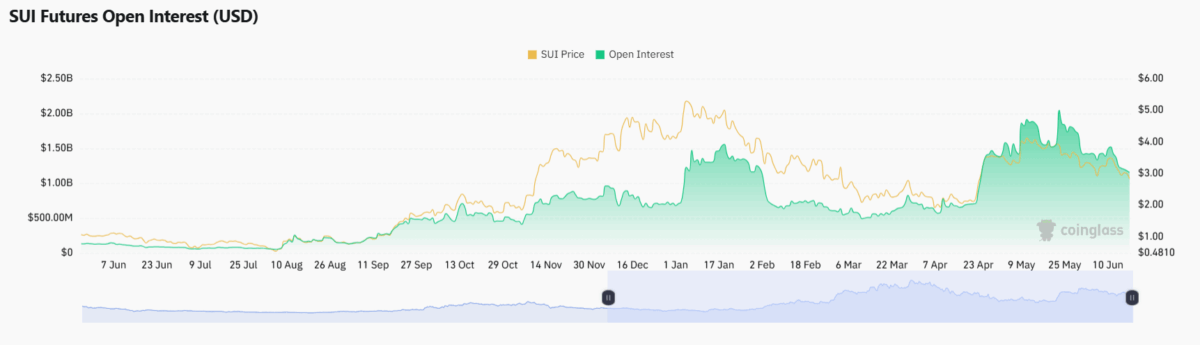 Sui Futures Open Interest (USD), Source: Coinglass
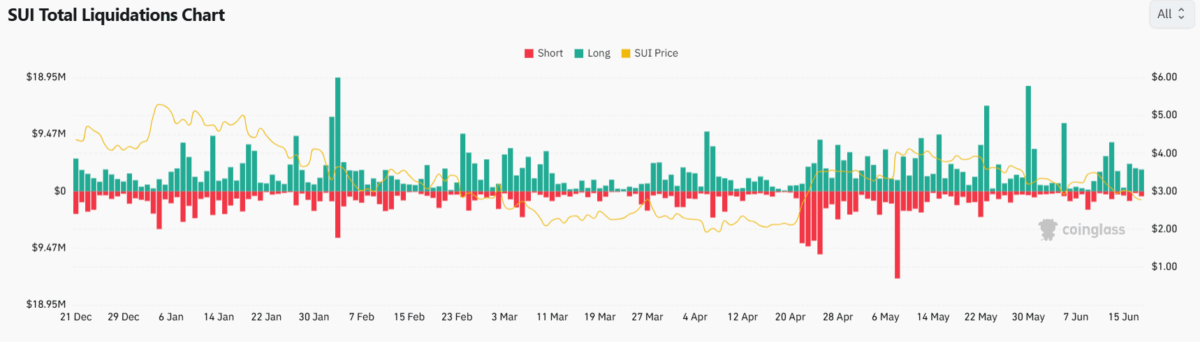
The SUI total liquidations chart shows a decline in the long positions, suggesting a weaker optimism for the altcoin in the market. Considering the market sentiments, let us now understand the SUI price prediction for this week.
SUI Price Forms Strong Bearish Trend
With an intraday price drop of 2.10% and a trading volume of $1.082 billion, the Sui crypto continues trading under a negative influence. Moreover, it has formed a descending channel pattern in the daily time frame, suggesting increasing selling pressure in the crypto market.
In the Volume chart, significant spikes are visible NEAR the price drops, indicating strong selling pressure for the altcoin in the market. This trend suggests a dominated bearish price action in the crypto-verse.
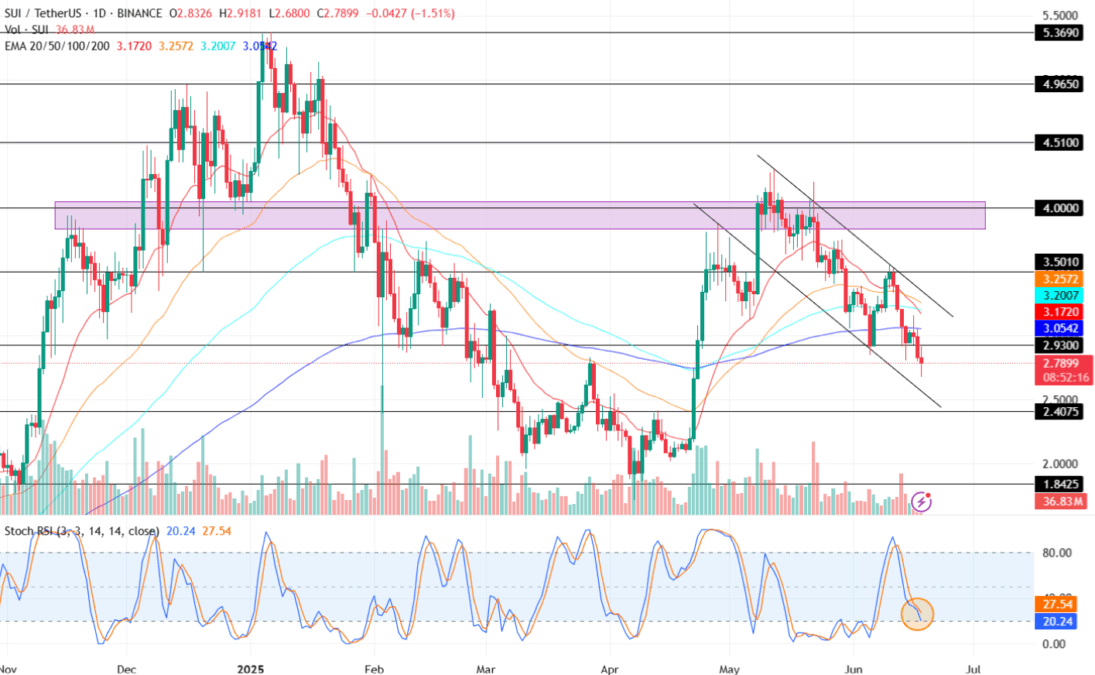
In the Exponential Moving Average (EMA) chart, the SUI token is trading below all EMAs, signaling strong bearish momentum. The crossover patterns and EMA slope help traders spot trend reversals or continuations.
The Stochastic RSI indicator is near 20 mark, suggesting that SUI may be oversold further suggesting a potential reversal shortly. Considering the sentiments, uncertain price action could be expected from the SUI token this week.
Will SUI Crypto Rise Back Up?
When a trend reversal occurs, the Sui coin price could retest its immediate resistance levels of $2.93 or $3.50 respectively. A sustained action could push its value toward its upper price target of $4 in the upcoming time.
Conversely, if the bearish sentiment intensifies, this could pull the SUI price toward its pivotal support trendline of $2.40 this month.
Also Read: Trump Says Fed ‘Won’t Cut Rates Today’, Bitcoin to Suffer?

