Solana Primed for $189 Retest as Wall Street Bets Big with New SOL ETF Filing

Solana''s gearing up for a high-stakes showdown with resistance as institutional money comes knocking.
The $189 price target—once a distant dream—now looks like a pit stop on SOL''s roadmap. With the SEC''s rubber stamp still warm on Bitcoin ETFs, Wall Street''s already lining up for the next crypto cash grab.
Market movers are placing their bets: SOL''s infrastructure plays well with TradFi''s plumbing, and the ETF filing proves even suits can spot a rocket when they see one. Just don''t expect them to understand the blockchain part.
Watch for volatility—nothing brings out the bulls and bureaucrats like a fresh financial product begging for regulatory scrutiny.
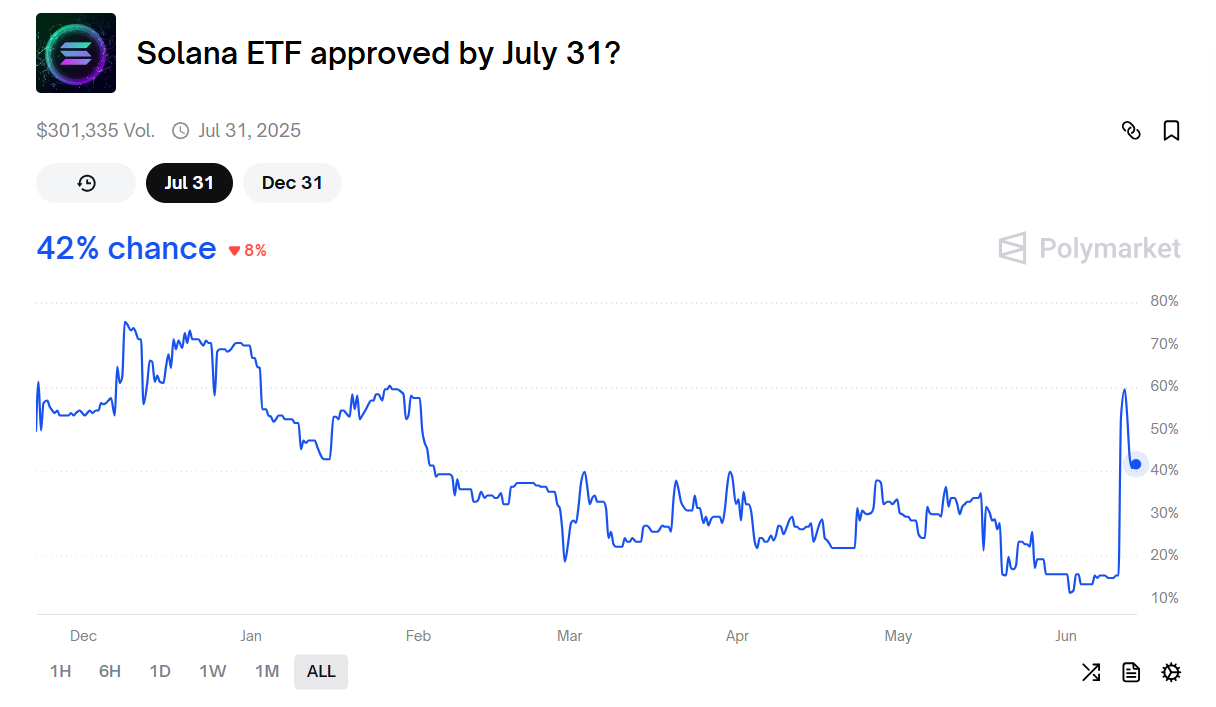 Solana ETF Approval July 2025, Source: Polymarket
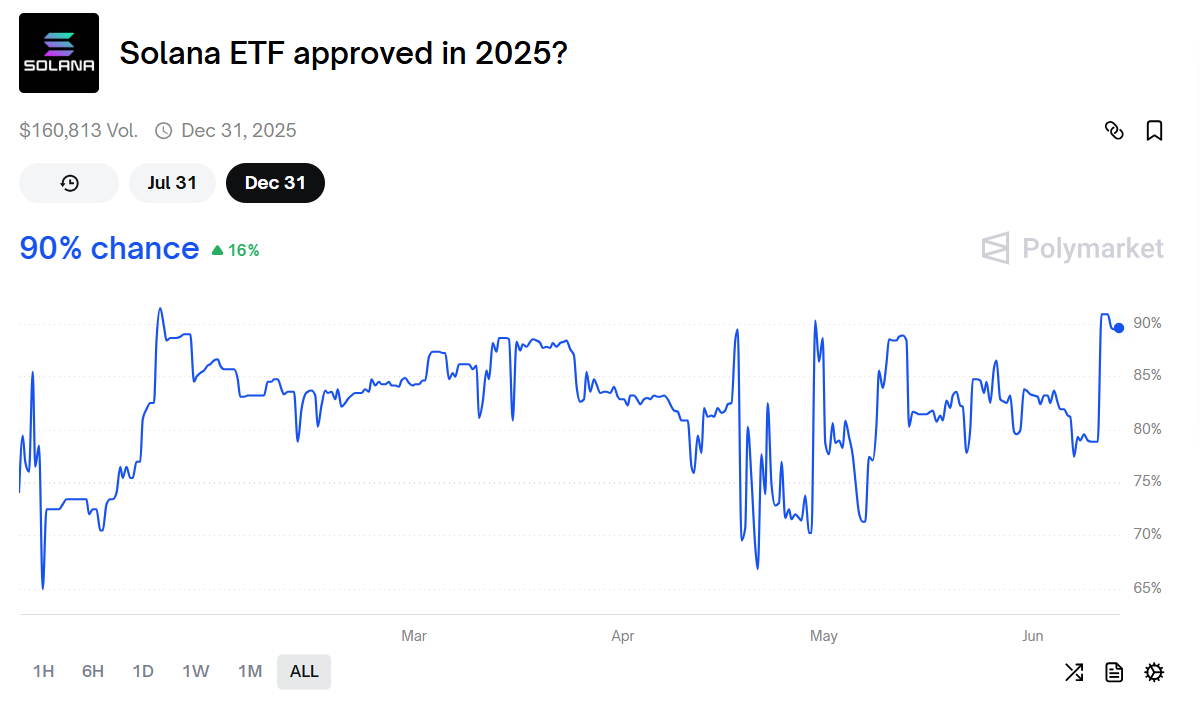
Nonetheless, the approval odds for 2025 stand at 90%, signalling a bullish outlook in the long-term. With the final deadline in the month of October, marketers showcase a strong optimism for the approval of the much-anticipated solana ETFs this year.
Considering the market sentiments and the probability of a potential approval of Solana ETF in 2025, let us now uncover the possible short-term Solana price prediction. Despite a new filing, the SOL coin price has experienced a significant drop of 7.23% with a 68.35% surge in its trading volume to $6.45 billion. This has further resulted in it dropping below the $150 mark again this month.
However, it has recorded higher lows, resulting in it forming a strong support in the price chart. With a trading value of $147.50 it has a market cap of $77.42 billion, making it the 06th most-valued crypto project.
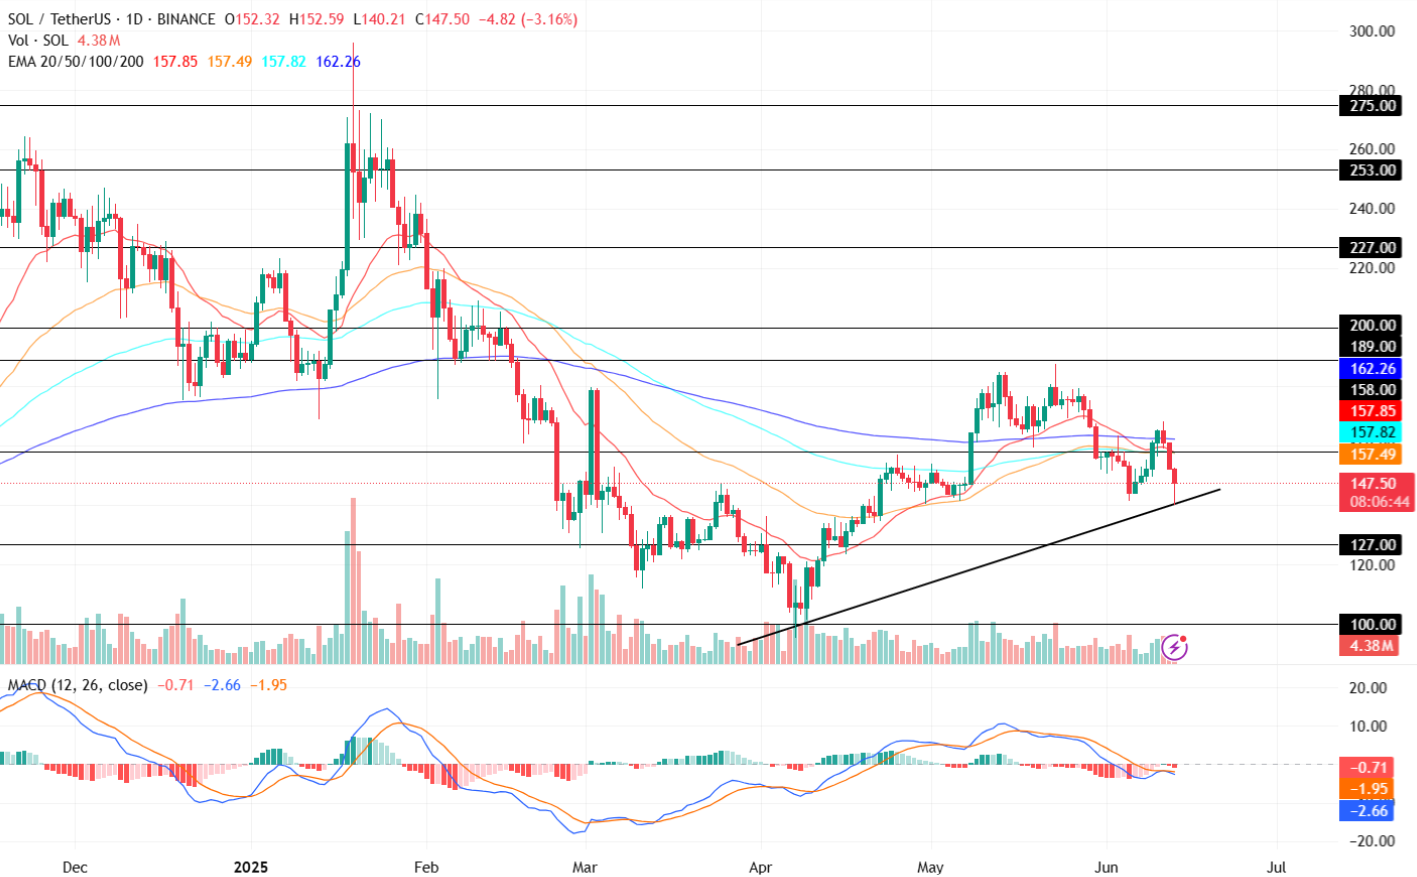
The Moving Average Convergence Divergence (MACD) indicator records a constant red histogram in the Solana price chart. Additionally, the 12 & 26-day EMA witnessed a bearish crossover in it. This type of trend generally suggests a strong negative buildup for the altcoin in the market.
The Exponential Moving Average 20, 50, 100, & 200 have all recorded a bearish convergence in the above price chart. This suggests increasing negative influence for the altcoin in the cryptocurrency market. While the 200-day EMA records a neutral action around the $162 mark, the 20, 50, & 100-day EMAs overlap between $157 and $158.
Will Solana Rise Back Up?
Suppose, a bullish trend reversal occurs amid the ETF hype, the SOL crypto price could retest its immediate resistance levels of $158 and $189. Maintaining its bullish stance could push the price of Solana token toward its February 15 high of $200.
Conversely, if the liquidation increases in the market, altcoin could retest its imaginary support trendline around the $140 mark. Furthermore, if the bears outrun the bulls, the Solana price could plunge toward its lower support of $127 this month.
BREAKING: Invesco and Galaxy Digital File for Solana ETF

