Solana’s June 2025 Showdown: Is a $127 Nosedive Inevitable?

Solana faces a critical test this month as analysts debate whether its recent volatility will culminate in a plunge to $127—or if the blockchain’s speed and scalability can defy the bears.
Market watchers are split: some see the $127 level as a technical inevitability after last quarter’s institutional sell-off, while others point to Solana’s resilient developer activity as reason for optimism. Either way, traders are bracing for impact—because when has crypto ever taken the boring route?
Here’s the kicker: even if SOL hits $127, it’ll still be up 900% from its 2023 lows. But try telling that to the leverage traders getting liquidated on both sides of the trade.
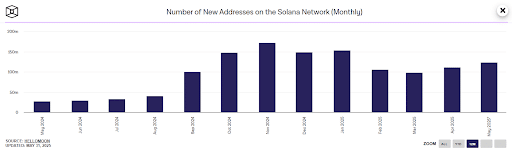
SOL On-chain Sentiment Suggests Increased Volatility
Solana records a constant rise in its new wallet addresses for the second straight month. The number of new wallets has increased from 98.33 million in March to 111.01 million in April, and 123.81 million in May. This highlights increasing user interest and adoption. Cumulatively, this is leading toward the growth of the network.
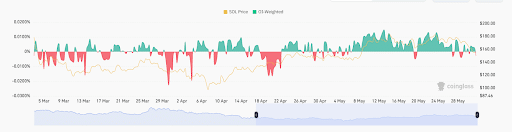
Due to the recent increase in the selling pressure amid the downturn, the OI-weighted funding rate has turned negative to -0.0027%. This highlights a significant decline in the bullish sentiment for Solana.
Solana Price Retests Its Crucial Support Around $150
Solana price is down by over 1% in 24 hours while the crypto market also experienced decreased volatility. With this, SOL has displayed a negative price action for the third consecutive day, according to Binance data. Moreover, the SOL coin has dropped approximately 11% in seven days and has displayed a monthly return of +4.93%.
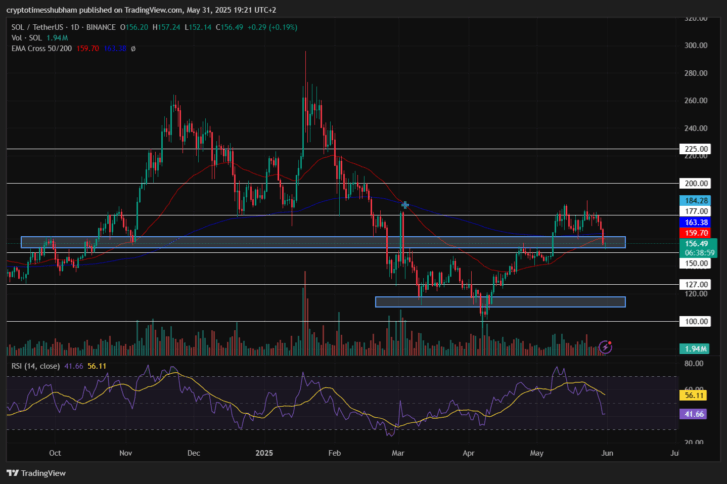
The Relative Strength Index (RSI) indicator has recorded a sharp drop toward the oversold range and is currently at 41.66, signaling a bearish sentiment. Additionally, the average line acts as a resistance and is dropping toward its neutral point. Reportedly, this suggests a negative price action.
If the Solana price holds its bullish stance, it could retest its high of $177 from May 28. Further, rising investor’s optimism could push the value toward $200 for the first time since February 2025.
However, a failed bullish action could pull the price down to its immediate support of $150. Notably, increasing liquidation may result in SOL price crashing toward its April low of $127.
BREAKING: Solana, ethereum Staking ETFs Hit Roadblock with New SEC Letter

Log in to Reply
Log in to comment your thoughtsComments
Related Articles
|Square
Get the BTCC app to start your crypto journey
Get started today Scan to join our 100M+ users