Solana’s Q1 2025 Paradox: Chain GDP Soars 20% as DeFi TVL Crashes 64%

Solana’s economy expands—just don’t look at its DeFi bloodbath.
The good news first: The chain’s GDP rockets up by a fifth, proving blockchain productivity isn’t dead yet.
Now the ugly part: DeFi TVL gets chopped by nearly two-thirds, turning ’yield farming’ into yield famine. TradFi bankers smirk.
Active wallets? Up. Developer activity? Hot. But liquidity’s fleeing faster than a VC dumping meme coins. Classic crypto whiplash—builders thrive while speculators bail. Will the real Solana please stand up?
Why Chain GDP Matters
Chain GDP is a way of measuring all the income generated by apps on the Solana blockchain. This includes fees from trading, transactions, and other charges inside decentralized apps, or dApps. When Chain GDP goes up, it means there’s more happening on the network and more value being made.
In Q1, Chain GDP rose from $971 million to $1.2 billion, an increase of 20% compared to the last quarter (Q4) of 2024. January was a real highlight, with apps pulling in nearly $700 million all by themselves. A lot of this was driven by new tokens like TRUMP and MELANIA, which sparked a wave of speculative trading and drew in plenty of users.
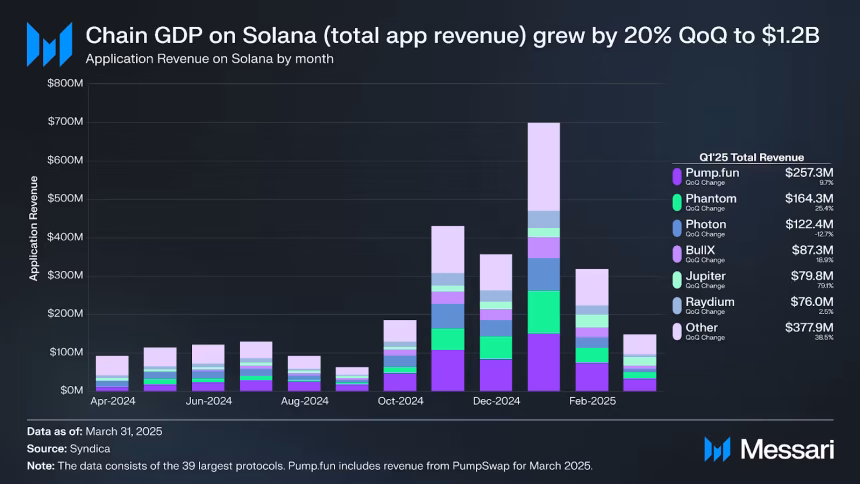
Looking at the apps behind these numbers, Pump.fun led the pack with $257 million in revenue, a 10% rise from the previous quarter. Phantom, a widely used wallet and gateway to dApps, also saw its revenue climb by 25%, hitting $164 million.
Others included Photon, which slipped 13% to $122 million, BullX, up 19% to $87 million, and Jupiter, which jumped an impressive 79% to $80 million.
So even as some parts of Solana’s network slowed down, speculative trading kept revenue growing.
Getting a Handle on App Revenue Capture Ratio
Application Revenue Capture Ratio (App RCR) is a helpful metric that compares how much revenue apps are making against the Real Economic Value (REV) on the network—basically, the fees paid to validators who handle transactions.
In Q1, Solana’s App Revenue Capture Ratio jumped from 117.6% to 142.8%. When this number crosses 100%, it shows that apps are earning way more than just the standard transaction fees. So the increase of $142.8% represents $142.8 in revenue against every $100 spent.
This extra cash FLOW is coming from swap fees, NFT sales, and other services inside the apps. In other words, Solana’s apps are getting better at turning user activity into real earnings.
DeFi TVL: A Dramatic Drop
While app revenues climbed, the total value locked (TVL) in Solana’s DeFi projects fell dramatically. TVL shows how much money users have deposited in these protocols and is a key sign of trust and usage.
From $18.3 billion, DeFi TVL plunged to $6.6 billion—a steep 64% drop in dollar terms. But when you look at TVL in Solana’s native token (SOL), it actually grew by 18%. That’s because the price of SOL itself went up during this time.
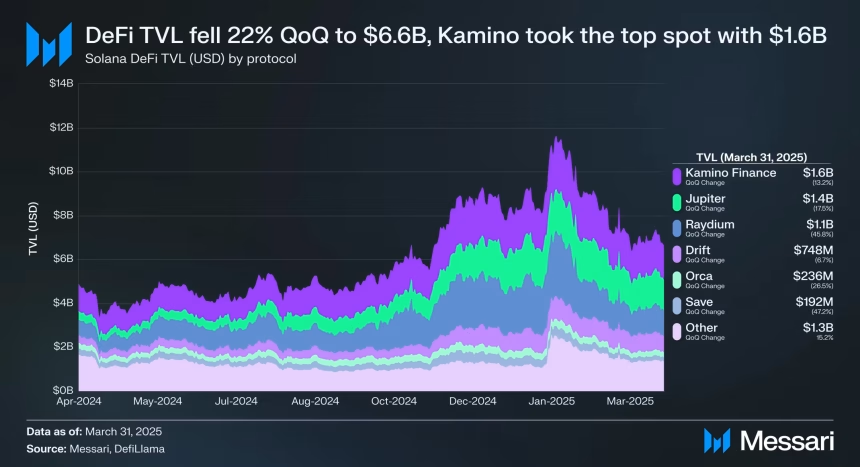
Kamino held its spot as the largest DeFi project with $1.6 billion locked in, despite seeing a 13% dip in value. The team recently launched Kamino Swap, a fresh feature boasting zero slippage and no fees—something that could seriously disrupt the market if it catches on.
Right behind Kamino was Jupiter, with $1.4 billion in TVL, down 18%, and Raydium fell to third place with $1.1 billion after a steep 46% decline.
The big drop in TVL measured in dollars shows that a lot of investors are pulling their funds out, probably because of overall market uncertainty or specific problems within Solana’s DeFi projects.
Looking beyond just revenue and TVL, other numbers give us a better idea of what’s happening on Solana. Such as daily trading volume on decentralized exchanges. Which has jumped 41%, reaching $4.6 billion. This boost is largely attributed to memecoin trading, which picked up steam following the launch of new tokens.

At the same time, the total value of stablecoins on Solana soared by 145%, hitting $12.5 billion. This indicates strong demand for more stable assets on the network. Both USDC and USDT gained over 140%, showing strong demand for stable assets. The liquid staking in Solana apps has also inched up from 9.1% to 10.4%, reflecting some growth in assets being staked.
However, the number of unique users paying fees on the network dropped by 22%, hinting that fewer people are actively transacting, even though trading volumes are up.
What’s Next for Solana?
Solana’s first quarter results tell a story of two sides. On one hand, the network’s apps are making more money, thanks largely to speculative trading and new tokens. On the other hand, the sharp fall in DeFi TVL shows challenges in keeping user funds and confidence.
With the market trending upward and prices pumping, Solana could benefit in the next quarter—there’s a good chance DeFi TVL might rise in Q2 compared to Q1.
Also Read: Solana price Eyes $200 as Network Activity Hits 3-Month High

Log in to Reply
Log in to comment your thoughtsComments
Related Articles
|Square
Get the BTCC app to start your crypto journey
Get started today Scan to join our 100M+ users