BNB vs. SOL: The Billion-Dollar Cage Match for Crypto’s #5 Spot

Two blockchain heavyweights are trading blows for market dominance—and neither shows signs of backing down. Binance’s BNB chain cuts through with sheer exchange backing, while Solana’s SOL counters with institutional darling status. Both tokens flirt with all-time highs, but only one gets the bragging rights.
Behind the hype: BNB’s centralized roots give it stability (read: less volatility), while SOL’s speed attracts developers—until the next network outage, anyway. Meanwhile, Ethereum quietly sips champagne in the #2 spot, watching the peasants fight for scraps.
Who takes the crown? Check the charts—this battle changes by the hour. Just don’t tell the ’long-term investors’ they’re betting on a glorified horse race.
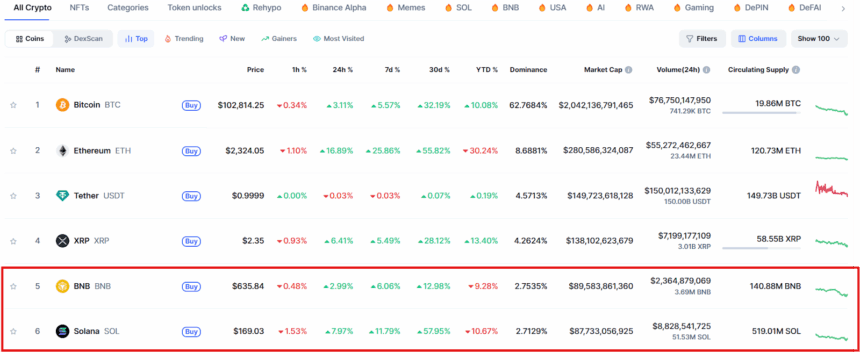 Source: CoinMarketCap
Following this, the war for the 5th position is on between Binance and solana for the 5th position. While marketers speculate BNB ETF to be a major catalyst in the price surge, the other half considers the Solana futures in Brazil to play a vital role in outperforming BNB crypto coin.
Are you one of many who are closely monitoring the price action of these top altcoins? In this writeup, we will understand the market sentiments and possible weekly price predictions.
Solana Price Breaks Out of Critical Resistance Zone of $160
The Solana price today has jumped over 7% with a trading volume of $8.78 billion, a change of +51.31%. Moreover, this altcoin has surged approximately 12% over the past week, resulting in it achieving a market capitalization of $87.73 billion today. With this, it has breached its resistance zone of $160 for the first time since March 2025.
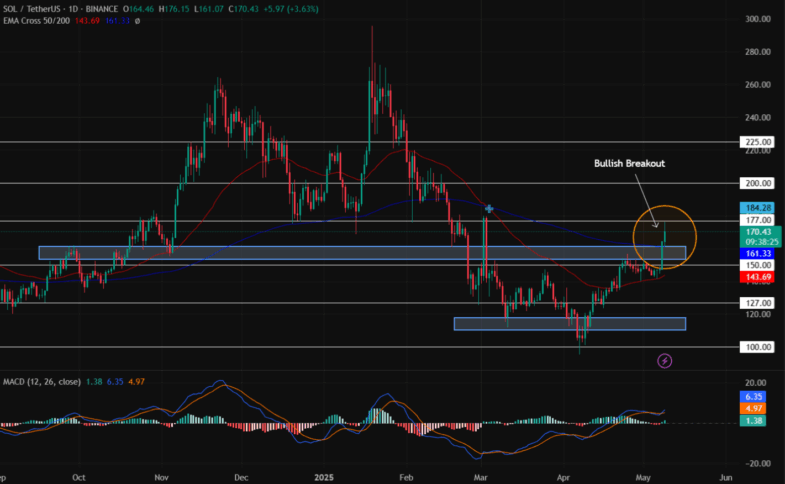
The cross EMA 50-day constantly supports the solana price chart with its 200-day EMA recording a similar action in the daily time frame. On the other hand, the MACD indicator displays a rising trend, suggesting an increase in the buying-over-selling pressure for the altcoin in the crypto space.
Suppose, the crypto market favors the bulls, this could result in the Solana coin price breaching its resistance of $177 and head toward its upper high of $200. Conversely, a bearish reversal may pull the price toward its support trendline of $150.
Binance Coin Retests Its $643 Mark
Amid the ongoing market volatility, the BNB coin price has added over 6% to its portfolio this week. With a circulating supply of 140.88 million tokens and a trading value of $638.02, it has a market cap of $89.58 billion. This makes it the 4th most-valued crypto in the market.
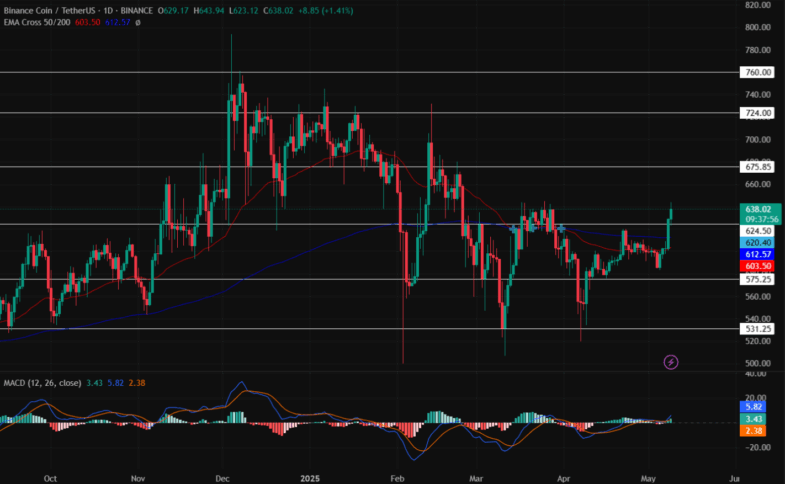
The Moving Average Convergence Divergence (MACD) records a constant green histogram in the daily time frame with its averages experiencing a bullish convergence. Moreover, the Cross EMA 50/200-day witnesses a positive crossover. This indicates a positive outlook for the altcoin in the upcoming time.
If the bullish sentiment sustains, the BNB coin price could head toward its immediate resistance level of $675.85. On the flip side, if the market experiences increased liquidation, this could result in this altcoin plunging toward its lower support level of $575.25 next week.
Also Read: Solana and HBAR price Pumps 10% as Bitcoin Crosses $100K
