Solana Plunges 7% - But This Critical Support Level Could Ignite a Massive Rally

Solana takes a 7% hit as markets wobble - but technicals suggest this might be the dip traders have been waiting for.
The Key Level Everyone's Watching
That crucial support zone everyone's been charting? It's holding - barely. When assets test these make-or-break levels, you get fireworks one way or another. Solana's flirting with that exact scenario right now.
Market Mechanics at Play
Traditional finance guys would be sweating over a 7% move. Crypto natives? They see opportunity. The support level acts like a trampoline - the harder the price hits it, the bigger the potential bounce. Market structure suggests we're approaching that inflection point where fear turns to greed.
Broader Context Matters
While shorts celebrate the drop, the real story unfolds at that support line. Break below and we're looking at another leg down. Hold and rally? That's when the real money gets made. Funny how the same Wall Street analysts who dismiss crypto suddenly become technical experts when prices move.
The setup's clear: Solana tests a critical juncture while traditional finance remains blissfully unaware of the potential energy building beneath the surface.
Rejection at Resistance Sends SOL Lower
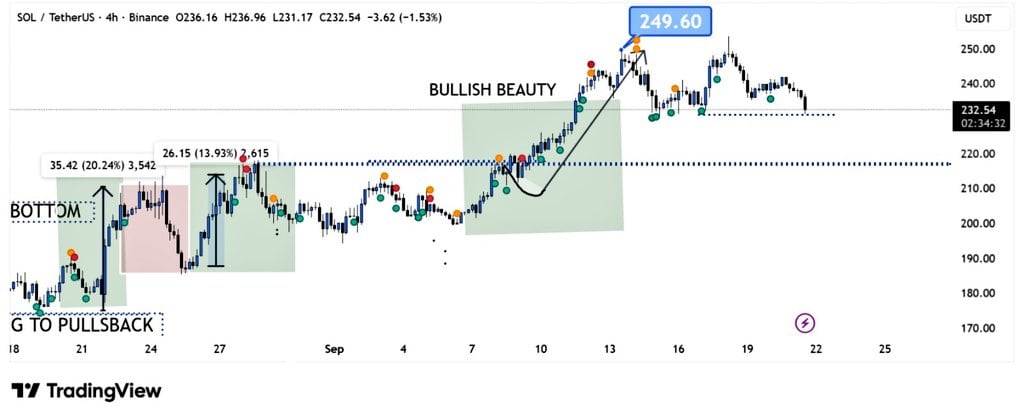
Solana (SOL) is trading around $223, after falling more than 7% in the last 24 hours. Over the past week, it has declined by nearly 5%. The MOVE down comes after the price tested the $250 resistance level, which is the same zone that capped it before the previous all-time high.
Meanwhile, the weekly chart shows that this level continues to act as strong resistance. Despite the rejection, the longer-term trend remains upward. Analyst Lennaert Snyder commented:
$SOL in a nutshell.
It perfectly tested key $253 resistance, the last stop before a new ATH.
The market dumped, but @solana maintains its strong uptrend.
As long as we’re trading above $186 weekly support, the uptrend remains intact.
Deeper retests are perfect for longs. pic.twitter.com/Xdg8VTt6rk
— Lennaert Snyder (@LennaertSnyder) September 22, 2025
This area had served as resistance before and now holds as the key support in the current market structure. On the 4-hour chart, this zone has acted as a base during earlier consolidation phases. If this level holds, it could open the way for a short move toward $240–$245.
Market watcher BitGuru noted:
“If this level holds, we may see another bounce toward $240–$245, but a breakdown could send it lower toward $220.”
Price action remains uncertain at this level. If it breaks, the next key support sits NEAR $220, an area where buyers previously stepped in during sideways movement.
SOL/BTC Shows Breakout, Retest Still Possible
The SOL/BTC chart on the weekly timeframe shows a completed rounded bottom pattern, formed between March and August this year. The breakout above the 0.00185–0.002 BTC range led to a 60% rally, with the price now above 0.0032 BTC.
According to analyst Cas Abbé, a retest may be due after the sharp move up. “SOL/BTC could retest its major support zone,” he said, adding that a return to the breakout level WOULD not be unusual after such a move. The support zone has acted as a pivot area before and may be monitored closely in the days ahead.
$SOL/$BTC could retest its major support zone.
SOL/BTC pumped nearly 60% from its bottom, so a correction is expected.
Once that happens, the next rally will start. pic.twitter.com/1ZyWHVsaYF
— Cas Abbé (@cas_abbe) September 22, 2025
In addition, as reported by CryptoPotato, Pantera Capital said that solana is reaching a major point in its adoption path. The firm pointed to rising attention from fintech firms, developers, and retail users. They also mentioned that institutional exposure to SOL remains low relative to other large-cap assets.
Pantera suggested that if a Solana-based ETF is approved, it could lead to stronger institutional inflows. While the timeline is uncertain, the firm described Solana as being well-positioned in its ecosystem and infrastructure.
