Bitcoin’s Next Big Rally: Is the Stage Set for Explosive Growth?

Bitcoin teases another massive breakout as technical indicators align for potential surge.
Market momentum builds
Whale accumulation patterns mirror previous bull run precursors while institutional interest hits new highs. Trading volumes spike across major exchanges—retail FOMO hasn't even kicked in yet.
Technical breakout imminent
Key resistance levels show weakening sell pressure as BTC consolidates above critical support. The charts whisper what traders already feel in their bones—something big's brewing.
Macro tides turning
Traditional finance keeps fumbling with archaic models while Bitcoin's network fundamentals scream undervalued. Wall Street analysts still can't decide if it's digital gold or magic internet money—meanwhile, the smart money's already positioned.
Whether this becomes the mother of all rallies or just another fakeout, one thing's clear: the dinosaurs managing your 401k won't see it coming.
The Daily Chart
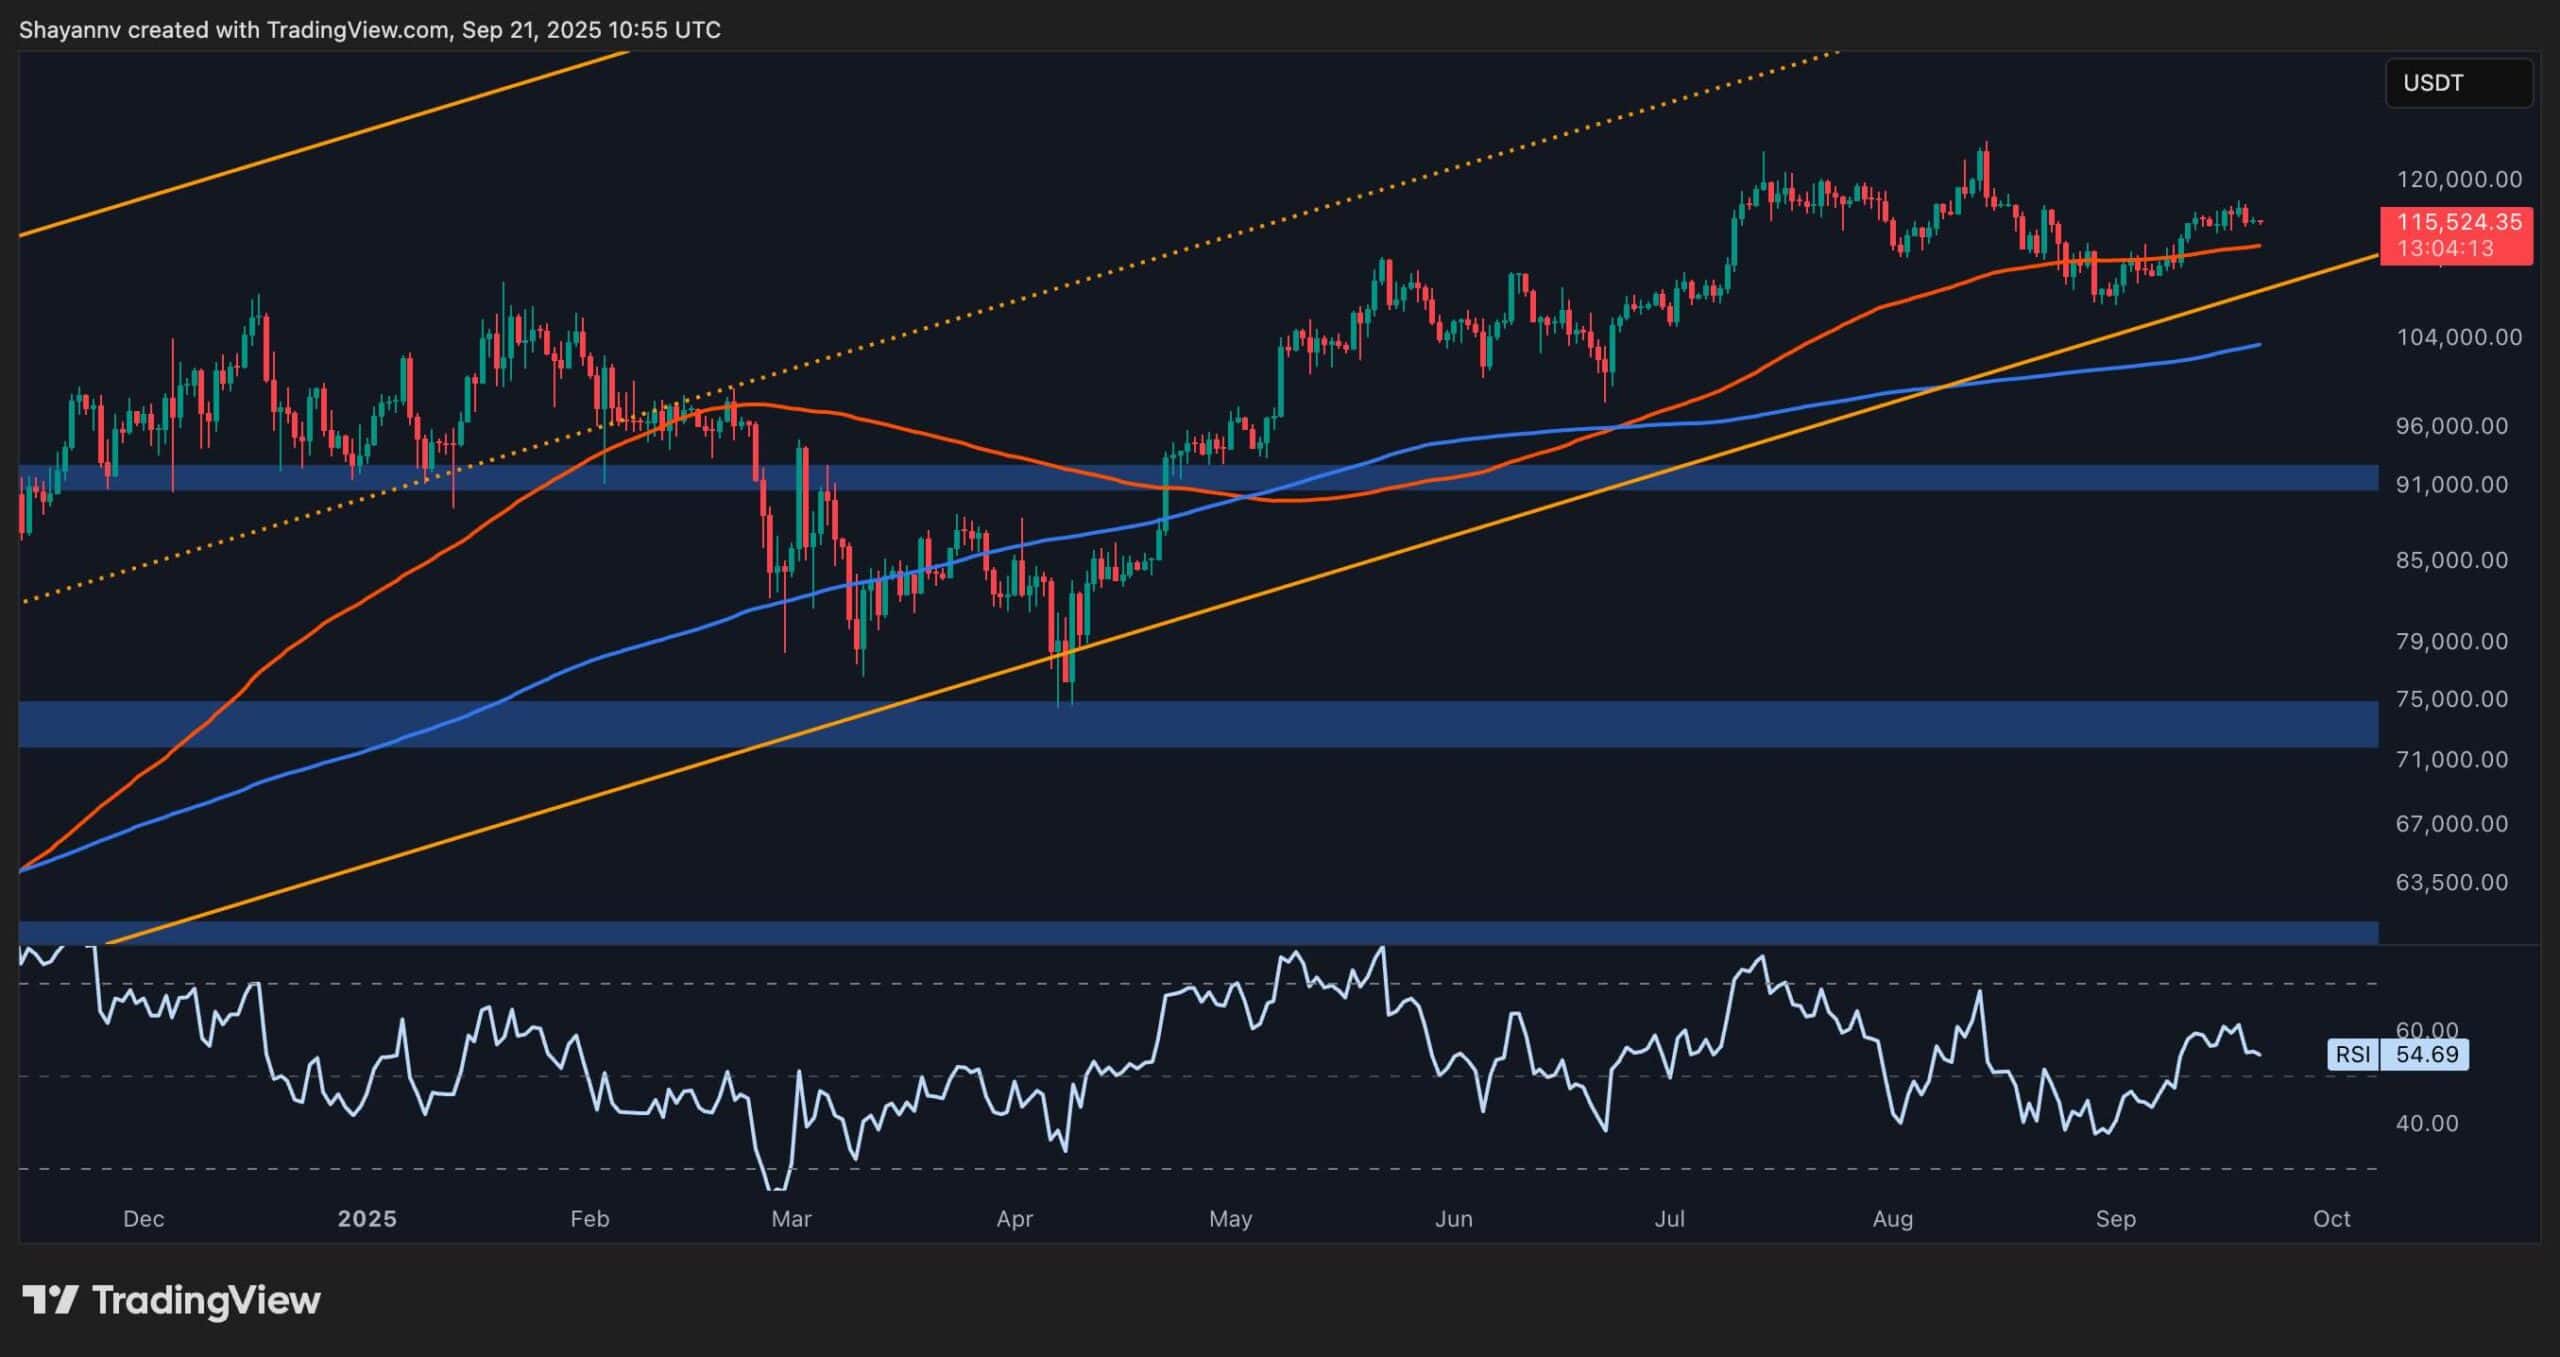
On the daily chart, Bitcoin is still holding within a broad ascending channel that has remained intact for months. The recent correction from the $124K all-time high hasn’t broken the market structure yet, and the 100-day moving average remains below the price, offering additional support around $110K.
However, the rally has clearly lost momentum over the past few weeks, with the RSI turning sideways and the price failing to make new highs. Despite that, bulls still have the upper hand as long as the asset remains above the rising orange trendline.
A clean break above $124K would likely ignite fresh buying and push the cryptocurrency into price discovery mode, but if the support zone around $110K gives in, we may see a sharp drop toward the $100K–$104K region.
The 4-Hour Chart
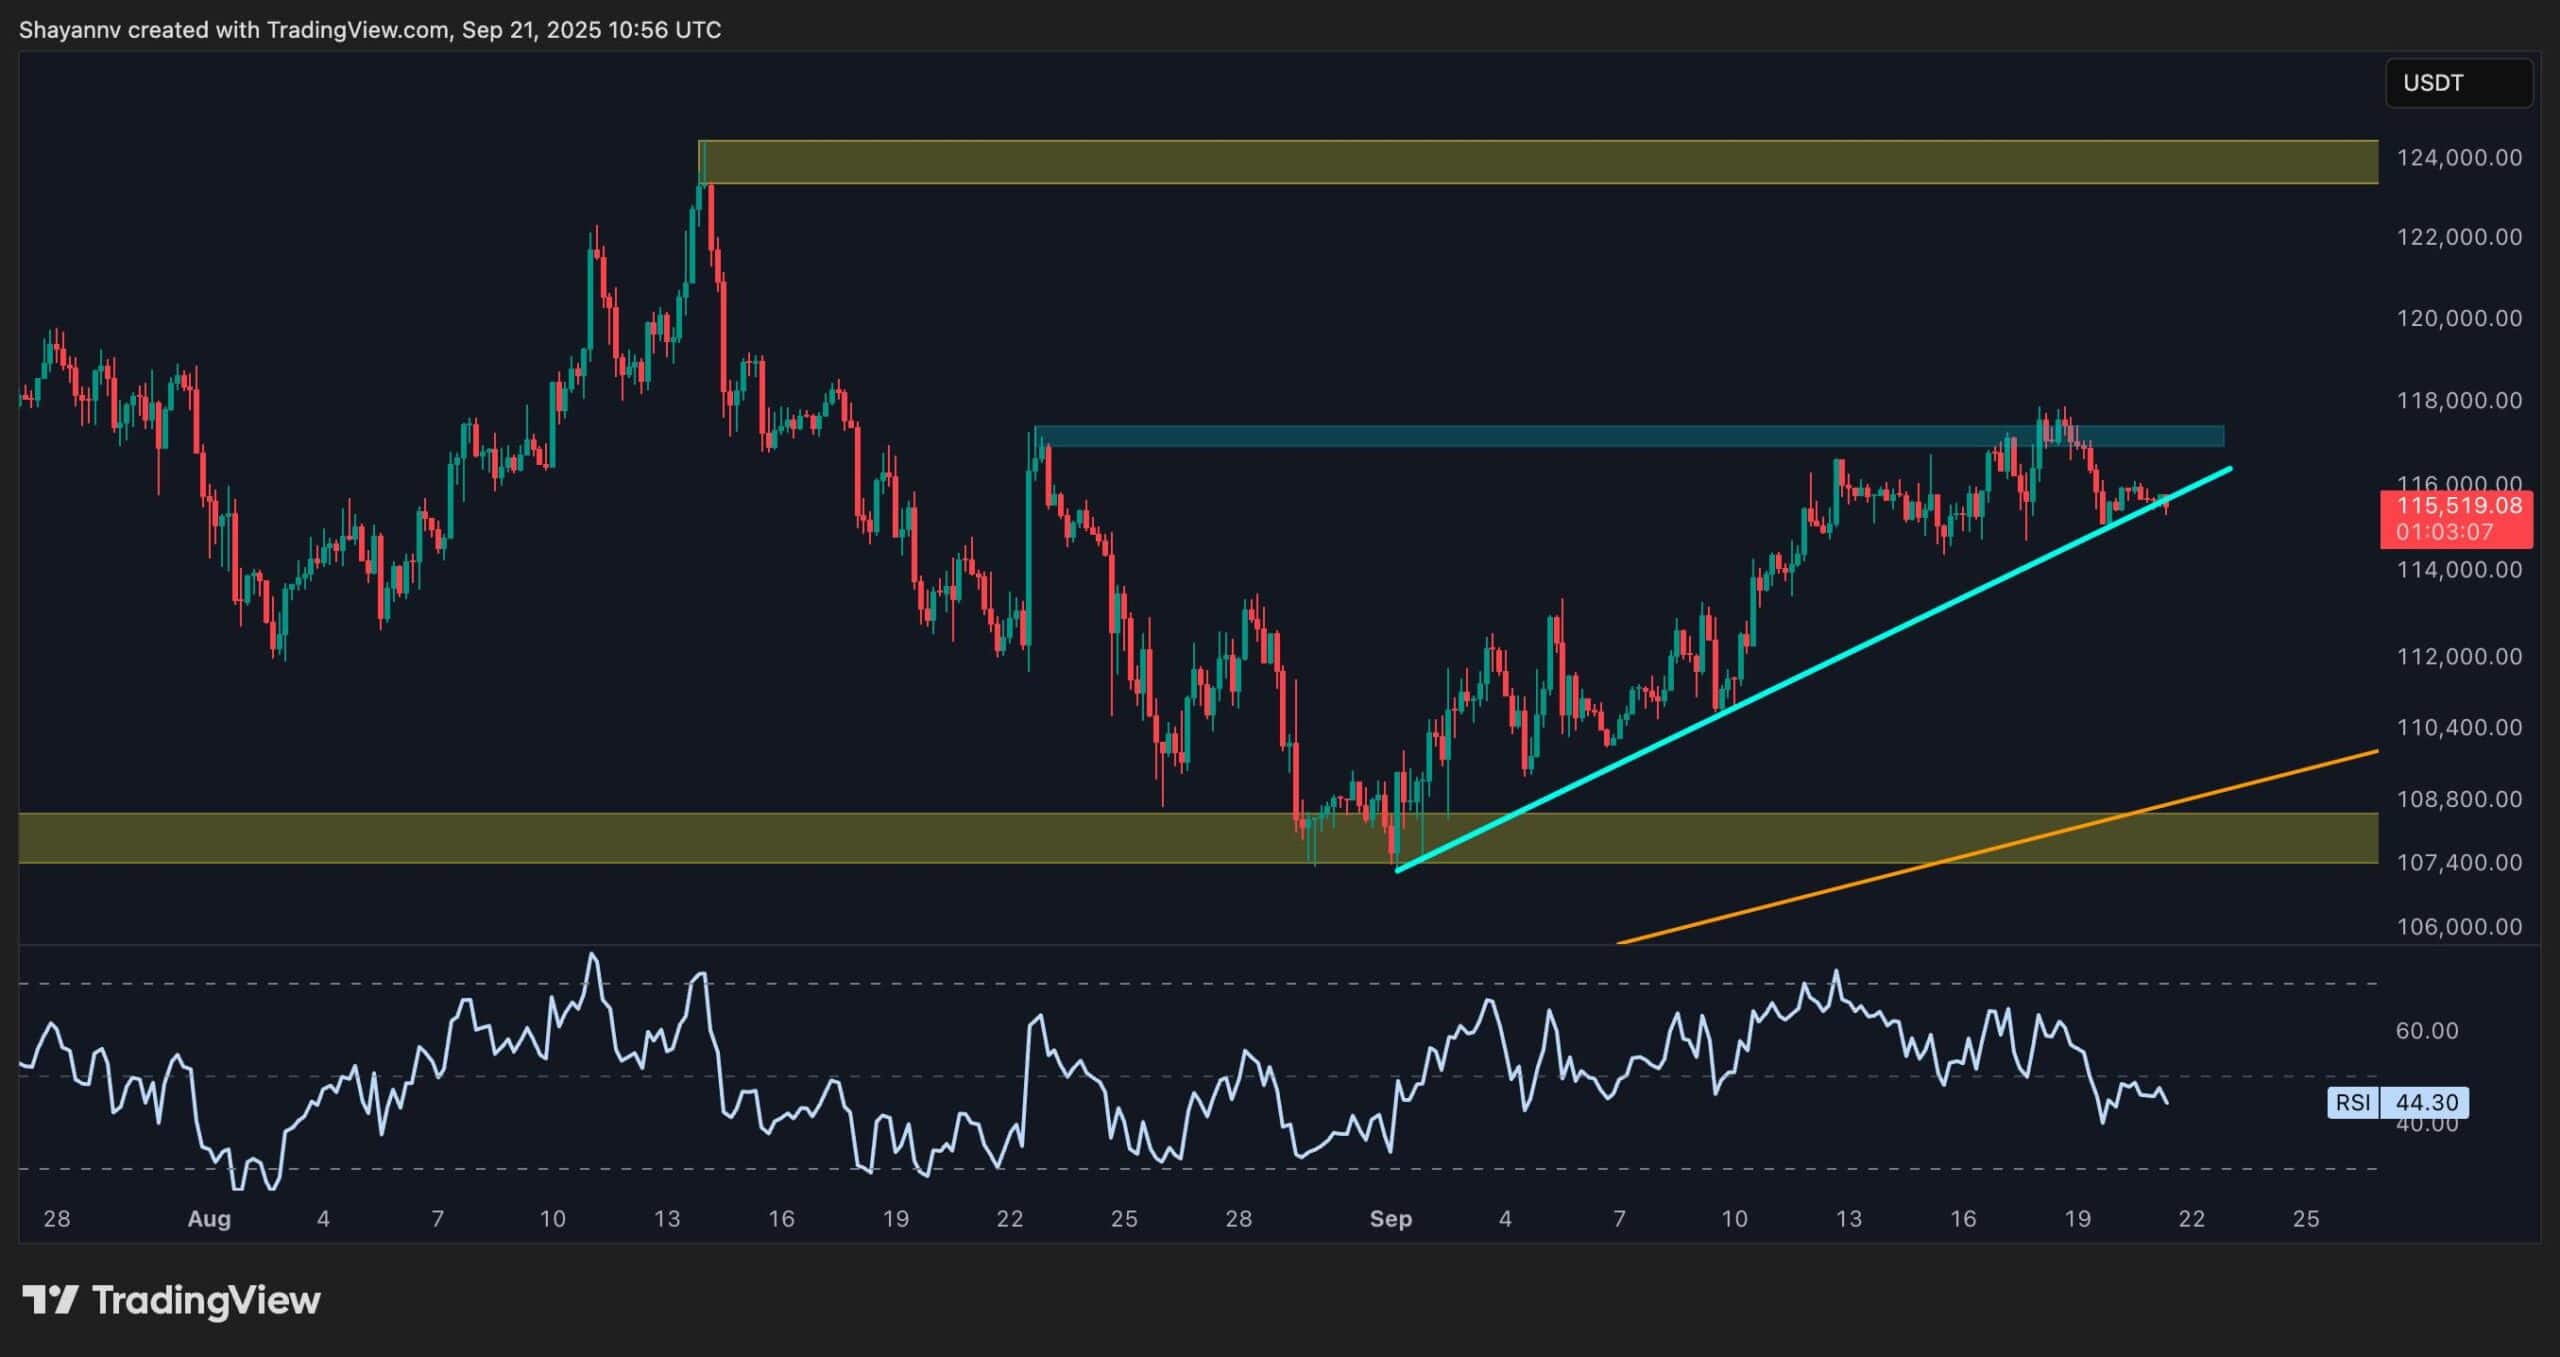
Zooming in on the 4-hour chart, BTC is on the verge of breaking below the short-term ascending trendline, creating the ascending triangle with the $117K resistance zone. This could be an early warning sign of a potential trend shift or deeper pullback, especially as the price got rejected NEAR the $117K–$118K resistance area multiple times.
Momentum has also weakened significantly, with the RSI slipping below 50 and showing a clear bearish divergence between recent highs. If the market fails to reclaim the broken trendline quickly, we could see further downside toward the $108K zone, followed by a potential bounce from the major demand area near $108K.
Onchain Analysis
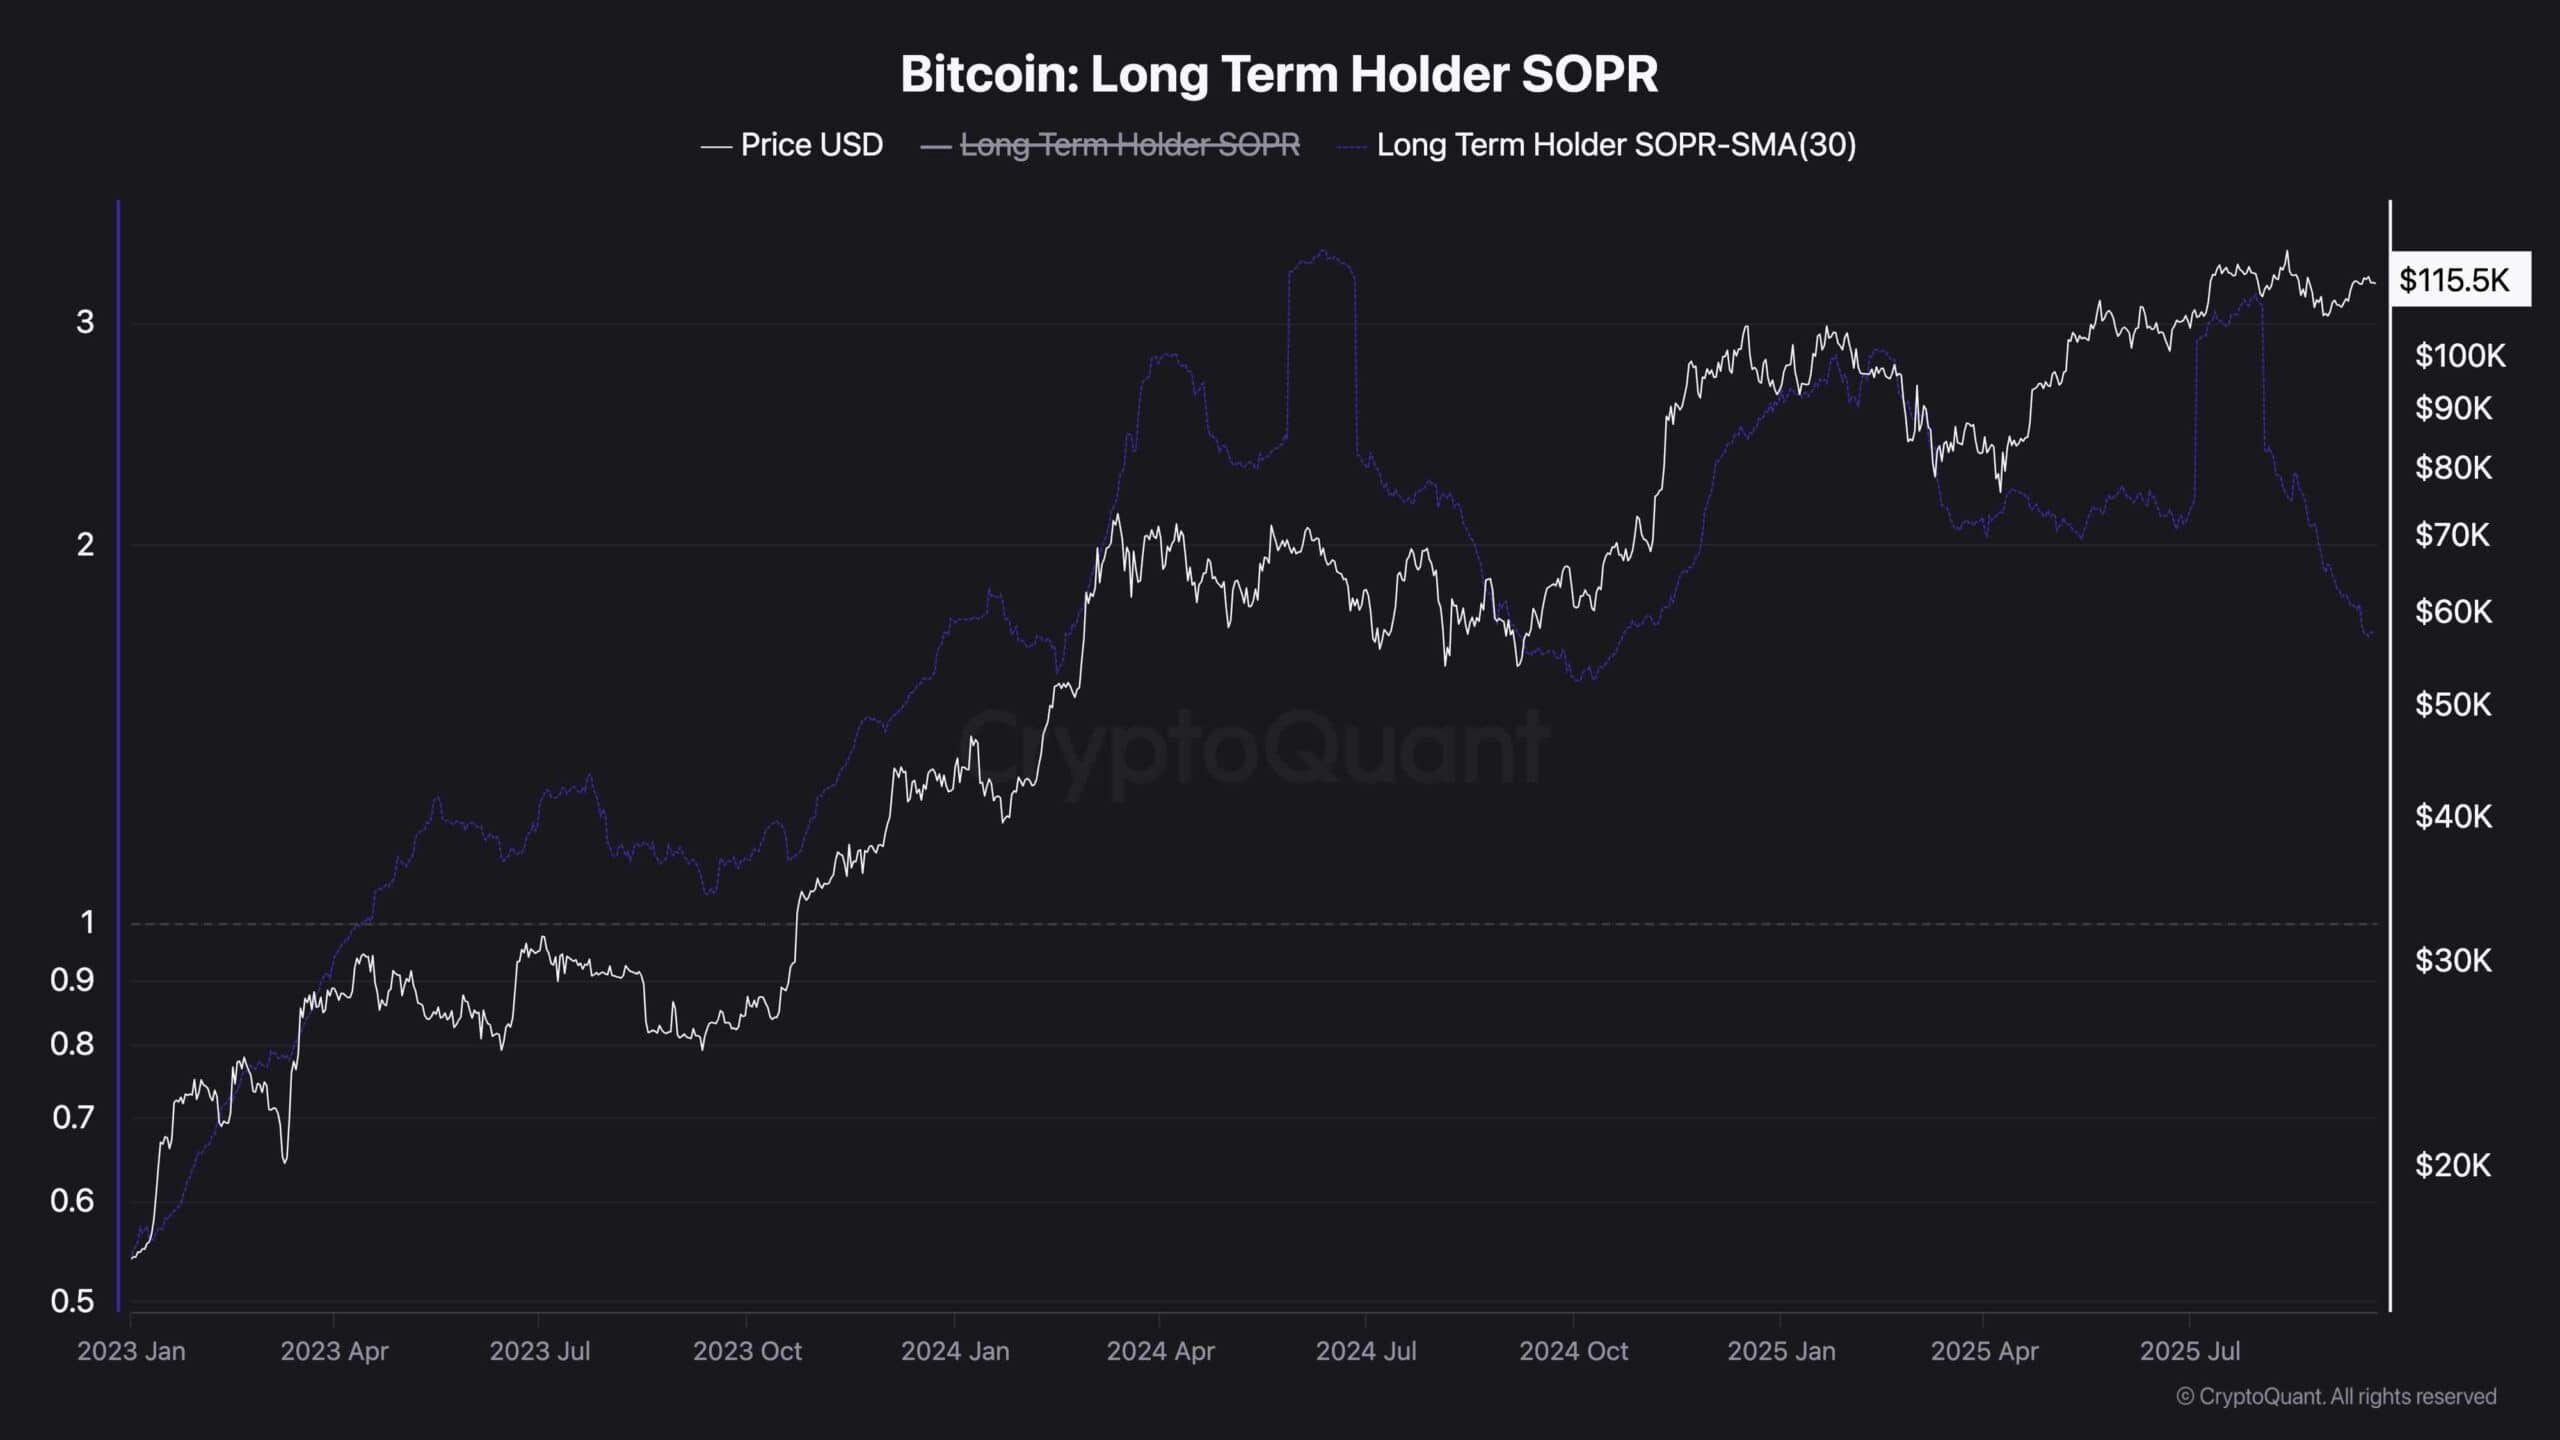
Long Term Holder SOPR
On the sentiment side, the Long-Term Holder SOPR has been steadily declining, even as the price consolidates near local highs. This downtrend in SOPR actually indicates that long-term holders are reducing their spending activity. In other words, they’re selling less and choosing to hold onto their coins.
This often reflects growing confidence in further upside potential, as experienced market participants are less eager to take profits at current prices. It also suggests that supply-side pressure is easing, which could set the stage for a stronger breakout once demand kicks back in. If this holding behavior continues and is matched with bullish momentum, it could support the next leg up in Bitcoin’s rally.