Ethereum at a Crossroads: Will ETH Plunge to $4K or Soar to $5K in September 2025?

Ethereum's price teeters on a knife-edge—market watchers are split between doomsday $4K predictions and moon-shot $5K targets.
The Bull Case: Network upgrades and institutional inflows could send ETH screaming past resistance levels. Traders whisper about a liquidity surge that'd make even Wall Street's algo-bots blush.
The Bear Trap: If macro conditions sour, Ethereum might get dragged down with the rest of crypto—proving once again that 'digital gold' still shines brightest during risk-off periods.
One thing's certain: volatility's coming. Whether you're stacking or bailing, buckle up. (And maybe remind your traditional finance friends that 5% APY on their savings account still loses to inflation.)
Technical Analysis
By Shayan
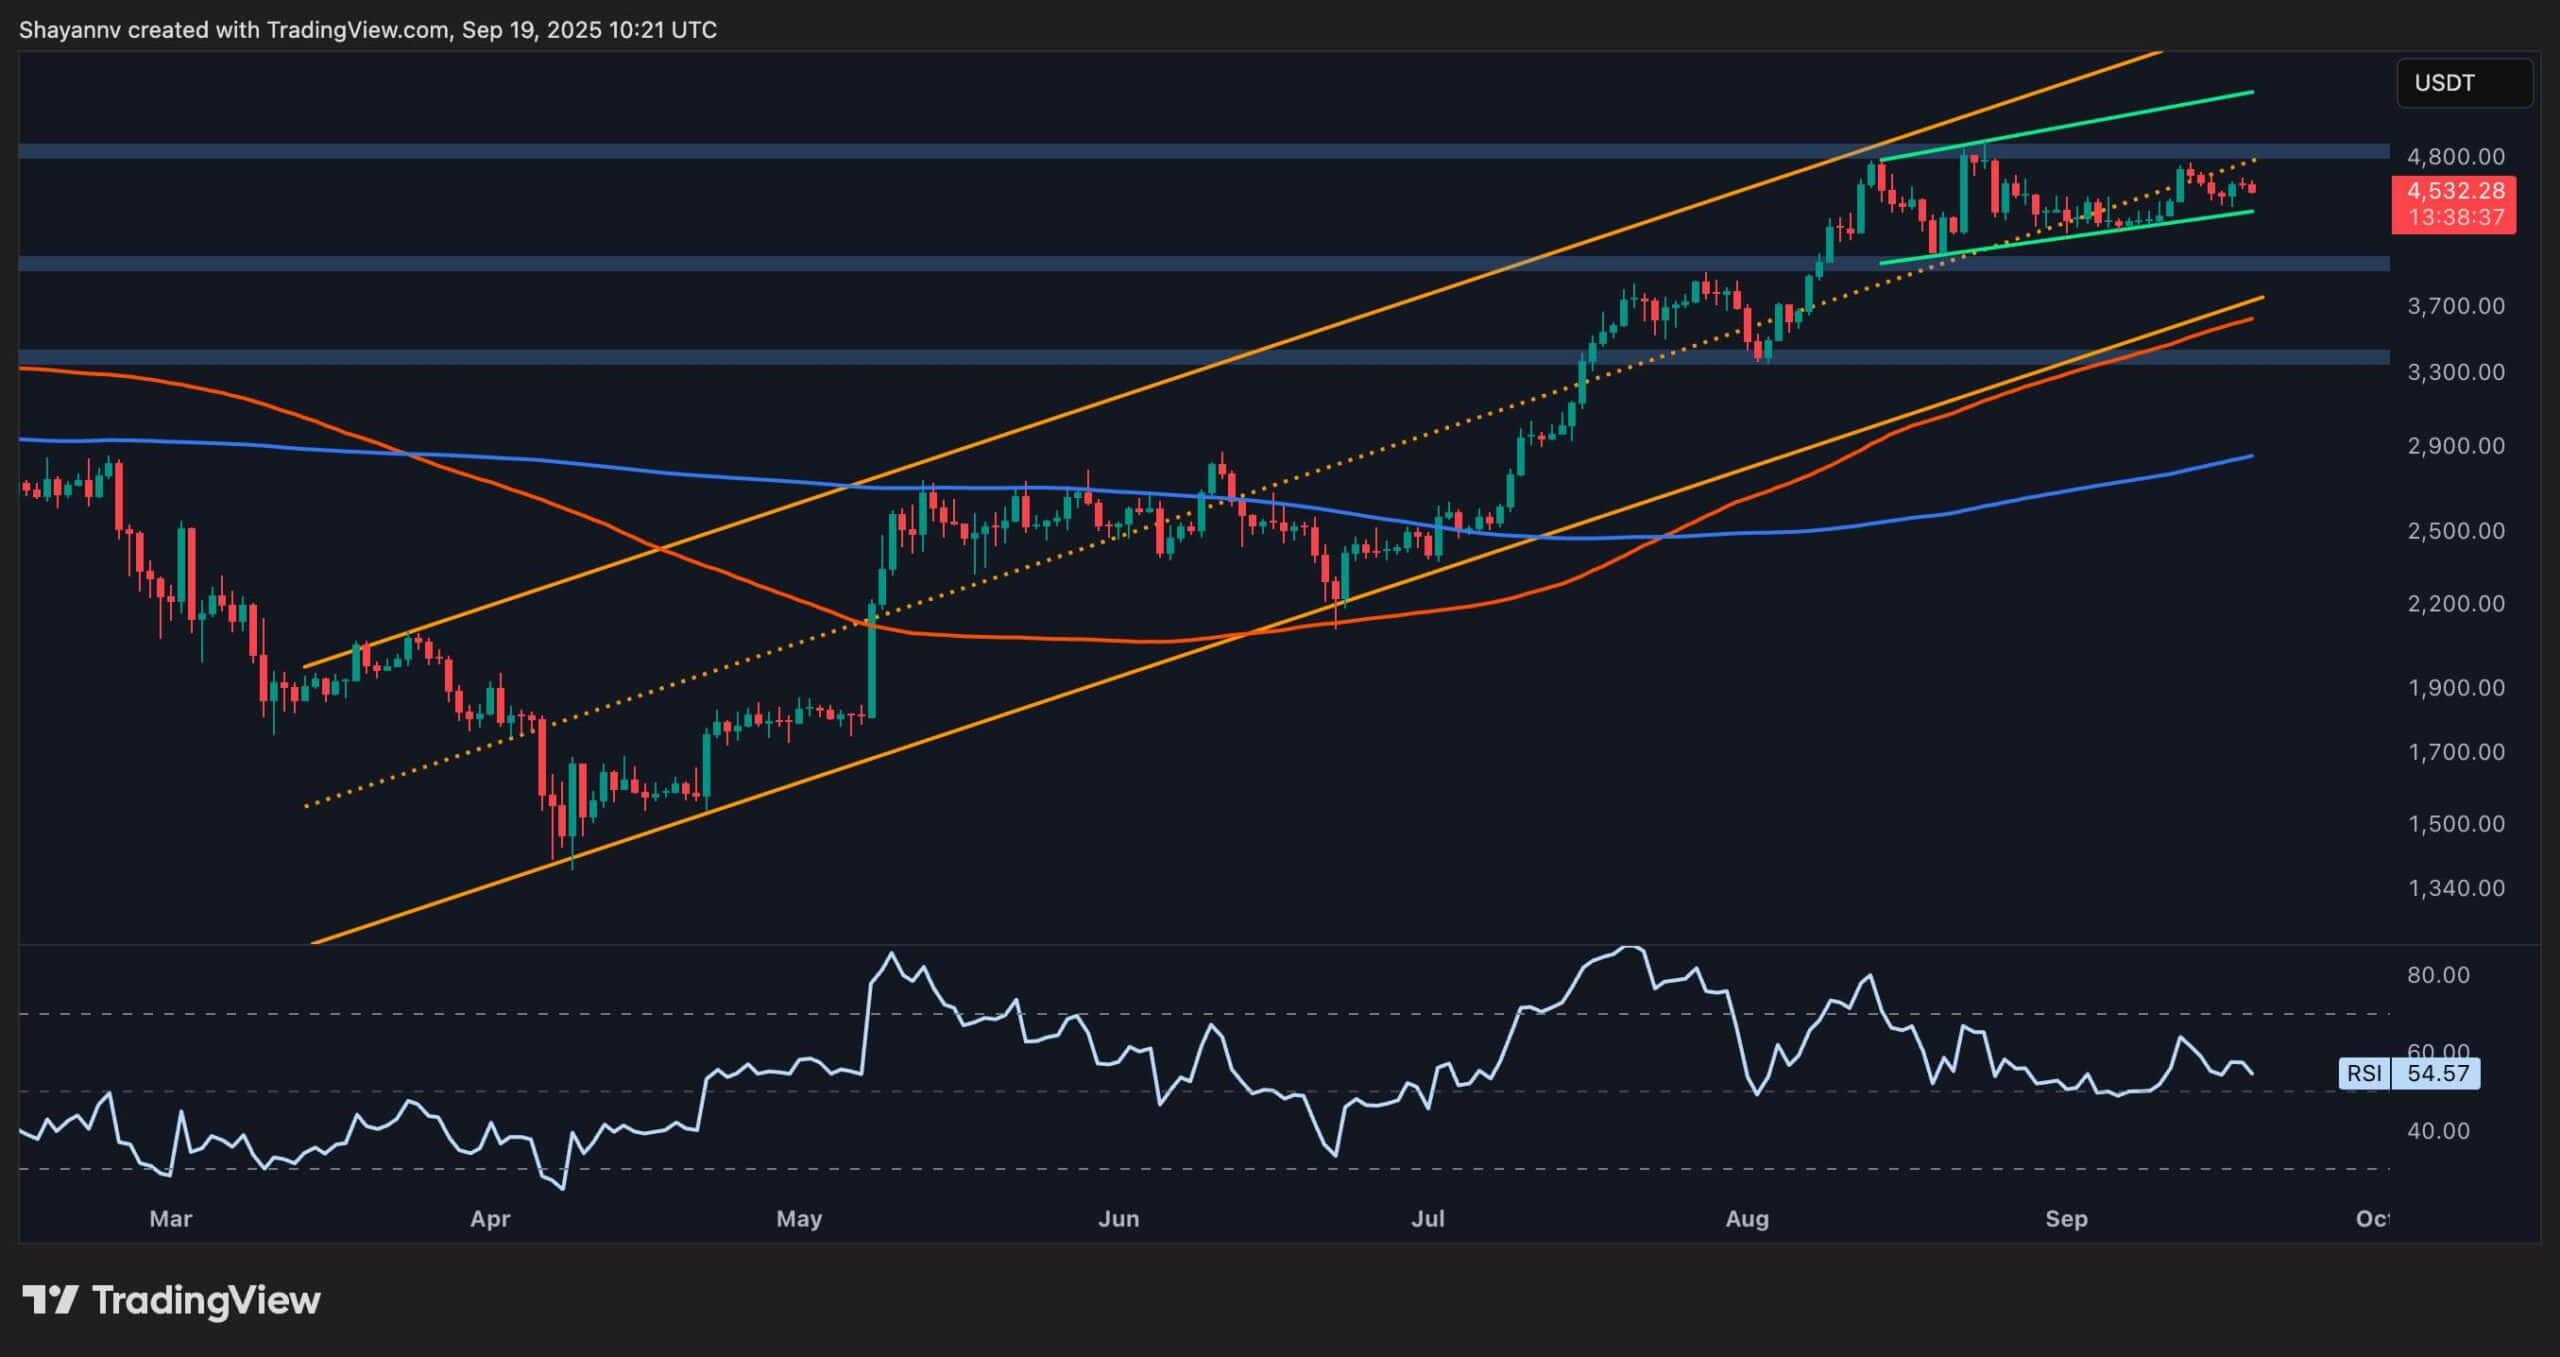
The Daily Chart
The daily chart shows a clear overview of ETH’s uptrend inside a large ascending channel since April this year, with the price reclaiming several key levels, including the 100-day and 200-day moving averages, which are now located around $3,700 and $2,900 marks, respectively.
Currently, the asset is rising gradually within a tight ascending channel, which is also located around the midline of the larger channel. If the smaller channel is broken down, the market will likely revisit the $4,000 level. On the other hand, if the market bounces higher and breaks above the $4,800 resistance zone, a historical rally toward $5,000 and higher WOULD be expected.
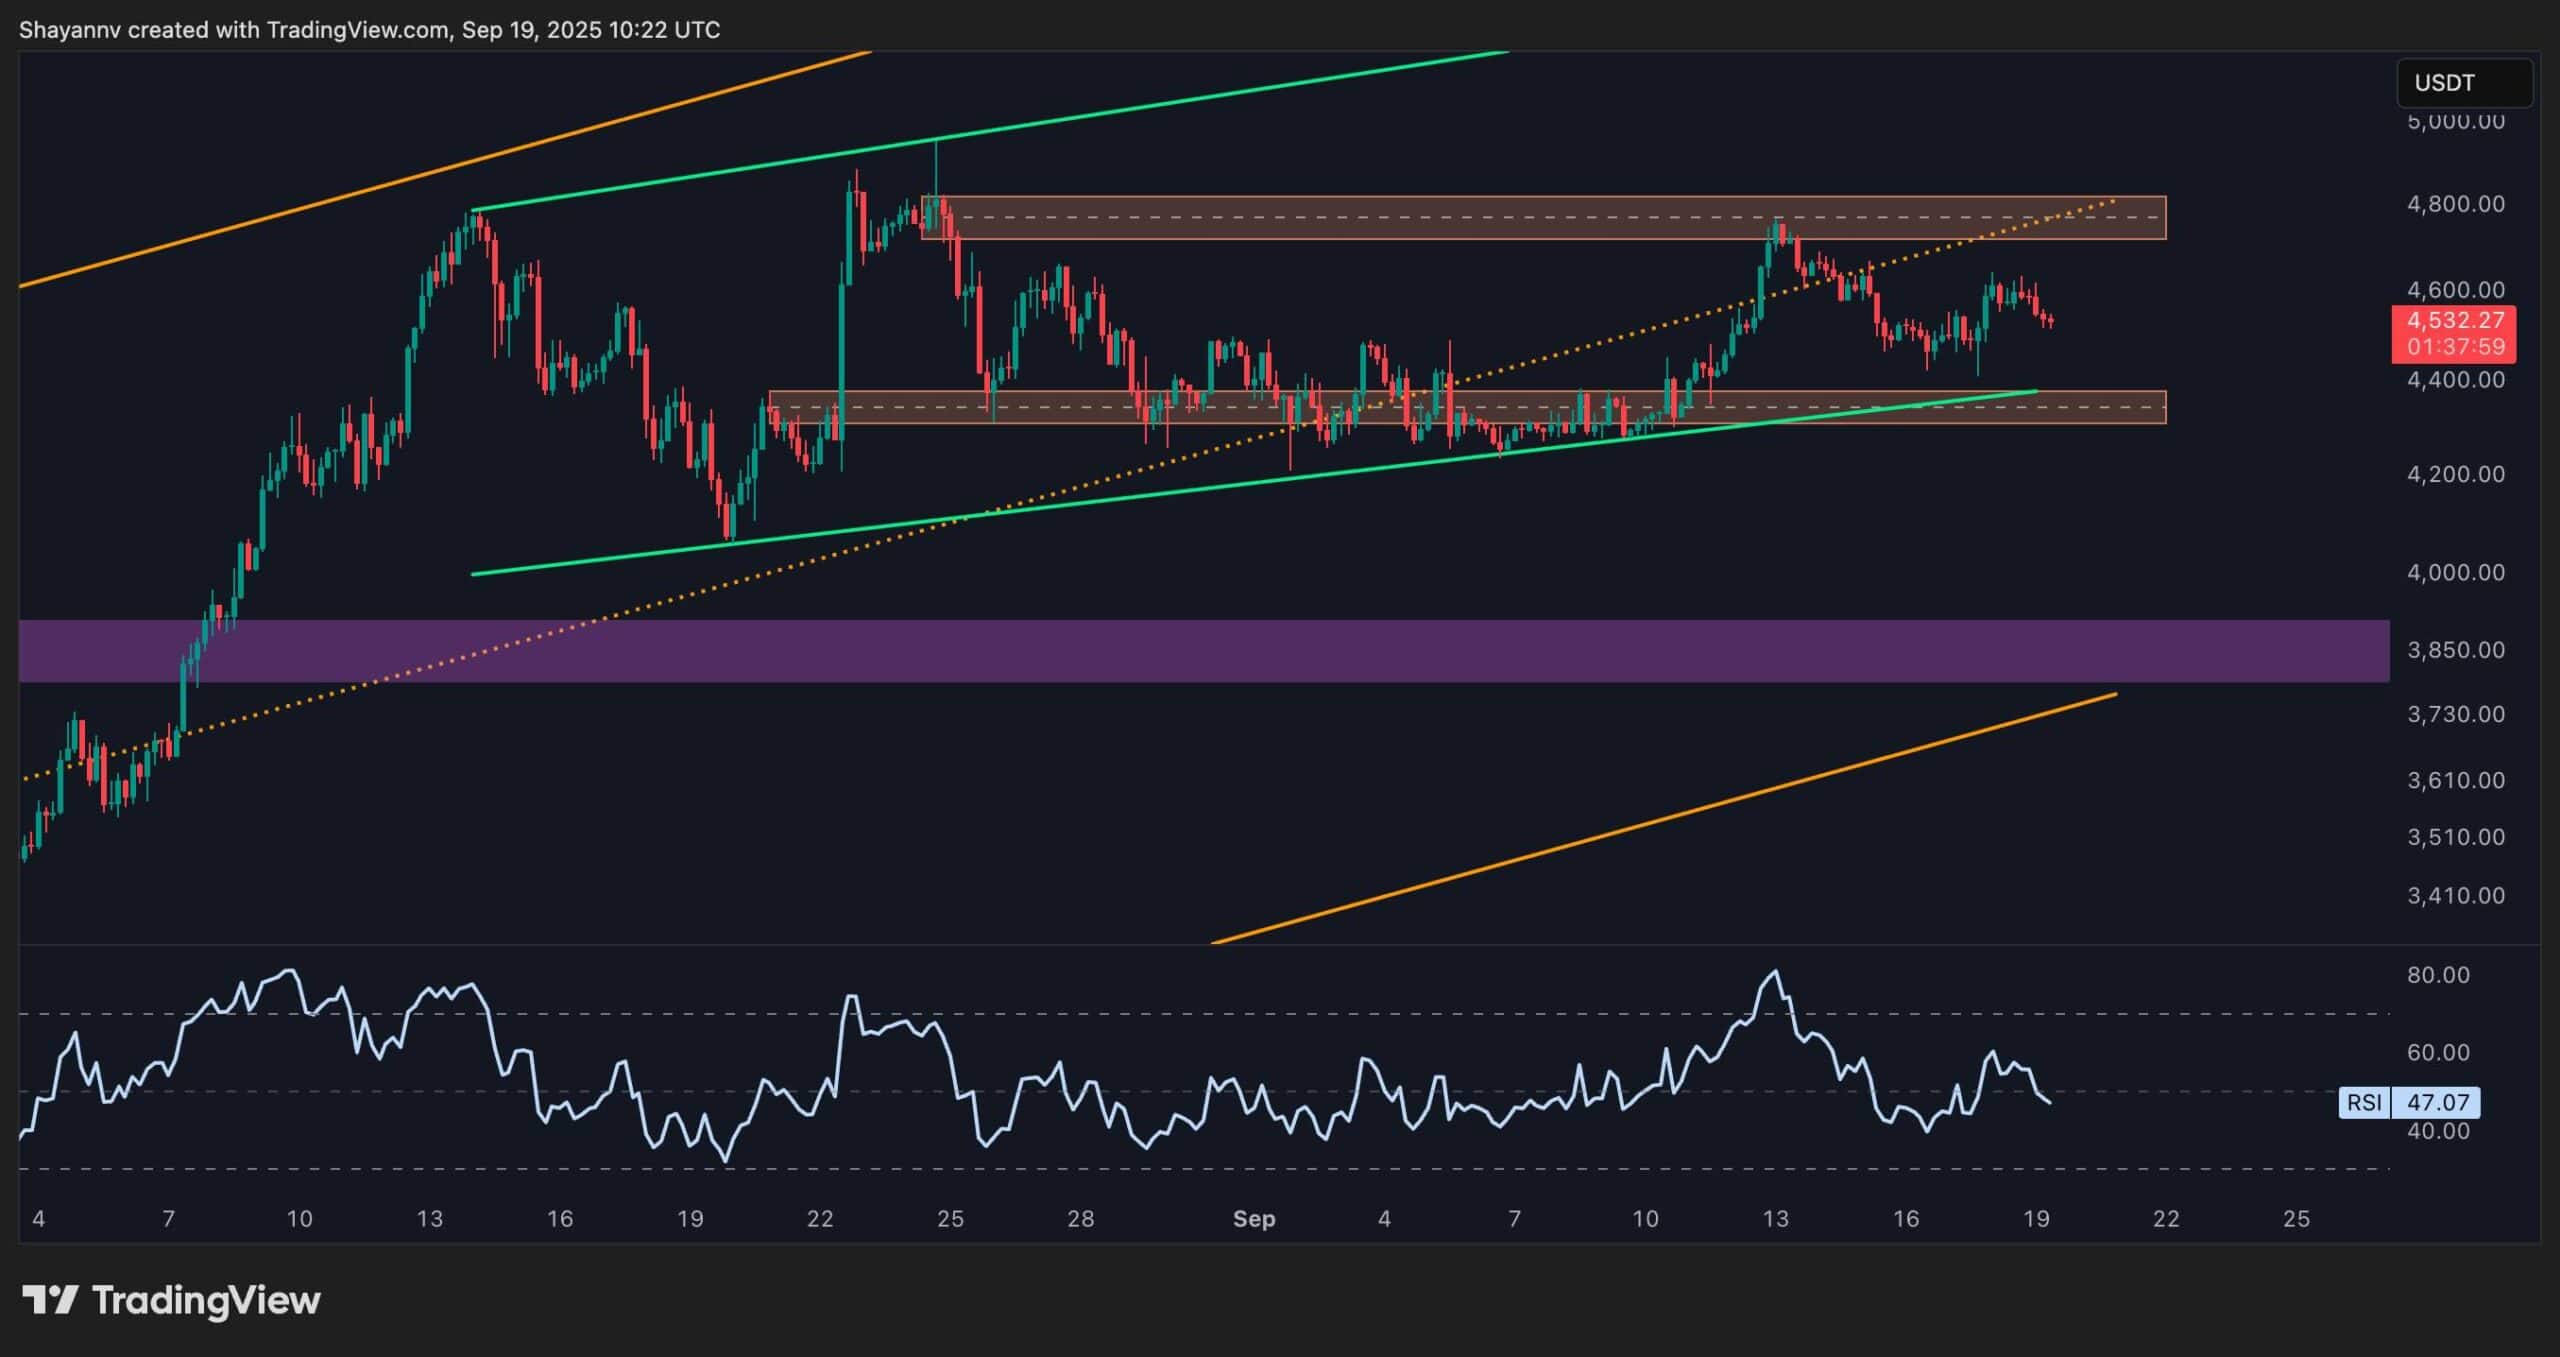
The 4-Hour Chart
Dropping down to the 4-hour timeframe, it becomes clear that the recent consolidation has been mainly bounded inside a range between the $4,300 demand zone and the $4,800 supply zone.
With the lower trendline of the green ascending channel also closing in on the price, the time for the market to make a decision is near. A breakdown of the channel and the demand zone would lead to a retest of the $3,850 demand zone and the lower boundary of the larger ascending channel, while a rebound from this zone would likely push the price past the $4,800 supply area and into the vicinity of the key $5,000 level.
Onchain Analysis
Finding Rates (7-day moving average)
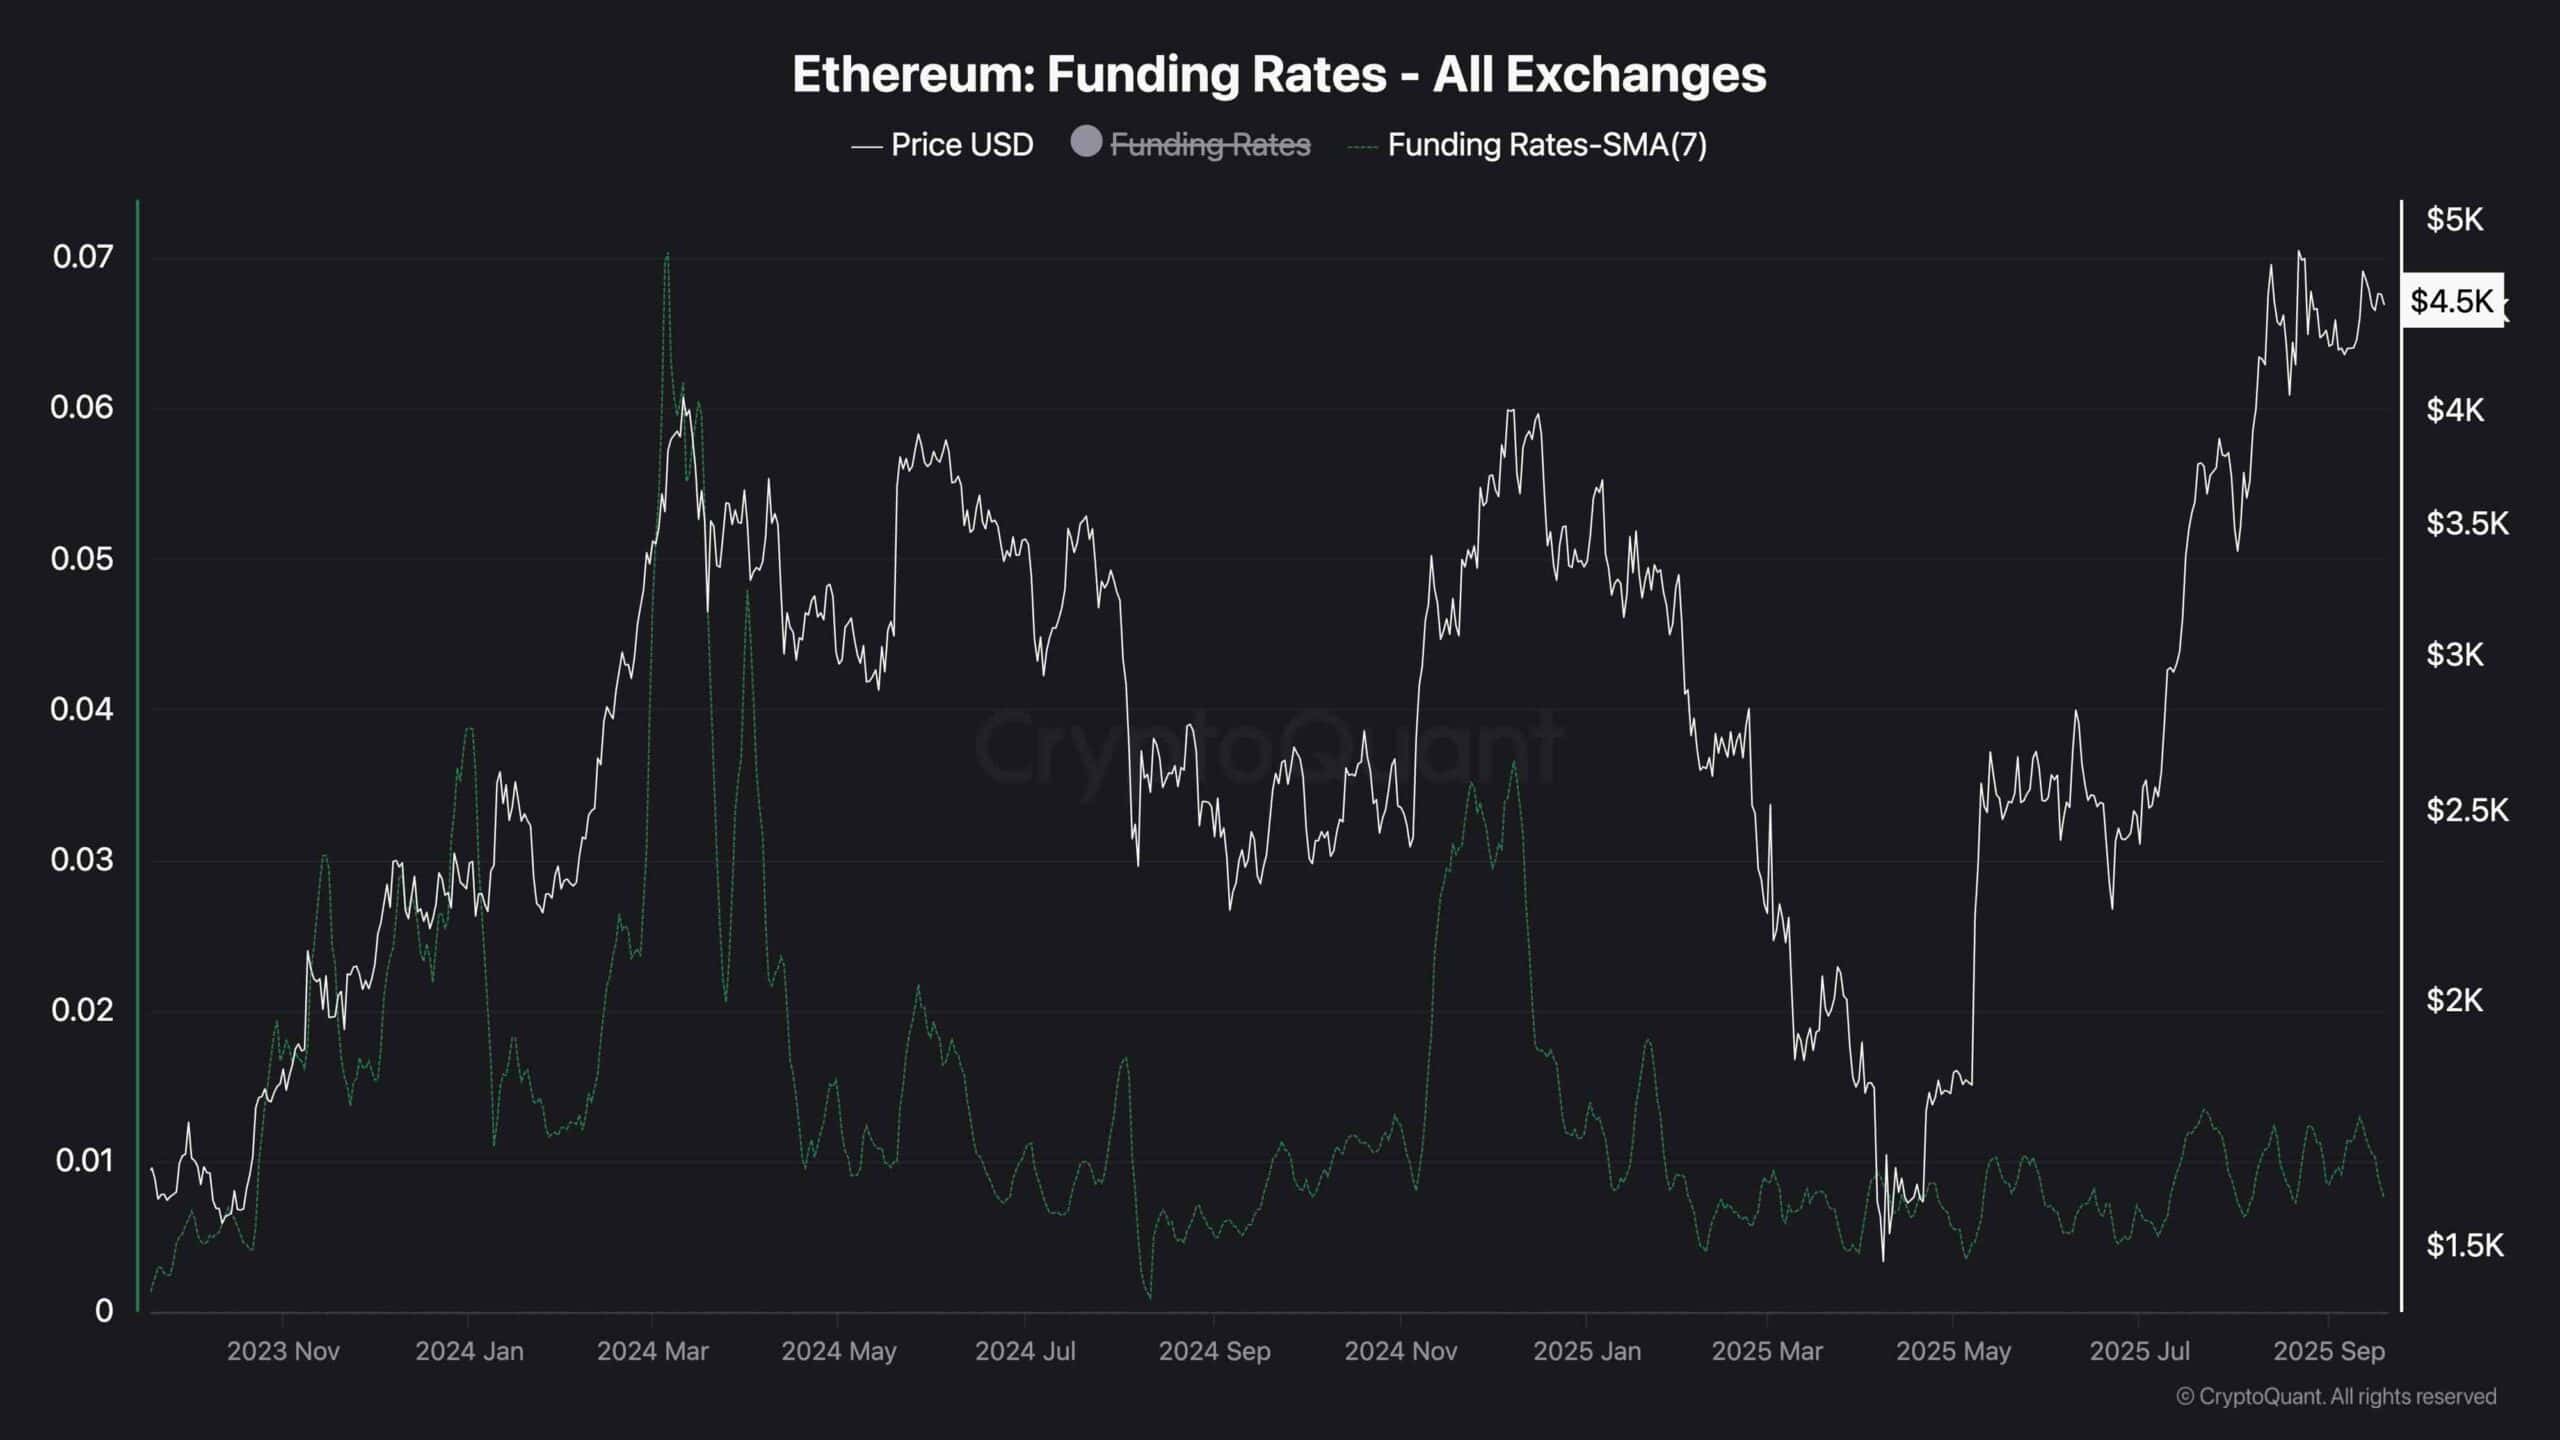
Moving away from technical analysis, this chart presents the 7-day moving average of Etheremu’s funding rates. The funding rates metric measures how aggressive the buyers and the sellers are in the futures market, with positive values indicating more aggressive position-taking by the buyers.
As evident from the chart, the 7-day moving average of the funding rates has shown positive values for quite a long while now. Yet, these values are not comparable to the peaks witnessed in March 2024 and late 2024, when the price also reached long-term highs.
This can be an indication that the market still has room to grow, as the futures market is yet to become significantly overheated. However, caution is still advised because positive funding rates can always lead to liquidation cascades.