Bitcoin’s Wild Ride: $175K Peak Before Potential 80% Plunge

Bitcoin rockets toward unprecedented heights—only to face a stomach-churning drop ahead.
The Run-Up
Momentum builds as BTC eyes that staggering $175,000 target. Traders pile in, fueled by institutional adoption and macroeconomic shifts. The rally feels unstoppable—until it isn’t.
The Cliff Edge
History warns: what goes up must correct. An 80% collapse could follow, wiping out gains and testing holder resolve. Volatility remains crypto’s only true constant.
Finance as Usual
Wall Street shrugs—another cycle, another commission. Whether you’re stacking sats or shorting the top, someone’s always making bank on the volatility. Stay sharp, and maybe keep an exit strategy closer than your hardware wallet.
Bitcoin’s Past Cycles Show Repeated Deep Drops
Bitcoin has seen major corrections after each bull market cycle. Data reviewed by market analyst EGRAG CRYPTO shows that in 2011, the cryptocurrency fell around 93% from its peak. In 2013, the drop was around 86%, followed by 84% in 2017, and roughly 77% in 2022 after the 2021 top.
Notably, the average drawdown across these four cycles comes to around 85%. Based on this, EGRAG suggests a possible 70% to 80% decline in the next bear market. This is not guaranteed but is based on how Bitcoin has behaved over more than a decade of price history.
According to EGRAG’s market model, BTC may still have room to MOVE higher before any major correction begins. The chart shared projects a possible peak at around $175,000. This is once again based on price structures that have formed in previous cycles.
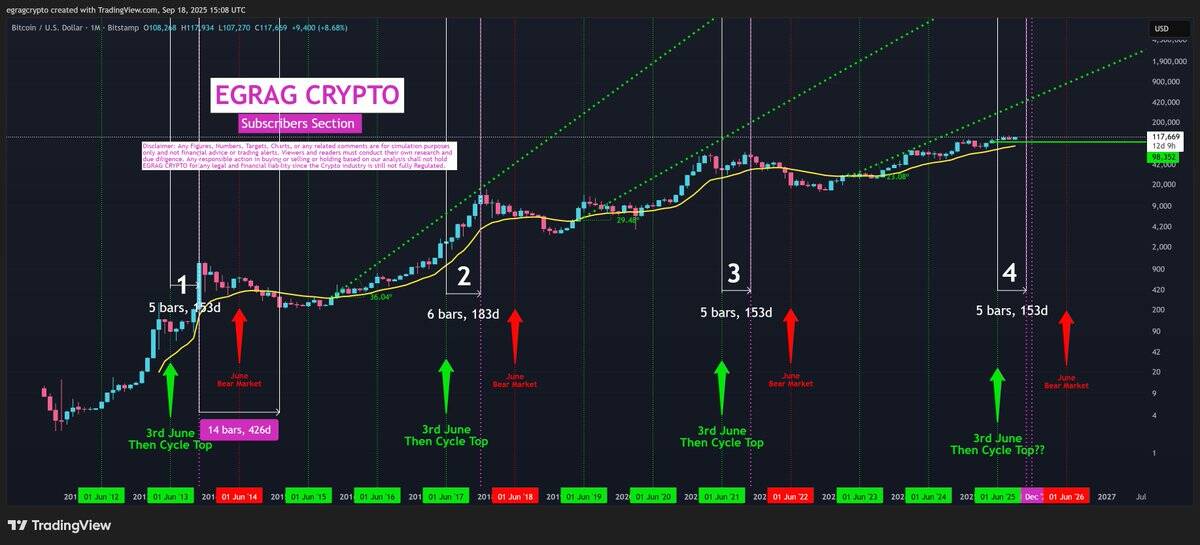
If that high is reached, and a 70–80% pullback follows as in past cycles, bitcoin could fall into the range of $35,000 to $52,000. Timing remains uncertain. The model shows that in previous cycles, peaks formed several months after similar patterns developed.
$4.9 Trillion in Expiries Could Move Markets
Around $4.9 trillion worth of stock and ETF options are set to expire today. This amount is more than 1.2 times the total crypto market cap. These large quarterly expiries, often called triple witching, have a history of driving sharp moves in both traditional and crypto markets.
Crypto Rover noted that past expiries this year were followaed by clear market reactions. After the March 2025 expiry, Bitcoin dropped by about 17% over the next few weeks. The June expiry saw BTC fall below $100,000 shortly after. With the current expiry in play, some traders are preparing for increased volatility in the days ahead.
TODAY, $4.9T in stock and ETF options expire.
This is 1.2x the entire crypto market cap.
Historically, these expirations trigger heavy volatility.
March 2025 saw a crash weeks later, while June pushed $BTC below $100K. pic.twitter.com/Uox3DI4fEk
— Crypto Rover (@rovercrc) September 19, 2025
Technical Pattern Could Signal Short-Term Path
Ali Martinez shared a chart that shows a potential inverse head-and-shoulders formation on Bitcoin’s 4-hour chart. The left shoulder formed in late August, the head in early September, and the right shoulder may be developing now.
He noted that Bitcoin might dip to around $112,000–$113,000 before rebounding. He added that “a rally to $130,000” could follow if the price breaks above the $117,950 neckline. Key resistance levels to watch in that case are $121,000, $125,000, and $127,000.
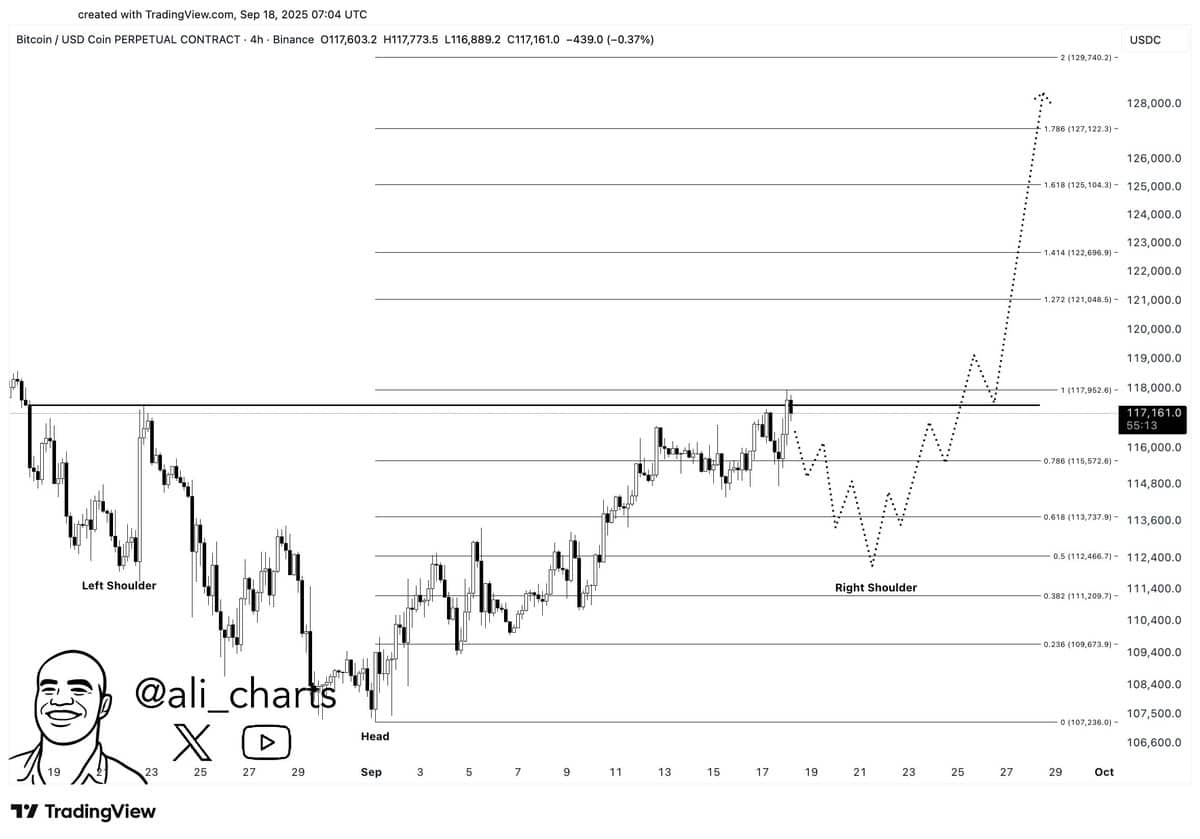
At the time of writing, Bitcoin was trading at around $116,800, with a slight 24-hour drop and a 7-day gain of 1%. Trading volume over the last day stood at $36.7 billion.
