Bitcoin Price Analysis: BTC Targets New Highs as Fed Rate Uncertainty Disappears

Bitcoin breaks free from Fed speculation—and the charts show no signs of slowing down.
Market Momentum Shifts
With rate fears fading, BTC charges toward fresh peaks. No more waiting on central bank whispers—traders are stacking sats, not watching headlines.
Technical Outlook Strengthens
Key resistance levels crumble as volume spikes. This isn’t a slow grind—it’s a full-scale rally, fueled by real demand, not hopium.
Institutional Flows Return
Big money’s back, and it’s not asking for permission. While traditional finance debates basis points, crypto’s already pricing in the next cycle.
Watch those highs—Bitcoin’s playing a different game now. And honestly, watching Wall Street overthink Fed decisions while BTC just… climbs? Priceless.
The Daily Chart
Bitcoin’s daily chart demonstrates a clear bounce from the $107K demand zone and a rise back above the 100-day moving average, located around the $113K mark. After yesterday’s Fed rate cut, the asset is continuing its path toward the $124K supply zone, which aligns with the current BTC all-time high.
The RSI is also trending above the 50% level, indicating that the momentum has now shifted bullish once again. All these signals point to a potential continuation toward the $124K ATH and likely a further rally toward $130K and even higher.

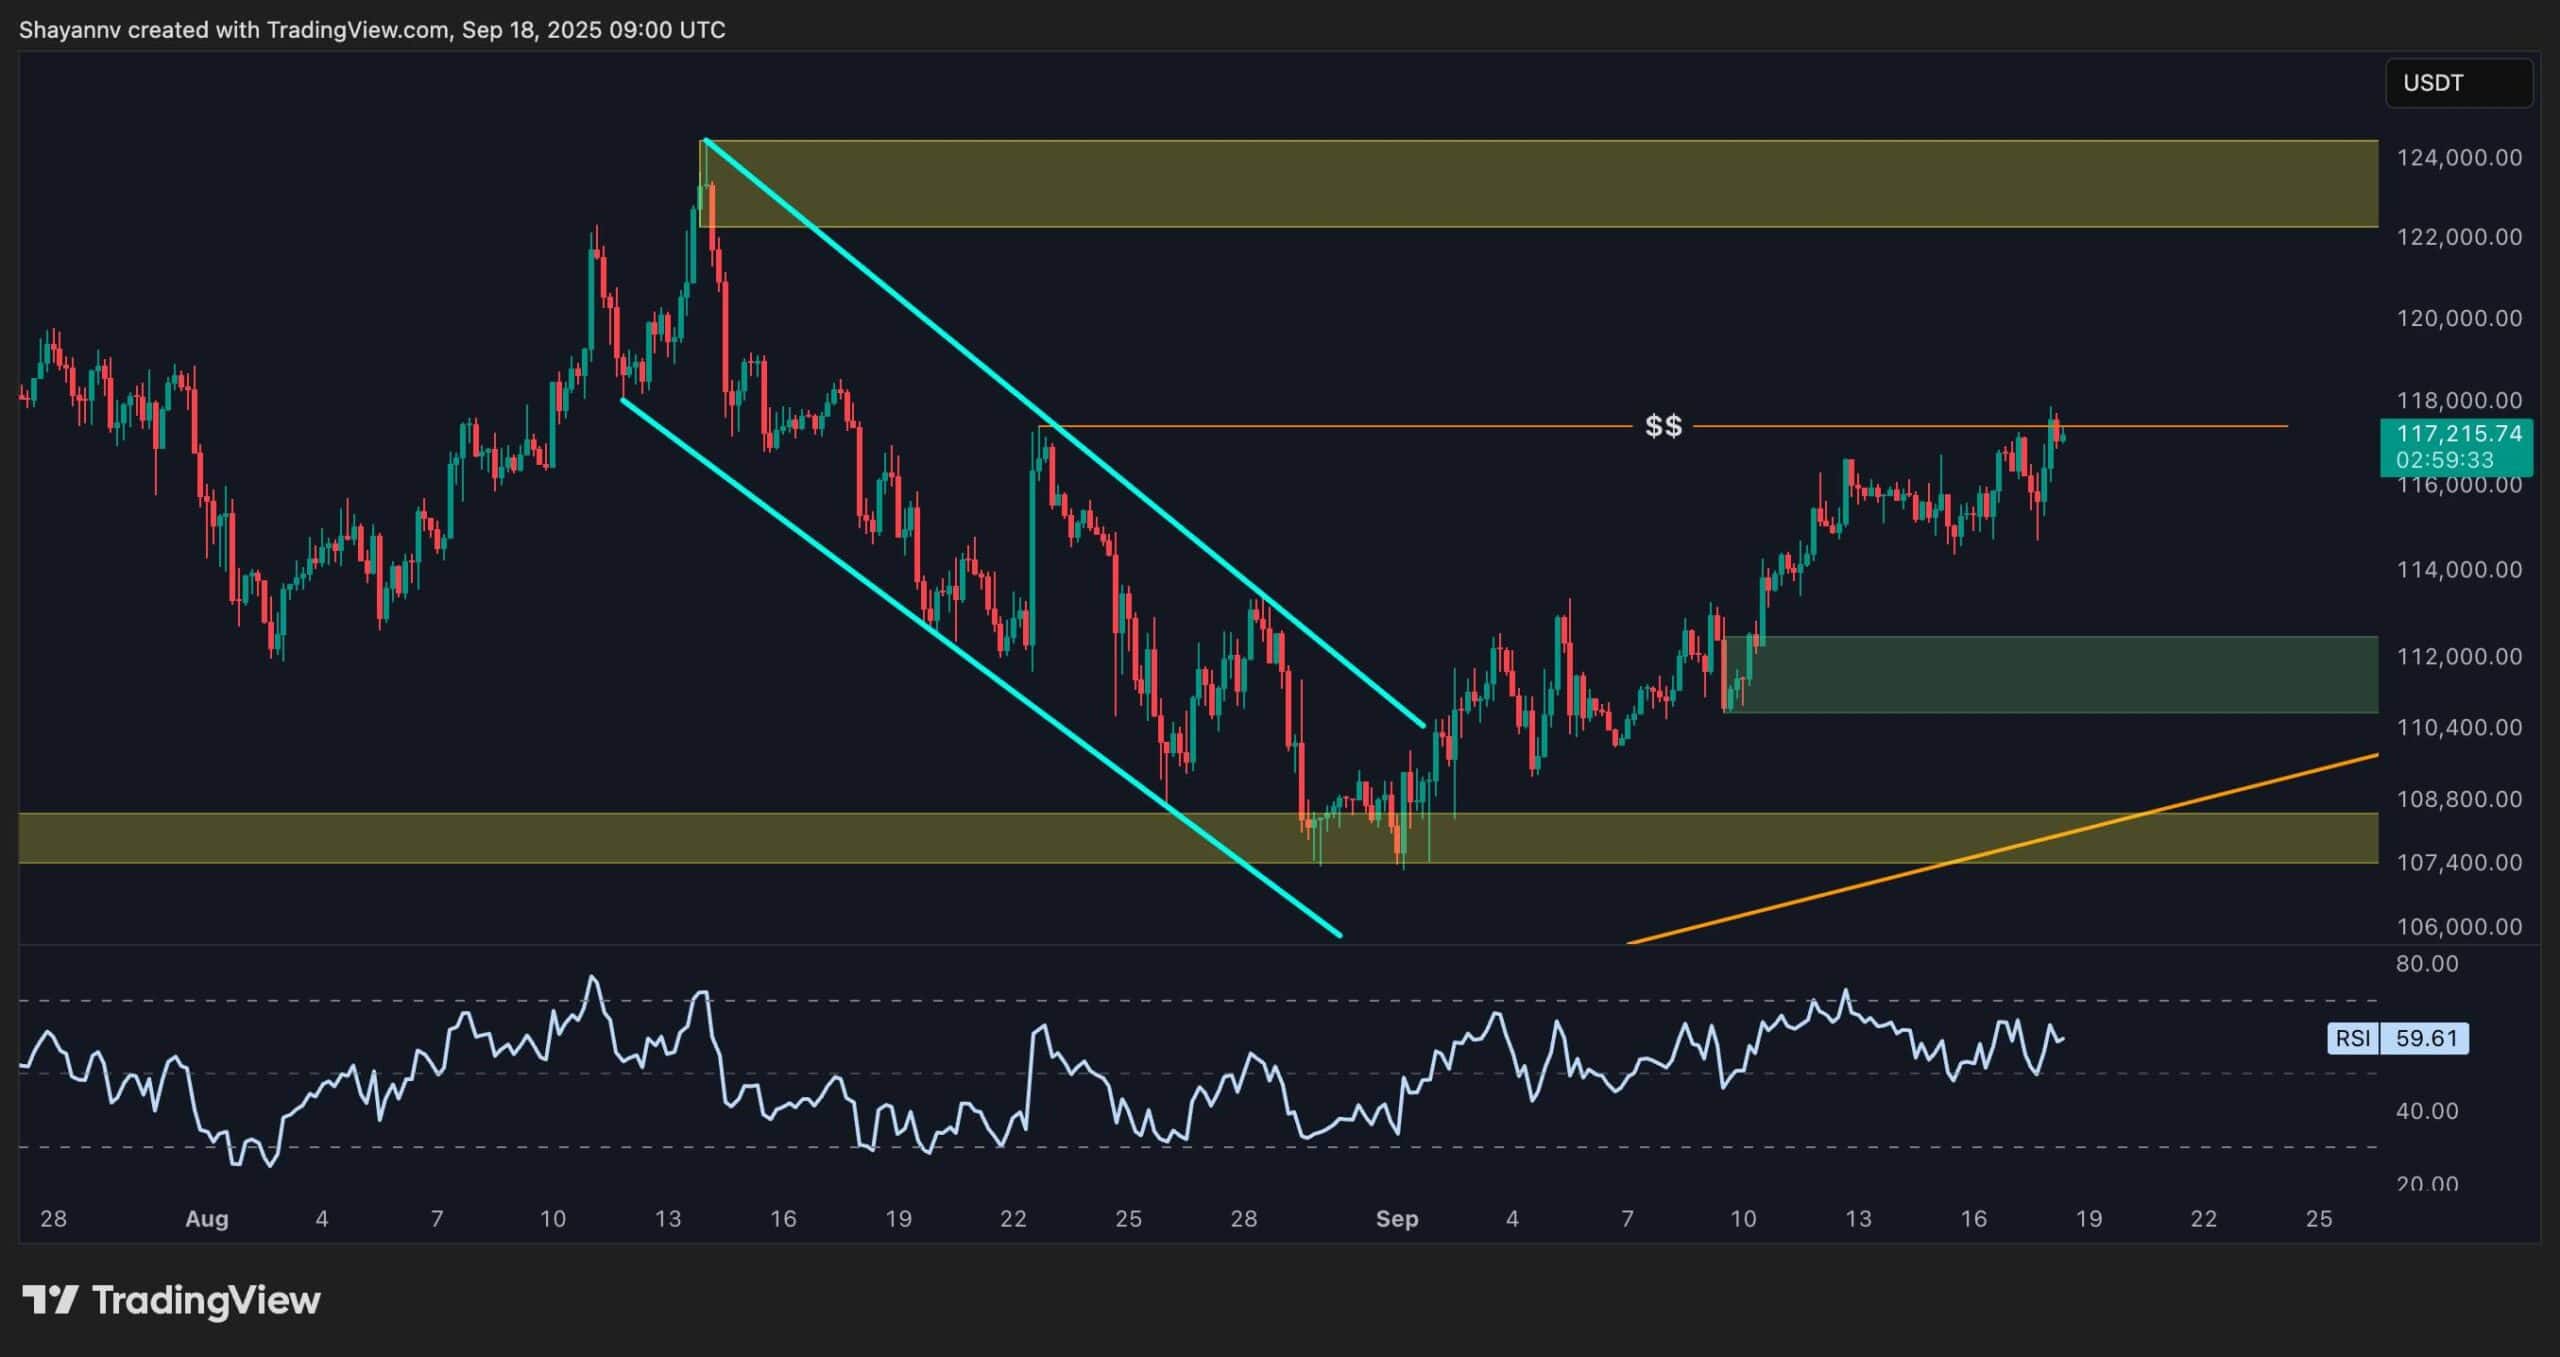
The 4-Hour Chart
As the 4-hour chart demonstrates, Bitcoin’s recent rally has occurred after the price successfully broke out of a descending channel, following a swift double bottom rebound at the $108K supply zone.
The asset has now swept the liquidity pool above the previous $107K high, which can lead to two possible scenarios. The market can either carry on with the uptrend and attack the $124K area once again, or it can pull back at least to the $112K order block, which is the most notable demand zone nearby. Yet, with the RSI still below the overbought region, the price seemingly has more room to grow before a correction occurs.
Sentiment Analysis
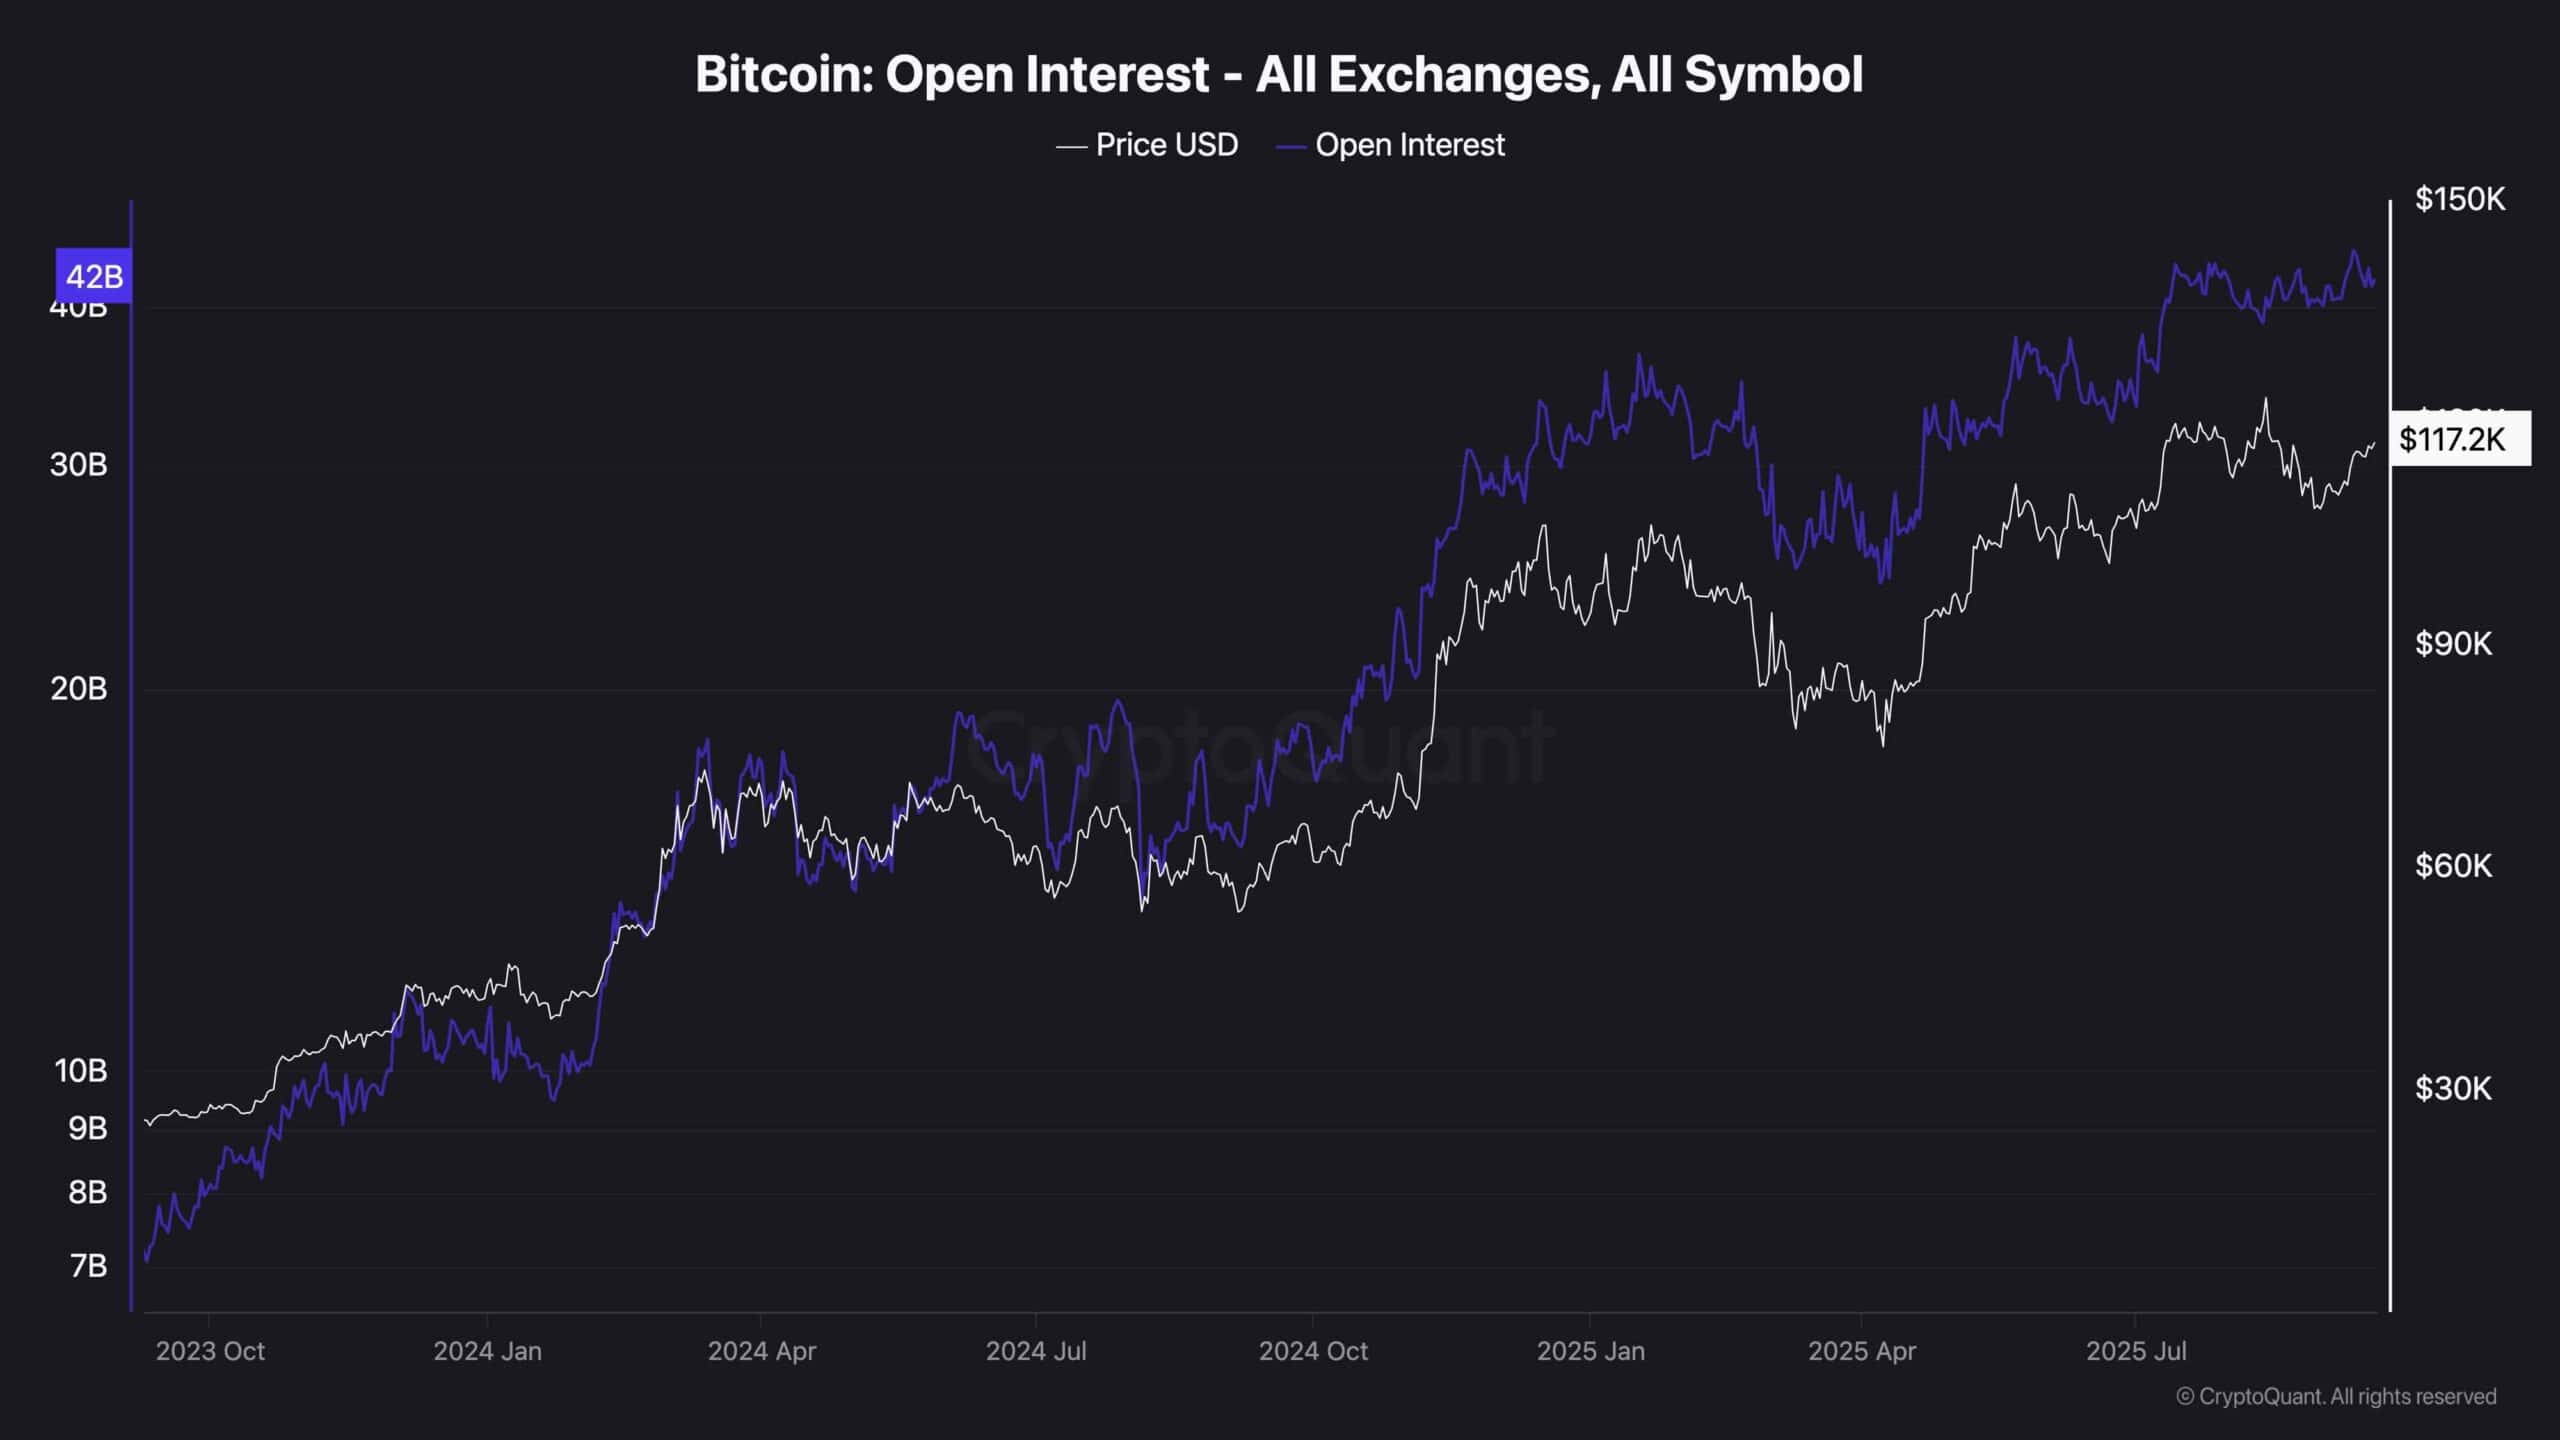
Open Interest
This chart displays the Bitcoin aggregate open interest, which shows the number of open perpetual futures positions. Typically, during bullish market conditions, this metric climbs higher or consolidates, as more and more traders are taking Leveraged positions. This is exactly what can be seen on the chart.
Meanwhile, another interesting observation is that even with the market going through a short-term correction a few weeks ago, the open interest has yet to drop. While this is generally a bullish sign, it also points to the fact that the futures market might still be overheated. Therefore, there is still the probability for a liquidation cascade to happen in the short term, which could cause a flash crash before the market stabilizes again.