PEPE Set to Soar 78%? Analyst Foresees Explosive Rally Ahead

Brace for impact—PEPE's chart flashes bullish signals that could send shockwaves through meme coin markets.
Technical Breakout Imminent
Analysts spot a perfect storm brewing: converging trendlines, soaring volume, and whale accumulation patterns hint at a potential 78% surge. The meme token defies broader market lethargy, carving its own path upward while blue-chips stagnate.
Market Dynamics Shift
Retail traders flood into PEPE futures, leveraging positions as institutional players remain oddly silent—perhaps too busy counting their Bitcoin ETF profits to notice the frog-themed uprising. The token's community-driven momentum bypasses traditional fund flows, creating a volatility cocktail that could either mint new millionaires or vaporize leverage gamblers.
Regulatory Shadows Loom
While traders chase gains, regulators sharpen their pencils—another 'unexpected' crackdown likely drops right after retail FOMO peaks. Because nothing says financial innovation like waiting for mom-and-pop investors to pile in before pulling the rug.
Price Holds Steady Near Breakout Zone
PEPE is trading at $0.00001135, up 4% over the past 24 hours and 7% weekly. Daily trading volume is close to $958 million, showing strong market participation.
On the chart, Pepe is forming a symmetrical triangle, a structure that often develops during periods of price compression. The asset has been making lower highs and higher lows over several months, tightening the range. The most recent level of $0.00001087 places the token close to the triangle’s apex.
Analyst Ali Martinez posted, “$PEPE readies for a 78% price move!” referring to the current chart setup. Symmetrical triangles typically precede sharp moves, but direction remains unclear until a breakout or breakdown is confirmed.
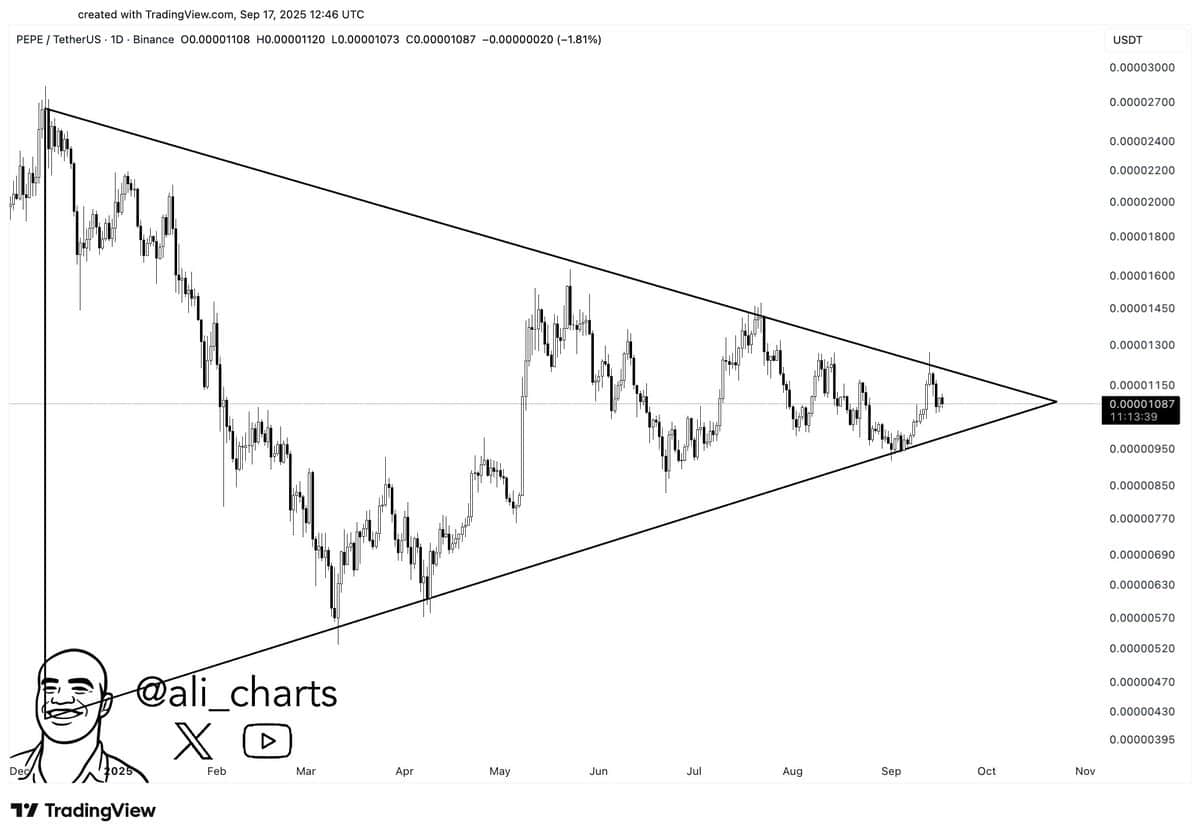
Breaking above the triangle upper trendline could increase the momentum toward the $0.00001800-$0.00002000 range. Upon breakdown, the previous support NEAR $0.00000630 could come into perspective. Until then, the market continues to trade within this narrowing range.
Familiar Pattern Reappears
According to CryptoLycus, PEPE is forming a pattern that looks similar to one seen in late 2024. At that time, the price broke out of a wedge and gained over 260%. Lycus commented,
$PEPE is currently forming a very similar bullish wedge pattern to the one we saw last time which led to a massive +200% breakout
The structure is forming again and history shows how explosive these setups can be once the resistance breaks. A breakout from here could easily… pic.twitter.com/0sbksS3R0n
— LaCryptoLycus (@CryptoLycus) September 17, 2025
A similar wedge has formed again in recent months. The asset is currently near $0.00001093, just under resistance. The projected move, based on previous behavior, could reach up to $0.00002837, or more than 300% from current levels, if confirmed.
Liquidation Pressure Builds on Shorts
According to data from CoinGlass, PEPE is trading at $0.00001138, close to a zone where short liquidations begin to build. The chart shows heavy clusters of Leveraged short positions between $0.0000119 and $0.0000128. If the price pushes into this range, many short positions could be forced to close, creating conditions for a short squeeze.
 Source: CoinGlass
On the downside, cumulative long liquidation levels appear more concentrated below $0.0000103, but the exposure tapers off as the price moves lower. This suggests fewer long positions are at risk compared to shorts above current levels. As a result, an upside breakout above resistance carries greater potential to trigger liquidations and add momentum to buying pressure.
