ETH Teeters at $4K Brink: Breakdown Could Trigger Massive Selloff

Ethereum faces its most critical test in months as the $4,000 support level shows alarming weakness.
Technical analysts warn that breaching this psychological barrier could trigger cascading liquidations across derivatives markets. The last line of defense sits at $3,850—a level that held strong during July's correction but now looks increasingly vulnerable.
Traders watch perpetual funding rates turn negative while open interest suggests leveraged positions remain dangerously elevated. One wrong move and we might witness the classic crypto phenomenon where everyone's 'long-term hold' suddenly becomes a panic sell.
Meanwhile, traditional finance pundits who just discovered ETFs six months ago will undoubtedly blame 'volatile crypto markets' while ignoring their own 0.05% yield bond portfolios.
Ethereum Price Holds Within Range
Ethereum (ETH) is trading at around $4,500 with a 24-hour trading volume of $32.4 billion. The asset has slipped slightly in the past day but is still up 4% over the week. Despite these moves, ETH remains locked in a range, with the all-time high NEAR $4,900 forming the top and $4,000 acting as key support.
The ETH/USDT 2-hour chart shows sideways action after the recent sweep of the ATH. crypto Bully described ETH as “lacklustre since the ATH sweep,” adding that the market looks like a range “unless either of the levels is broken.”
Meanwhile, the price has dropped under the Monday low and is moving closer to the monthly open, pointing to short-term weakness. Even so, the wider range stays intact while ETH trades above $4,000. Short-term levels, such as the weekly open and Monday high, continue to cap any upside.
$ETH has been lacklustre since the ATH sweep
Broadly in a range between the ATH and the $4k level, so you have to treat it like a range and look for buys at the lows and sell at the highs, no major development in my opinion unless either of the level is broken.
Looking to… pic.twitter.com/lRnnKrZ68W
— Crypto Bully (@BullyDCrypto) September 16, 2025
Crypto Bully also flagged $4,100 to $4,200 as an area of interest. The analyst warned that “invalidation is price acceptance below $4k; if that happens, we’re in for a deeper correction.” For now, conditions remain sideways, with no major breakout in sight.
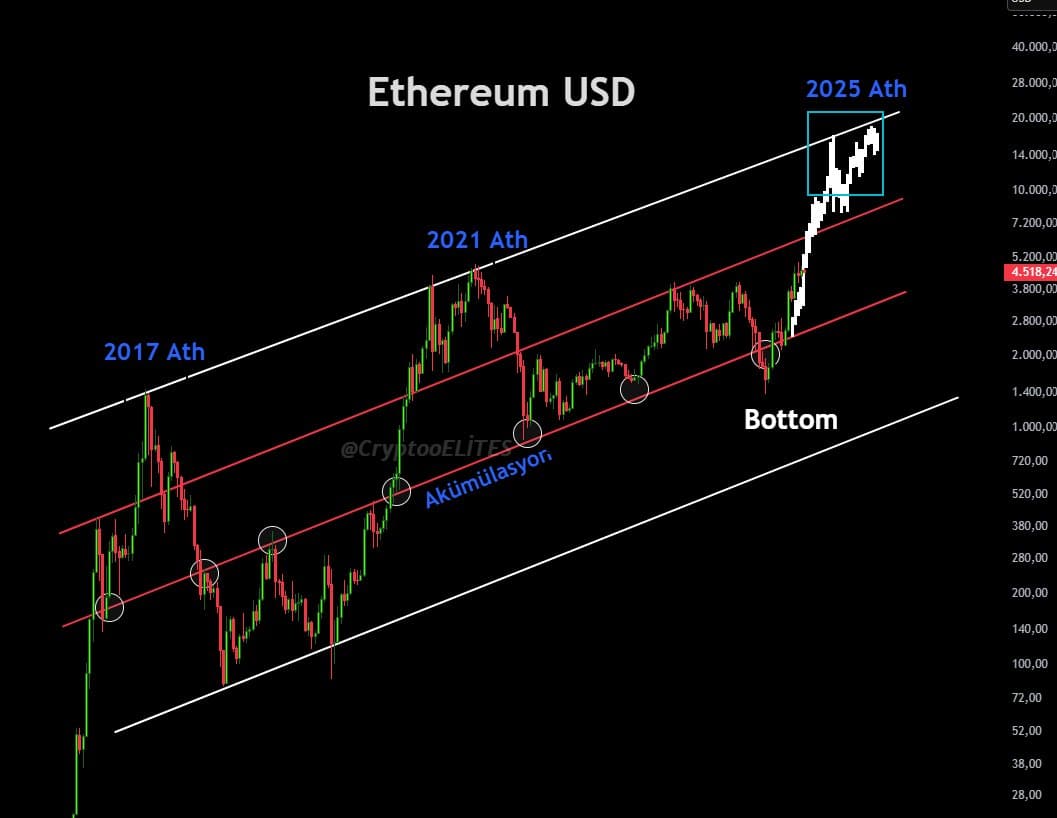
Long-Term Cycle Outlook
CryptoELlTES shared a longer-term chart tracking Ethereum’s price history across cycles. The chart shows ETH hitting the top of a rising channel at the 2017 and 2021 peaks, while cycle lows formed along the lower boundary.
Notably, ETH has recently rebounded from this lower boundary and moved back into the main channel. If the pattern repeats, ETH could be on track for a new ATH in 2025 near the top of the channel. That projection points to a possible range of $15,000 to $20,000, though this depends on whether the channel holds as it has in previous cycles.
Exchange Supply and Open Interest Trends
On-chain data from CryptoQuant shows that the share of ETH held on exchanges has been falling since 2020. The Exchange Supply Ratio has dropped from over 0.30 to about 0.14 this year.
In past cycles, the ratio was much higher and lined up with market peaks. The current cycle is unfolding with the lowest levels on record, pointing to reduced supply on exchanges and more ETH in long-term storage.

Derivatives data adds another layer. Binance ETH open interest (OI) has seen repeated drops over the last three months, averaging 15%. These moves in OI matched spot price corrections of around 11%. This shows that OI trends have been a useful signal for spotting local corrections.
