XRP Primed for Massive Rally: Triangle Breakout Signals Explosive Price Movement Ahead

XRP just shattered a critical technical formation—and traders are positioning for what could be its most significant rally in years.
The Symmetrical Breakout
After weeks of consolidation, XRP finally broke above its descending triangle pattern with conviction. This isn't just another fakeout—volume confirms genuine buyer interest flooding back into the asset.
Market Mechanics at Play
Technical indicators align perfectly: RSI shows room to run before overbought territory, while moving averages flipped from resistance to support. The chart's screaming momentum—not just hopium.
Institutional Tailwinds
While retail traders chase meme coins, smart money accumulates XRP at these levels. The ongoing regulatory clarity—unlike some regulators who still think blockchain is a type of ski binding—creates a perfect storm for upward movement.
Targets in Sight
Previous resistance levels now become launch pads. The measured move from this breakout suggests targets that would make even Bitcoin holders glance over—if traditional finance doesn't screw it up with another 'we're looking into it' announcement.
XRP Price Nears Key Technical Level
XRP is trading around $2.95, positioned NEAR the top of a descending triangle that has formed on the 12-hour chart. The setup shows horizontal support at $2.75 and a downward trendline from late July to early September. The current structure signals a potential breakout as the price presses against resistance.
According to analyst Ali Martinez,
If $XRP breaks out of this descending triangle, the next target is $3.60. pic.twitter.com/KdRlXLbog0
— Ali (@ali_charts) September 9, 2025
Fibonacci levels between $3.10 and $3.40 show possible checkpoints before the price reaches that level. These areas could act as temporary resistance if the breakout continues. A brief retest near $3.00 could follow, based on historical chart behavior.
Meanwhile, failure to break above the triangle could send the ассет back toward $2.75. A move below $2.65 WOULD cancel the bullish setup.
Market Still Lacks Strong Confirmation
Technical analyst CRYPTOWZRD reported that XRP’s daily candle closed without a clear direction.
“We will have to wait for the next healthy price action to get the next mature chart formation,” he noted.
The daily chart shows XRP trading just above the lower-high trendline, but the MOVE lacks volume confirmation.
They would monitor the chart for entries above $3.13, with an earlier possibility near $3.05 if the market shows signs of stability. The analyst also confirmed that his current position is already secured.
Lower time frames showed inconsistent momentum during the day, and further moves depend on clean structure and volume. Without it, new positions remain on hold.
Futures Traders Position for Movement
Data from Coinglass shows that XRP Futures Open Interest stands at $7.94 billion. This is a sharp increase compared to earlier months, where figures stayed below $2 billion. The rise reflects strong participation from derivatives traders.
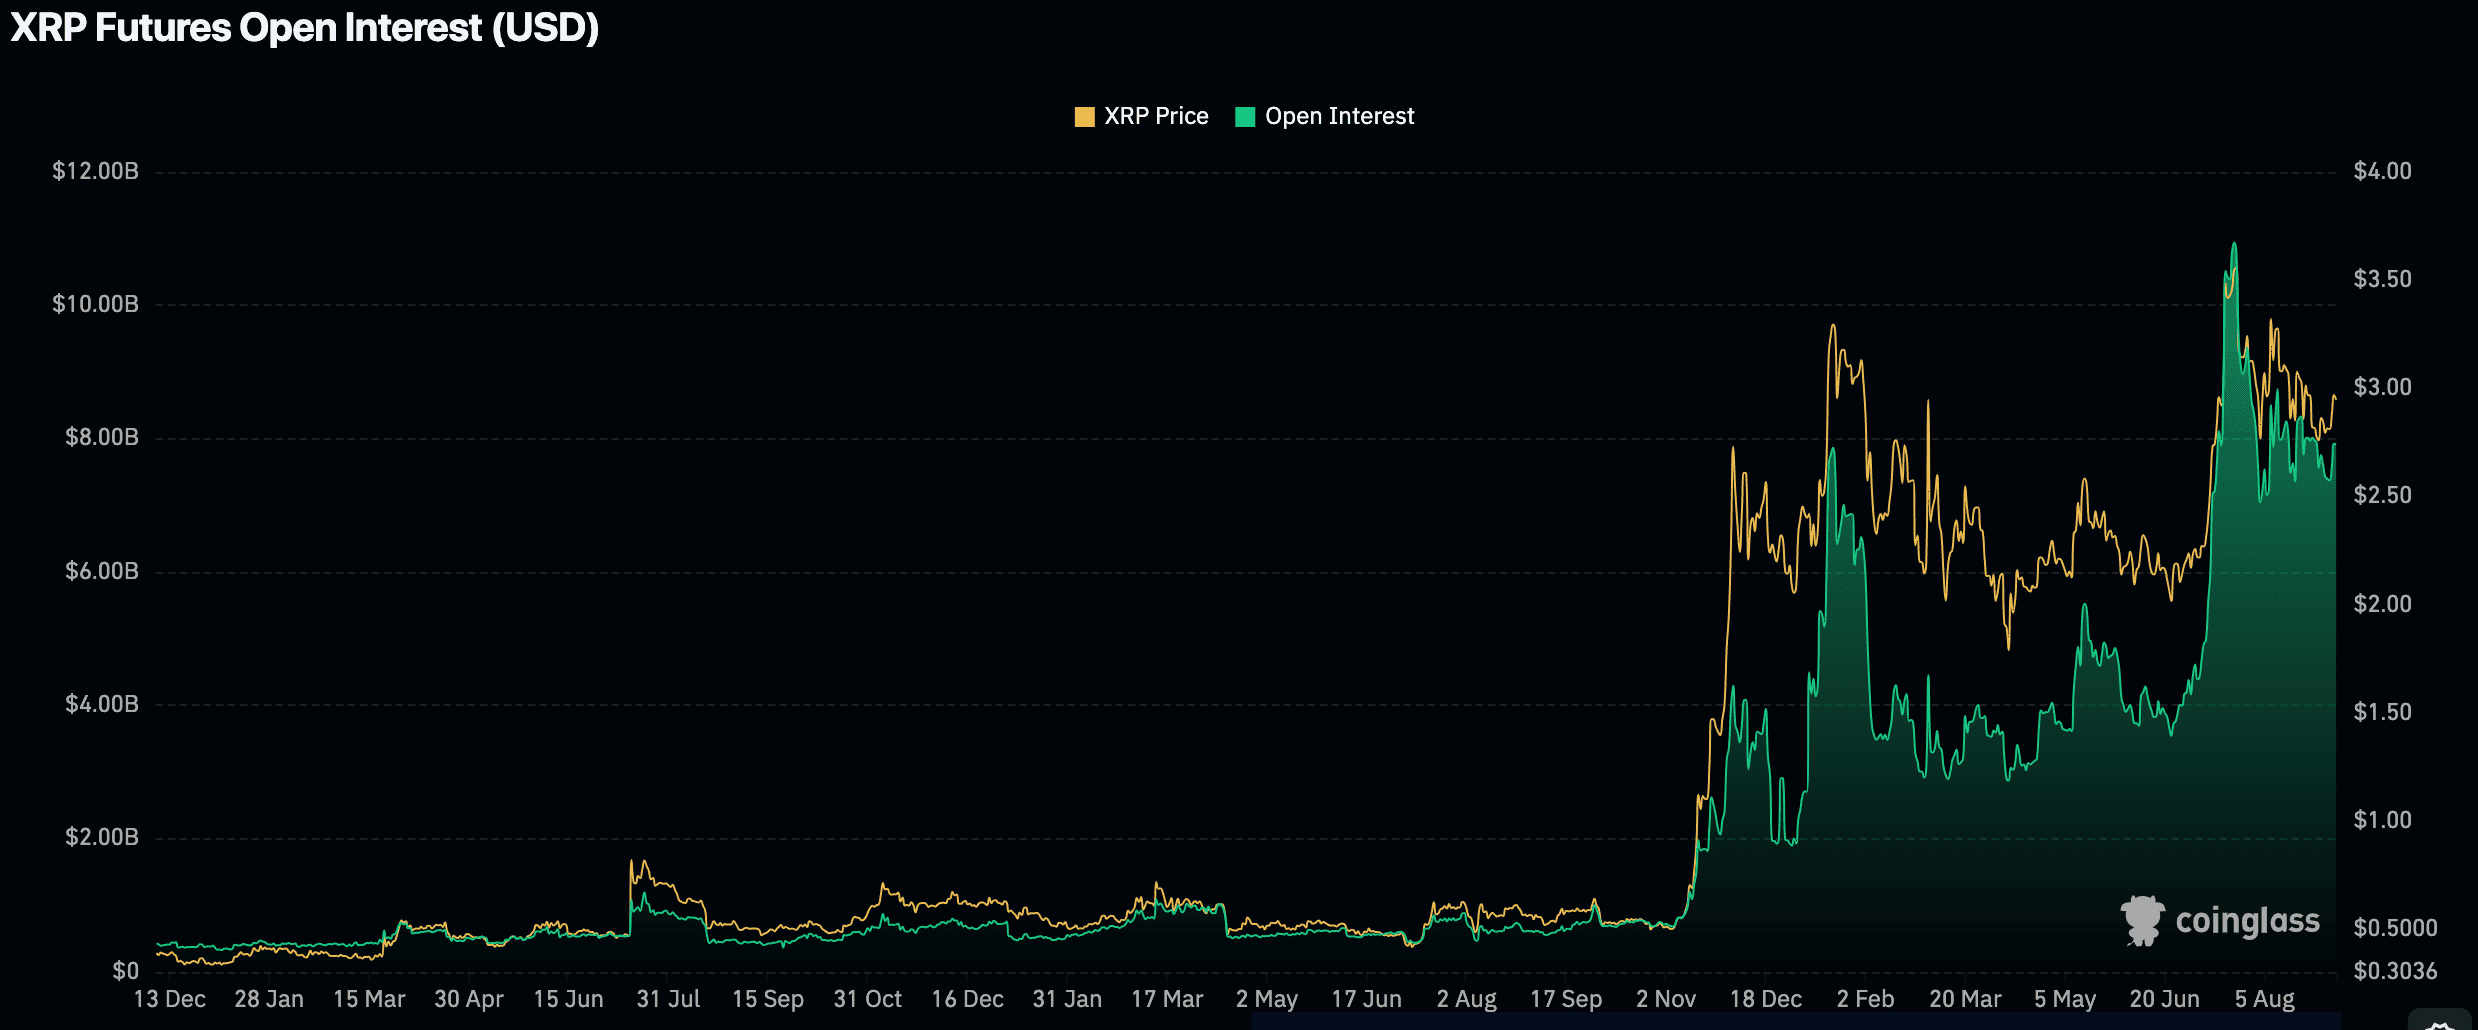
A spike in open interest shows many contracts remain active, but it does not indicate direction. It does show that traders are preparing for volatility after an extended quiet period in price action.
Trader Galaxy commented,
“Pure consolidation for over 280 days in the $2-3 range, and running out of space to compress.”
The chart shows XRP has moved mostly sideways within this zone since late last year.
Notably, this compression near resistance and rising open interest are signals that traders are watching for a breakout. The next few sessions will be critical as price tests the upper edge of the triangle.
