Bitcoin Price Analysis: Is This BTC’s Calm Before Another Major Storm?

Bitcoin's eerie silence sparks speculation among traders—is the king of crypto gathering strength for its next explosive move?
The Lull Before the Storm
BTC's price action has flatlined at levels that would normally trigger panic or euphoria. Instead, markets hover in deceptive tranquility. Trading volumes suggest institutional players are accumulating rather than exiting—a classic set-up for volatility explosions.
Technical indicators flash contradictory signals. RSI lingers in neutral territory while Bollinger Bands tighten to whisper-thin margins. History shows these compression phases rarely end quietly. When Bitcoin coils this tight, it typically springs with violent intent.
Market participants watch whale wallets and derivatives data for clues. Open interest builds quietly in options markets—smart money positioning for a decisive breakout. The only question remains: which direction?
Traditional finance pundits dismiss the calm as 'lack of institutional interest'—a charmingly outdated perspective from people who still think bond yields matter in a digital asset revolution. Meanwhile, Bitcoin's network fundamentals scream accumulation phase.
This isn't stability—it's a loaded spring waiting for a catalyst. When it triggers, the move will leave latecomers chasing shadows and Wall Street analysts scrambling to justify their outdated models.
The Daily Chart
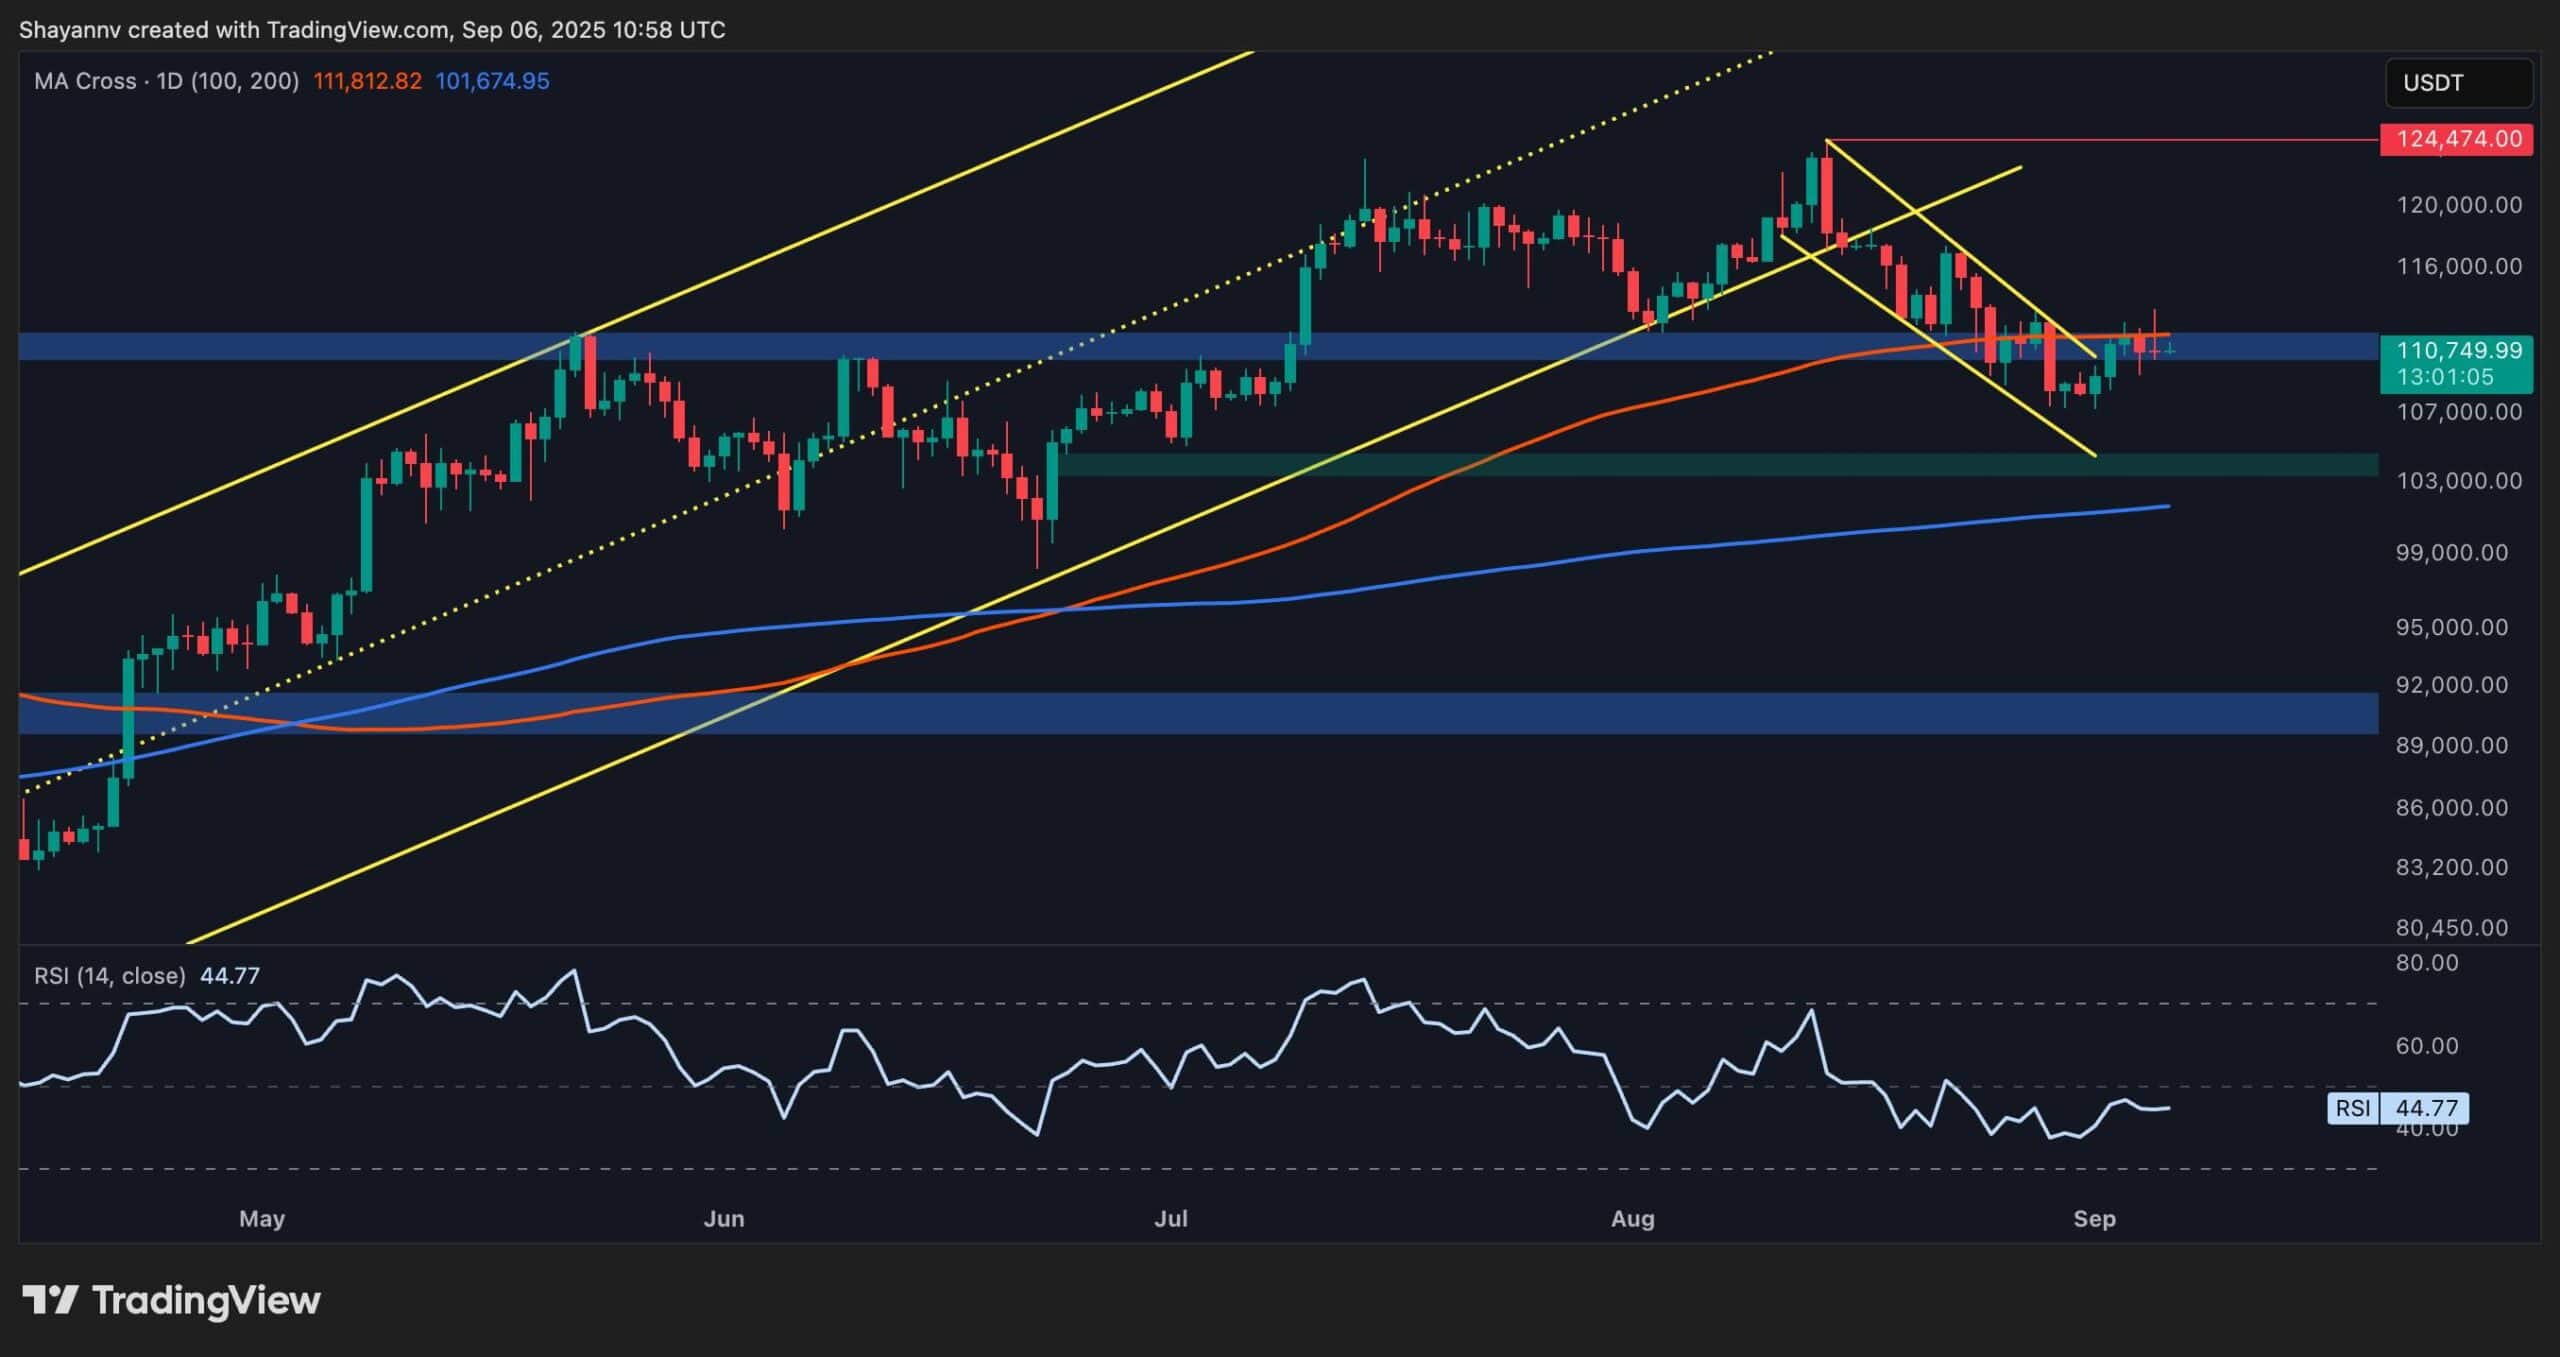
On the daily timeframe, BTC has broken below its ascending channel but found support NEAR the $110K region, which aligns closely with the 100-day moving average. The RSI sits around 44, showing that momentum is weak but not in oversold conditions yet. This suggests that the market is in a pause phase, waiting for either a rebound confirmation or a deeper retracement.
If the buyers defend $110K successfully, the next resistance sits at $116K and then the $124K record high. However, a breakdown below $110K could extend the decline toward the $104K demand zone, which has acted as a strong base in the past.
The 4-Hour Chart
On the 4-hour chart, Bitcoin broke out of a steep descending channel but is now moving within a smaller rising channel. Price is currently retesting the $110K–$111K zone, which has become the key short-term pivot. The RSI is balanced around 49, reflecting market indecision and a lack of clear momentum.
If this support zone holds, a push toward $114K is likely, where sellers could step in again. On the other hand, a clean drop below $109K WOULD invalidate the short-term bullish structure and open the way for a deeper move toward the $104K demand zone previously mentioned.

Onchain Analysis
Exchange Reserve
Exchange reserves continue to show a sharp and consistent decline, reaching multi-year lows. This indicates that more bitcoin is moving off exchanges into cold storage, a clear sign of long-term accumulation and reduced sell-side supply. Historically, such drawdowns in reserves have supported bullish trends, even during corrective phases.
The steady outflow suggests that despite short-term volatility, investor conviction remains high. With fewer coins available on exchanges, the supply shock narrative strengthens, which could support a bullish reversal once demand picks up again.

