Ethereum Faces Critical Test: Will This Rejection Derail ETH’s Bull Run?

Ethereum bulls hit a wall as rejection signals flash red—again. The $4,000 psychological barrier proves tougher than expected, threatening to snap ETH's impressive momentum.
Technical Breakdown: Key Levels Under Pressure
Support at $3,800 is now make-or-break territory. A break below could trigger cascading liquidations—just like traditional markets love to overreact. Volume patterns suggest institutional hesitation, while retail traders keep chasing the dragon of previous all-time highs.
Market Psychology: Greed Meets Reality
Traders who missed Bitcoin's run are piling into ETH hoping for second-best returns. Classic FOMO behavior—because nothing says 'smart money' like chasing 20% gains after 150% run-ups. The real test comes when leverage gets flushed from the system.
Long-term holders aren't sweating—yet. Network fundamentals remain robust, and the merge continues delivering efficiency gains. But short-term, technicals rule. If ETH can't hold this line, even the most bullish narratives won't stop the slide.
Because in crypto, fundamentals are what you cite while watching price charts. Typical finance—where 'long-term vision' means until next week's Fed meeting.
Technical Analysis
By Shayan
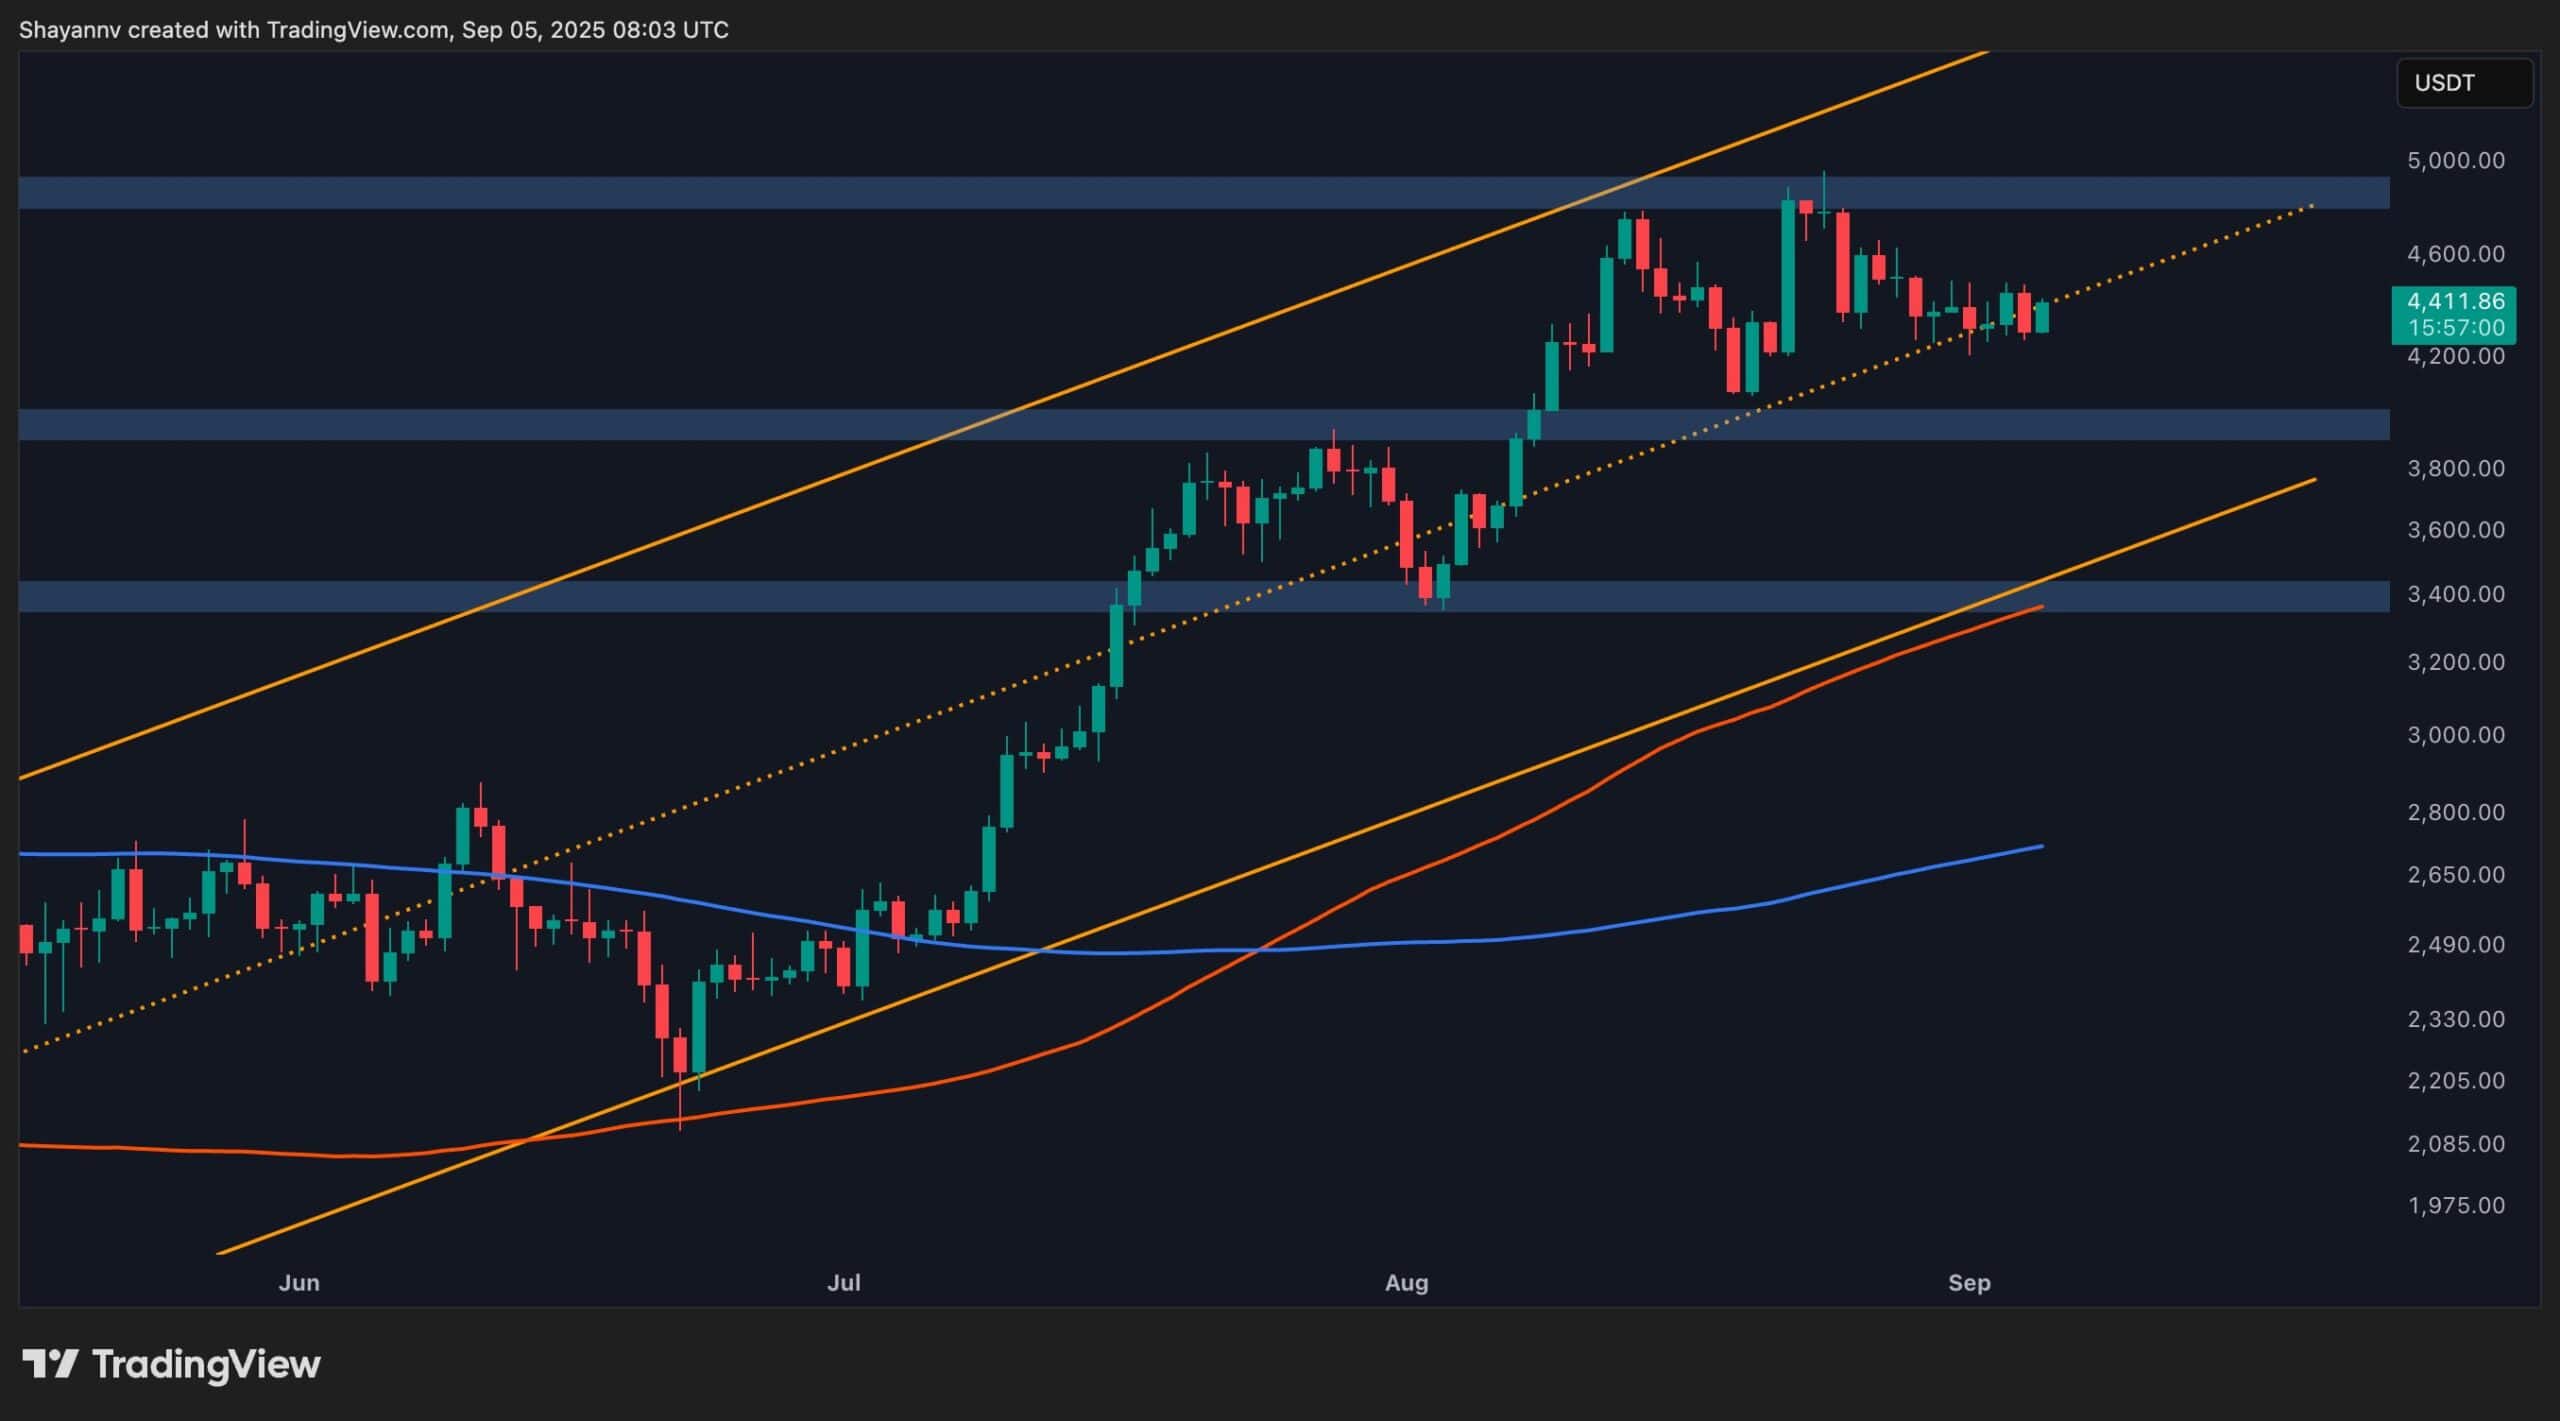
The Daily Chart
On the daily timeframe, ETH remains within its long-standing ascending channel. After pulling back from the upper boundary NEAR $4.9K, the price is now consolidating around the mid-range support.
As long as ethereum holds above the dotted trendline and the $4.2K–$4.3K support region, the broader bullish channel structure remains intact. Losing this area, however, would expose the $3.8K support zone, where deeper demand sits. On the upside, bulls must regain momentum and drive price back toward the channel’s upper boundary to reassert control and target fresh highs.
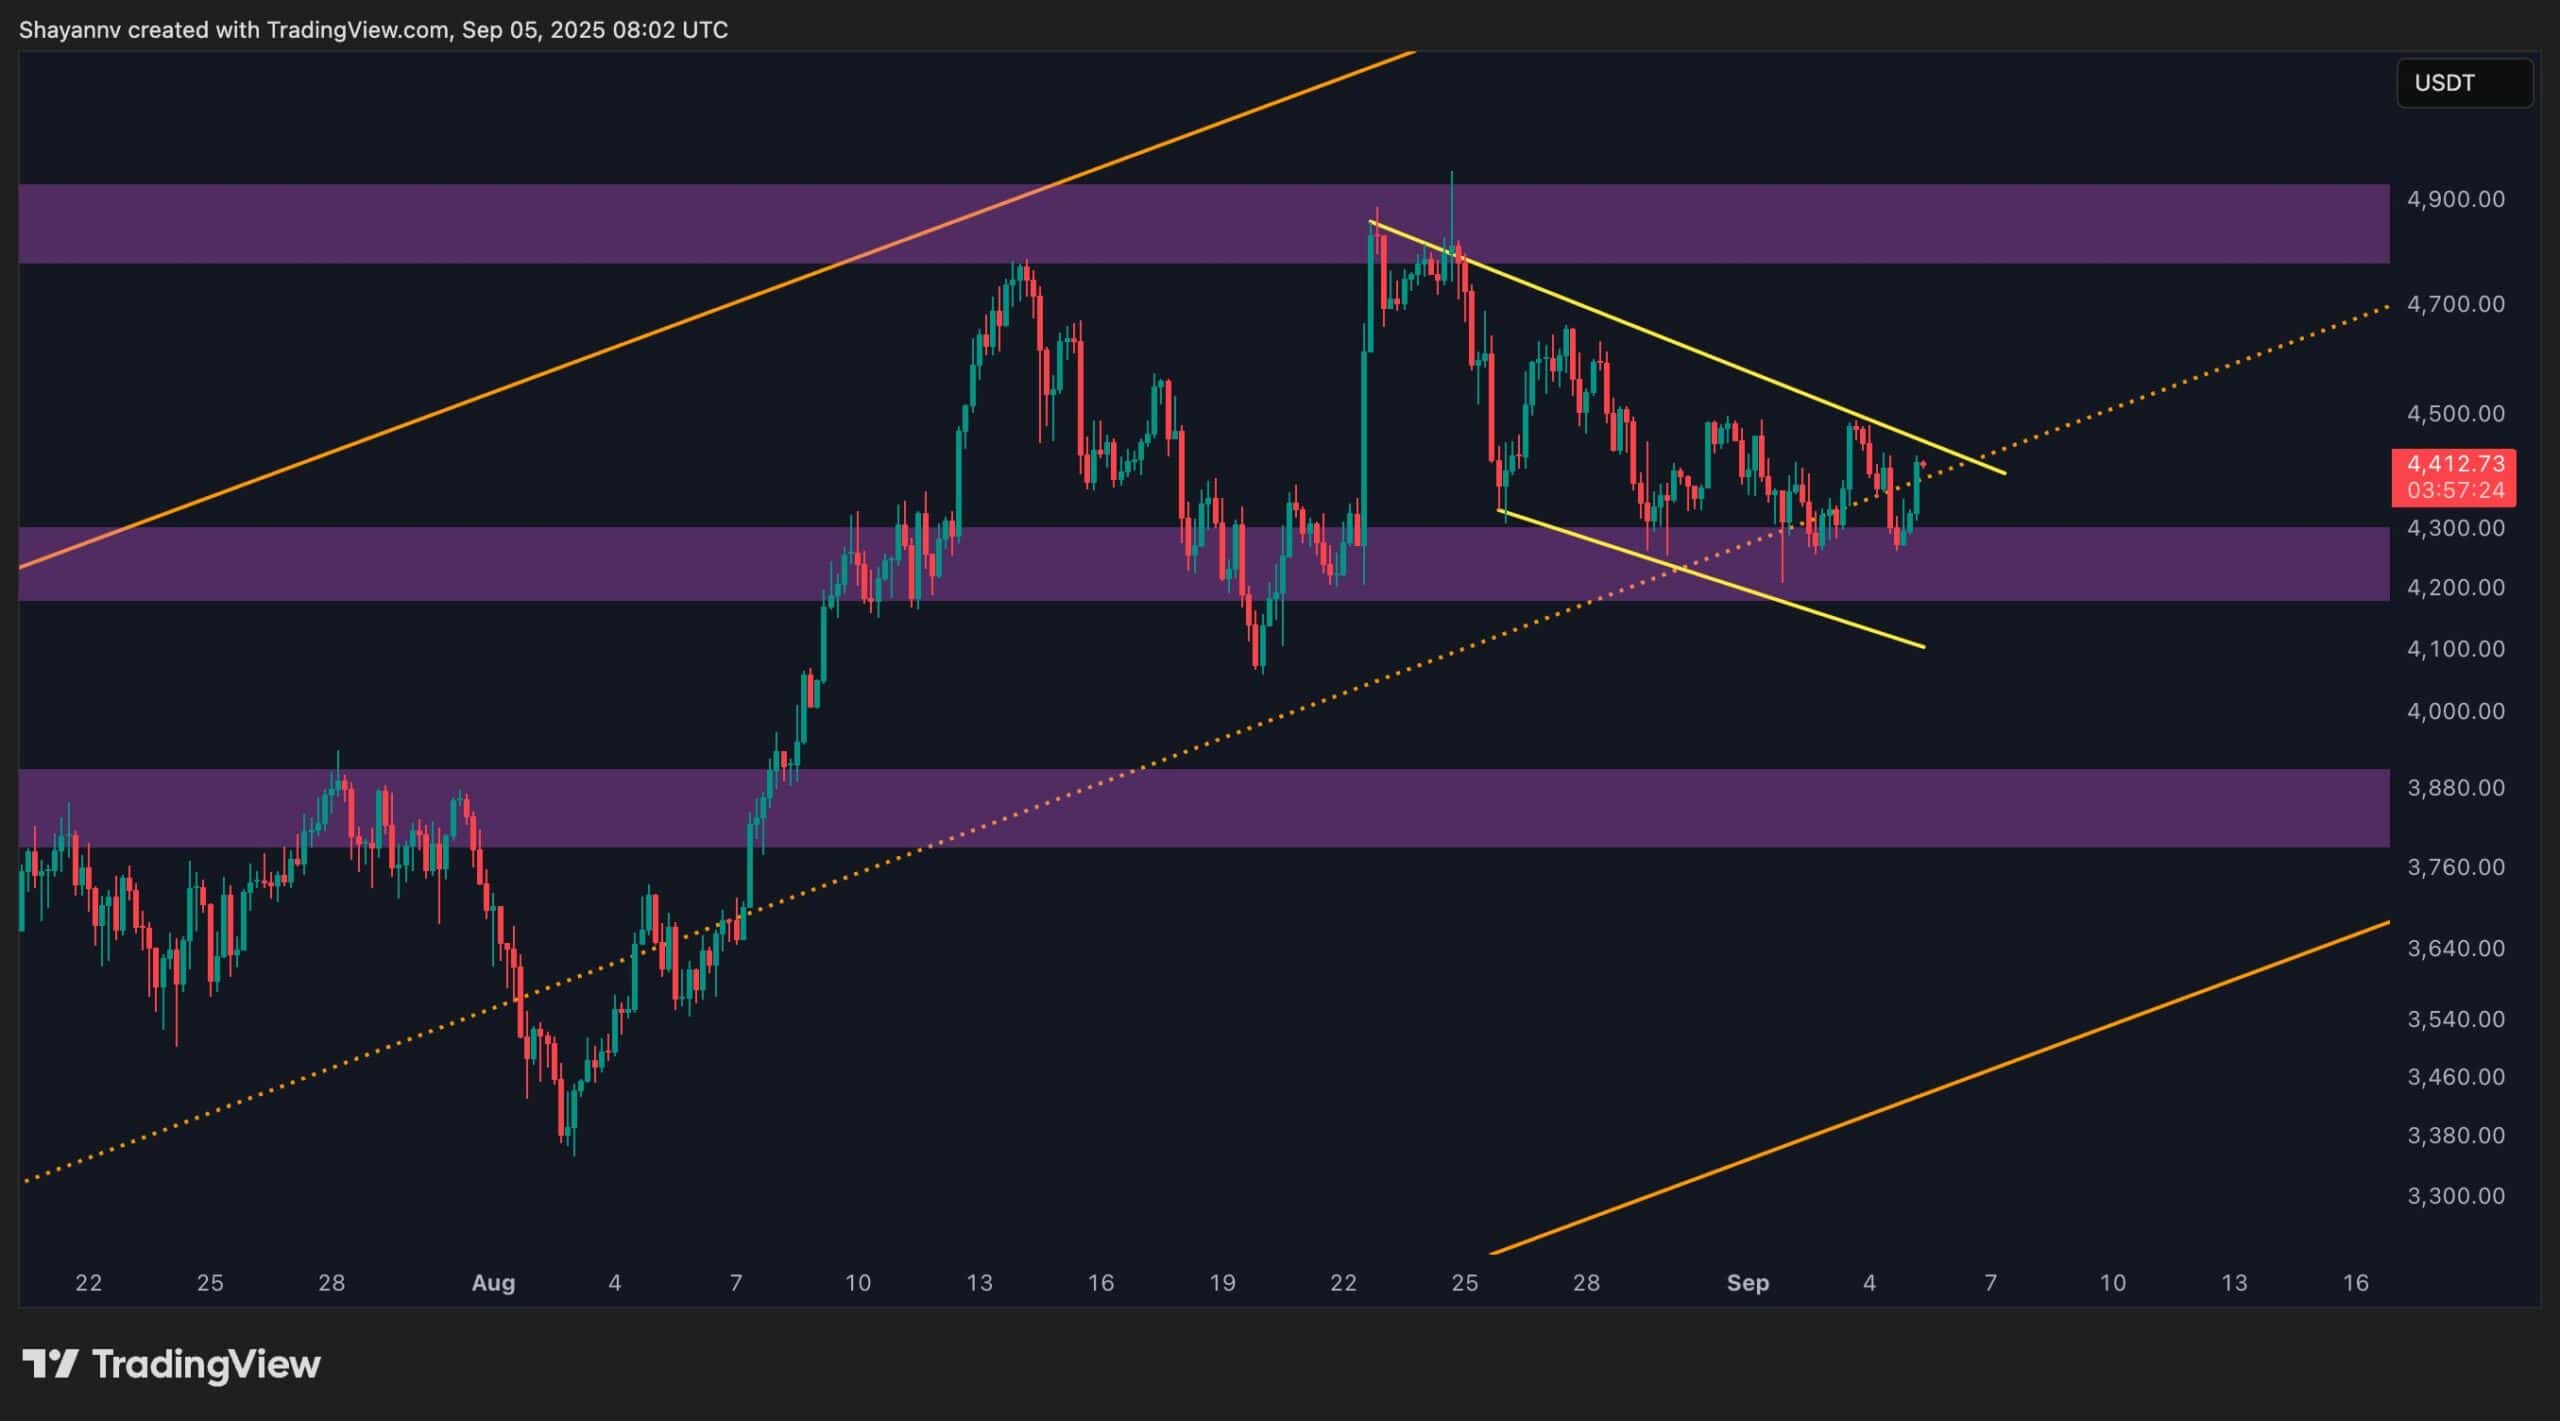
The 4-Hour Chart
The 4-hour chart makes the compression more evident. Following the sharp rejection near $4.9K, Ethereum has been trading within a descending channel (marked in yellow), while repeatedly finding demand around the $4.2K support block.
The asset is currently testing the upper boundary of this descending channel. A confirmed breakout WOULD likely open the path toward $4.6K–$4.7K, while another rejection would keep ETH locked in the short-term range, leaving the market vulnerable to a retest of lower supports around $3.8K.
Onchain Analysis
By Shayan
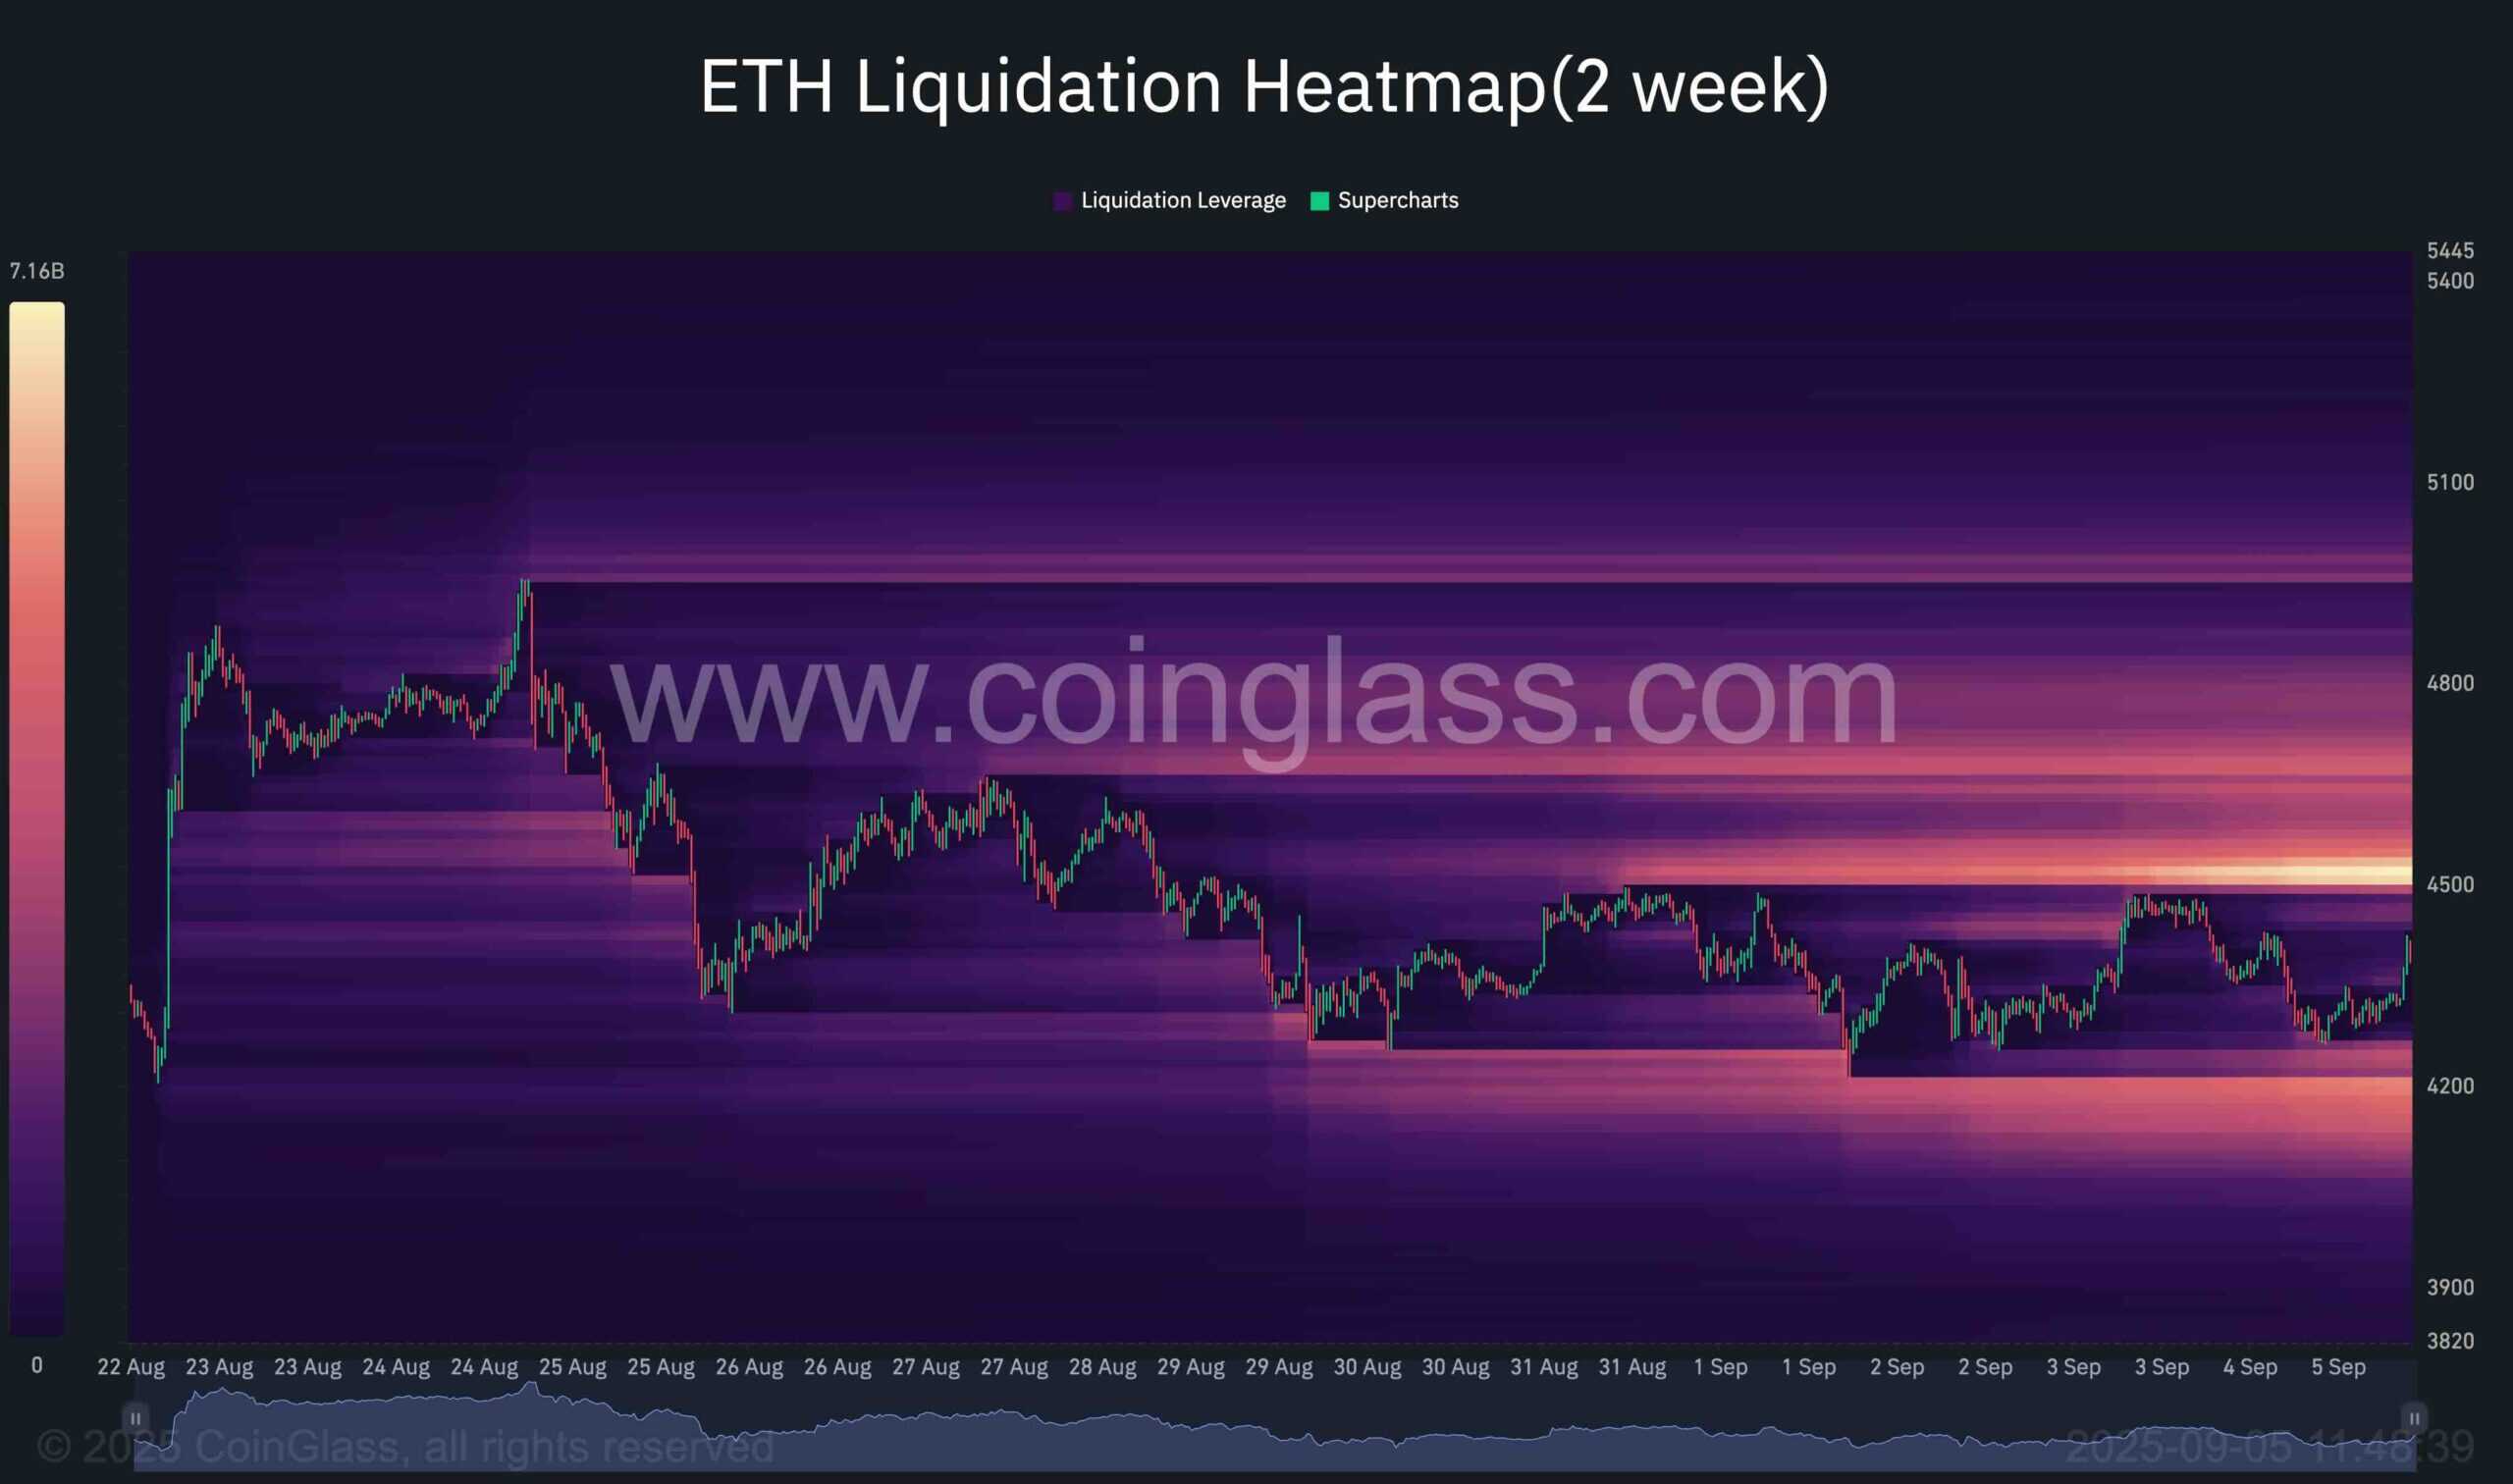
The 2-week ETH/USDT liquidation heatmap highlights a market caught in compression, with dense liquidity clusters forming on both sides of the current price. This balanced yet fragile setup underscores the risk of a liquidity-driven breakout in either direction.
On the upside, a significant band of short liquidations sits above $4,500, extending into the $4,500–$4,600 zone. A clean break through resistance here could ignite a wave of forced short covers, fueling a sharp rally higher.
On the downside, equally heavy concentrations of long liquidations are visible around $4,200 and lower toward $4,000. A failure to hold the $4,200 base could trigger a cascade of liquidations, accelerating downside volatility into the next major support.
Overall, ETH is consolidating inside a compressed range, with Leveraged positions stacked at both extremes. The $4,200 and $4,500 levels now act as critical trigger zones, and whichever side breaks first is likely to dictate the next decisive move. Until then, traders should remain cautious, as the market remains vulnerable to liquidity hunts and false breakouts.