Ripple (XRP) Price Predictions for This Week: Key Levels to Watch

XRP bulls eye critical resistance as regulatory clouds show signs of lifting—but will institutional flows follow the hype?
Technical Breakout or Fakeout?
Ripple's native token tests a make-or-break zone around the $0.55 mark. Traders watch for a sustained close above this level to confirm upward momentum. Failure here could see a retest of support near $0.48.
Volume Tells the Real Story
Spot volumes remain tepid despite positive legal developments. Until whale activity picks up or ETF chatter resurfaces, expect sideways action with occasional volatility spikes.
The Institutional Wait-and-See
Hedge funds still treat most altcoins as casino chips—XRP included. Real money moves require clearer regulatory frameworks, not just courtroom wins.
Short-term speculators might chase the headline pump, but smart money remembers how quickly crypto narratives flip. This week's price action hinges more on Bitcoin's mood than Ripple's fundamentals.
Ripple (XRP) Price Predictions: Analysis
1. XRP Makes a Lower Low
XRP ended August in a downtrend that took the price to the key support at $2.7, which became a multi-week low. With a lower low confirmed, the current downtrend is likely to continue. However, buyers still have a chance to stop the price at this crucial support since they showed interest when this level was tested on Tuesday.

2. Momentum Remains Bearish
With volume falling, only a strong return from buyers can reverse the existing bearish momentum. In the past few weeks, sellers have dominated on volume and price, which has created a large descending triangle with a base at $2.7. By mid-September, XRP will likely decide where it will go next. If lower, there is strong support at $2.5.
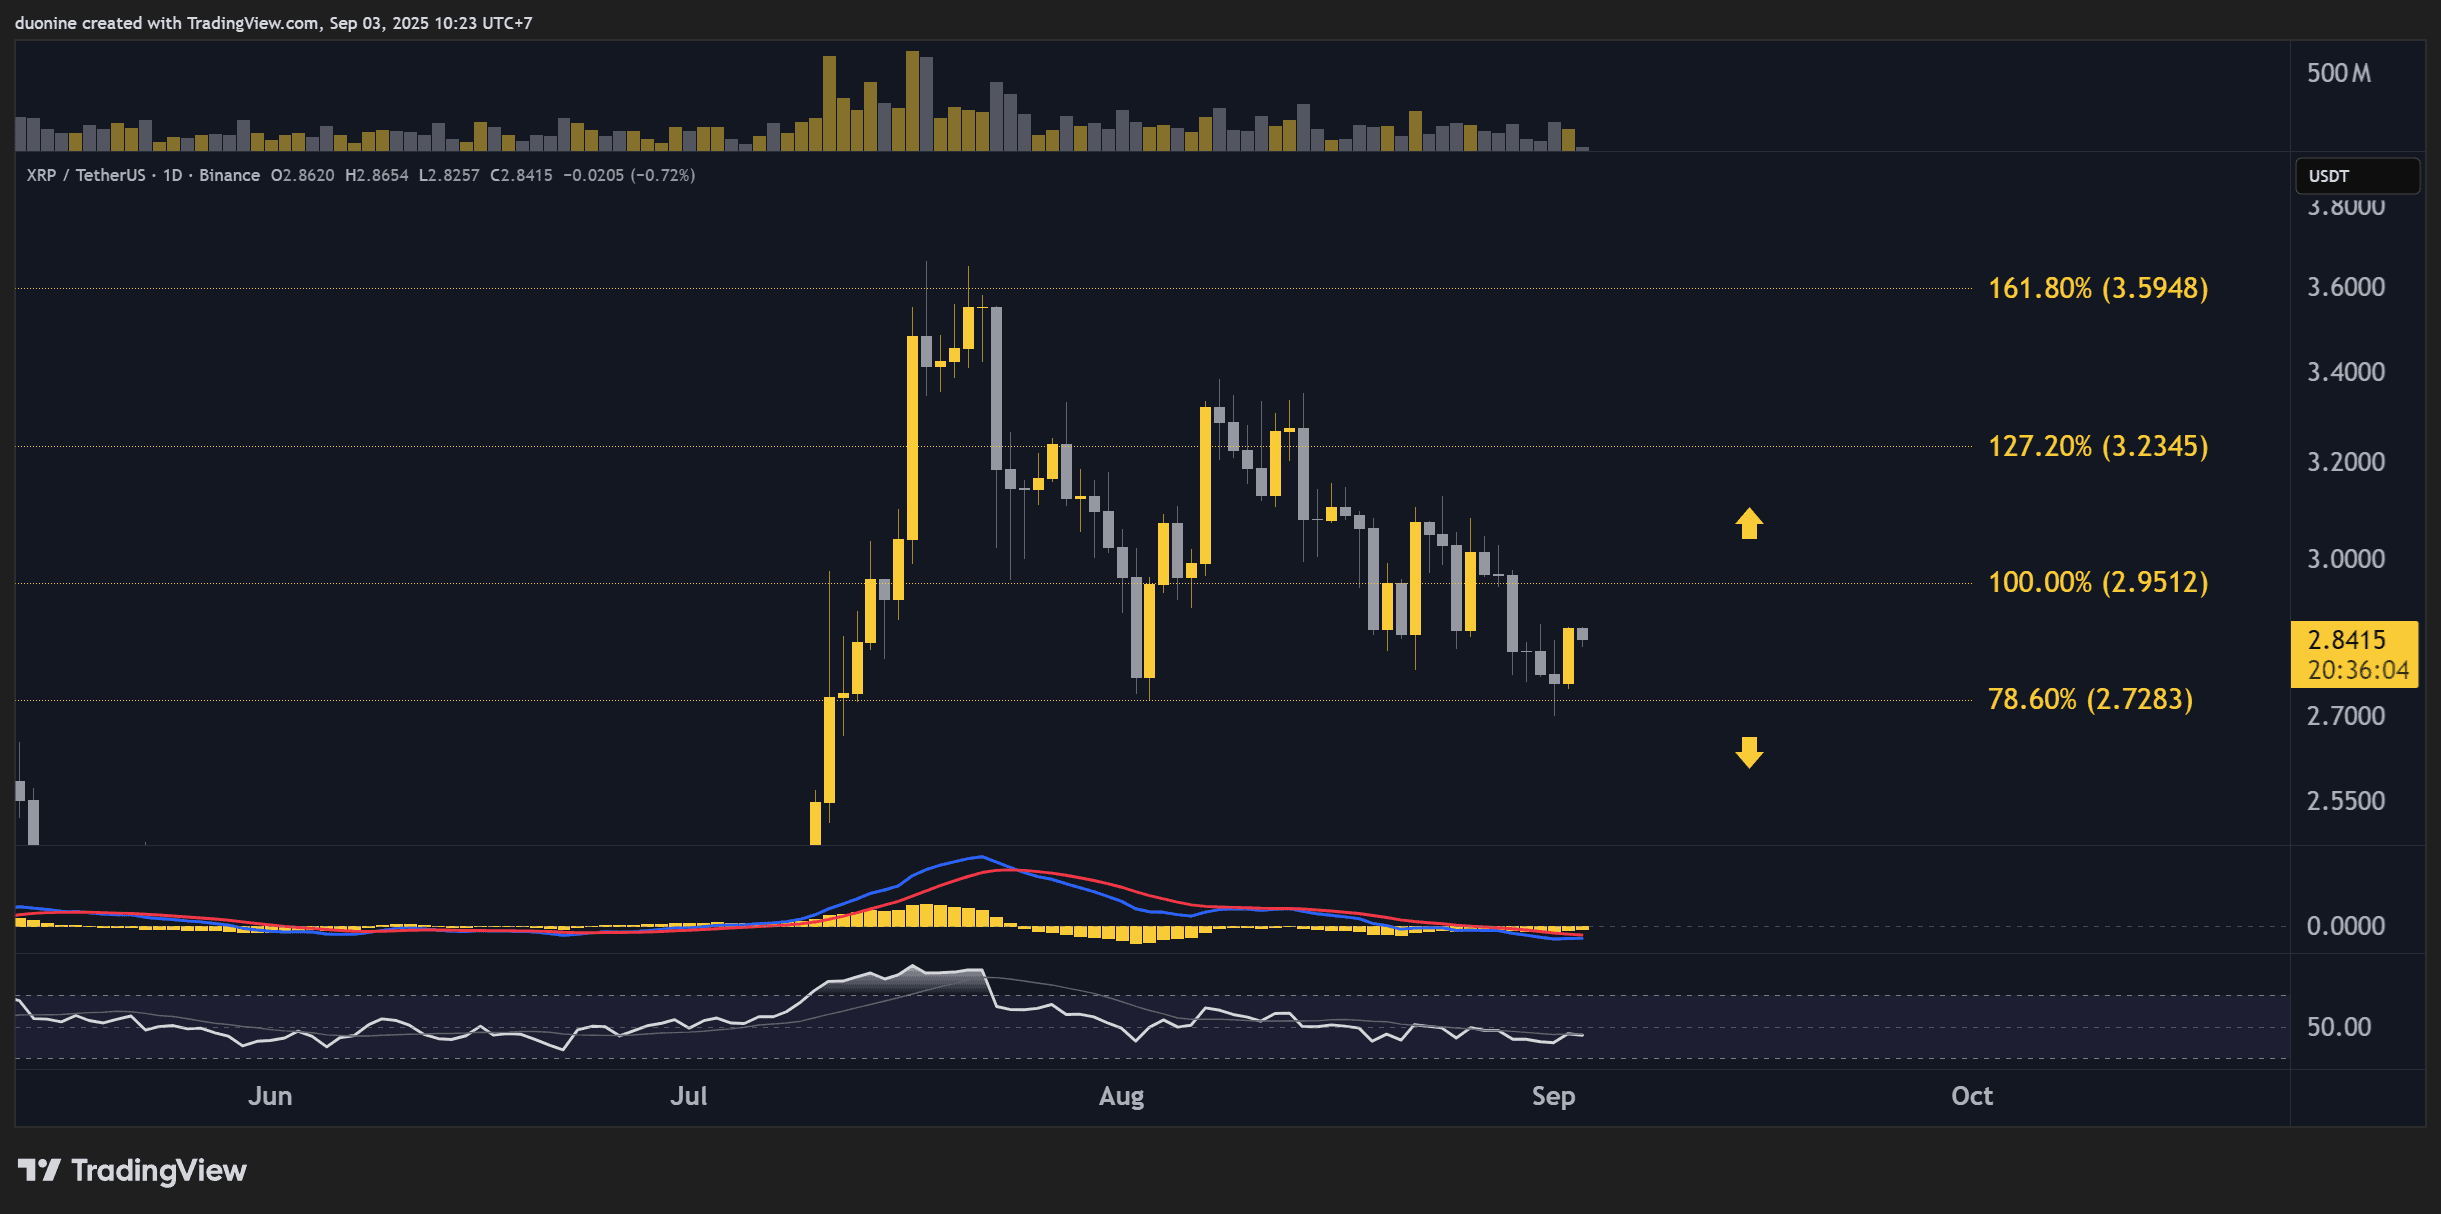
3. MACD Lower Highs
On the weekly timeframe, the MACD shows a clear bearish trend with lower highs and falling momentum. It WOULD be quite impressive to see XRP reverse this selling pressure, considering the MACD moving averages have been on the verge of a second bearish cross since February.

