Ethereum at Critical Juncture: Will This Define ETH’s Bull Market Trajectory?

Ethereum stands at a make-or-break moment—price action this week could determine whether the bull run continues or stalls out.
Technical Tension Builds
ETH's chart shows consolidation near key resistance levels. Traders watch for either a decisive breakout or rejection—both carrying significant implications for medium-term momentum.
Market Sentiment Hangs in Balance
Institutional flows remain cautiously optimistic while retail FOMO hasn't yet kicked into overdrive. The usual suspects on Crypto Twitter either predict new ATHs or warn of an impending 'rug pull'—because apparently nobody believes in moderate outcomes anymore.
Macro Factors Loom Large
Broader crypto market sentiment, regulatory whispers, and those ever-so-predictable Fed comments continue to sway ETH's fate. Because nothing says 'decentralized future' like hanging on every word from central bankers.
Volume and volatility indicators suggest something's brewing. Whether it's a launchpad to new highs or a trap door lower—this week likely delivers the answer.
ETH Price: Technical Analysis
By Shayan
The Daily Chart
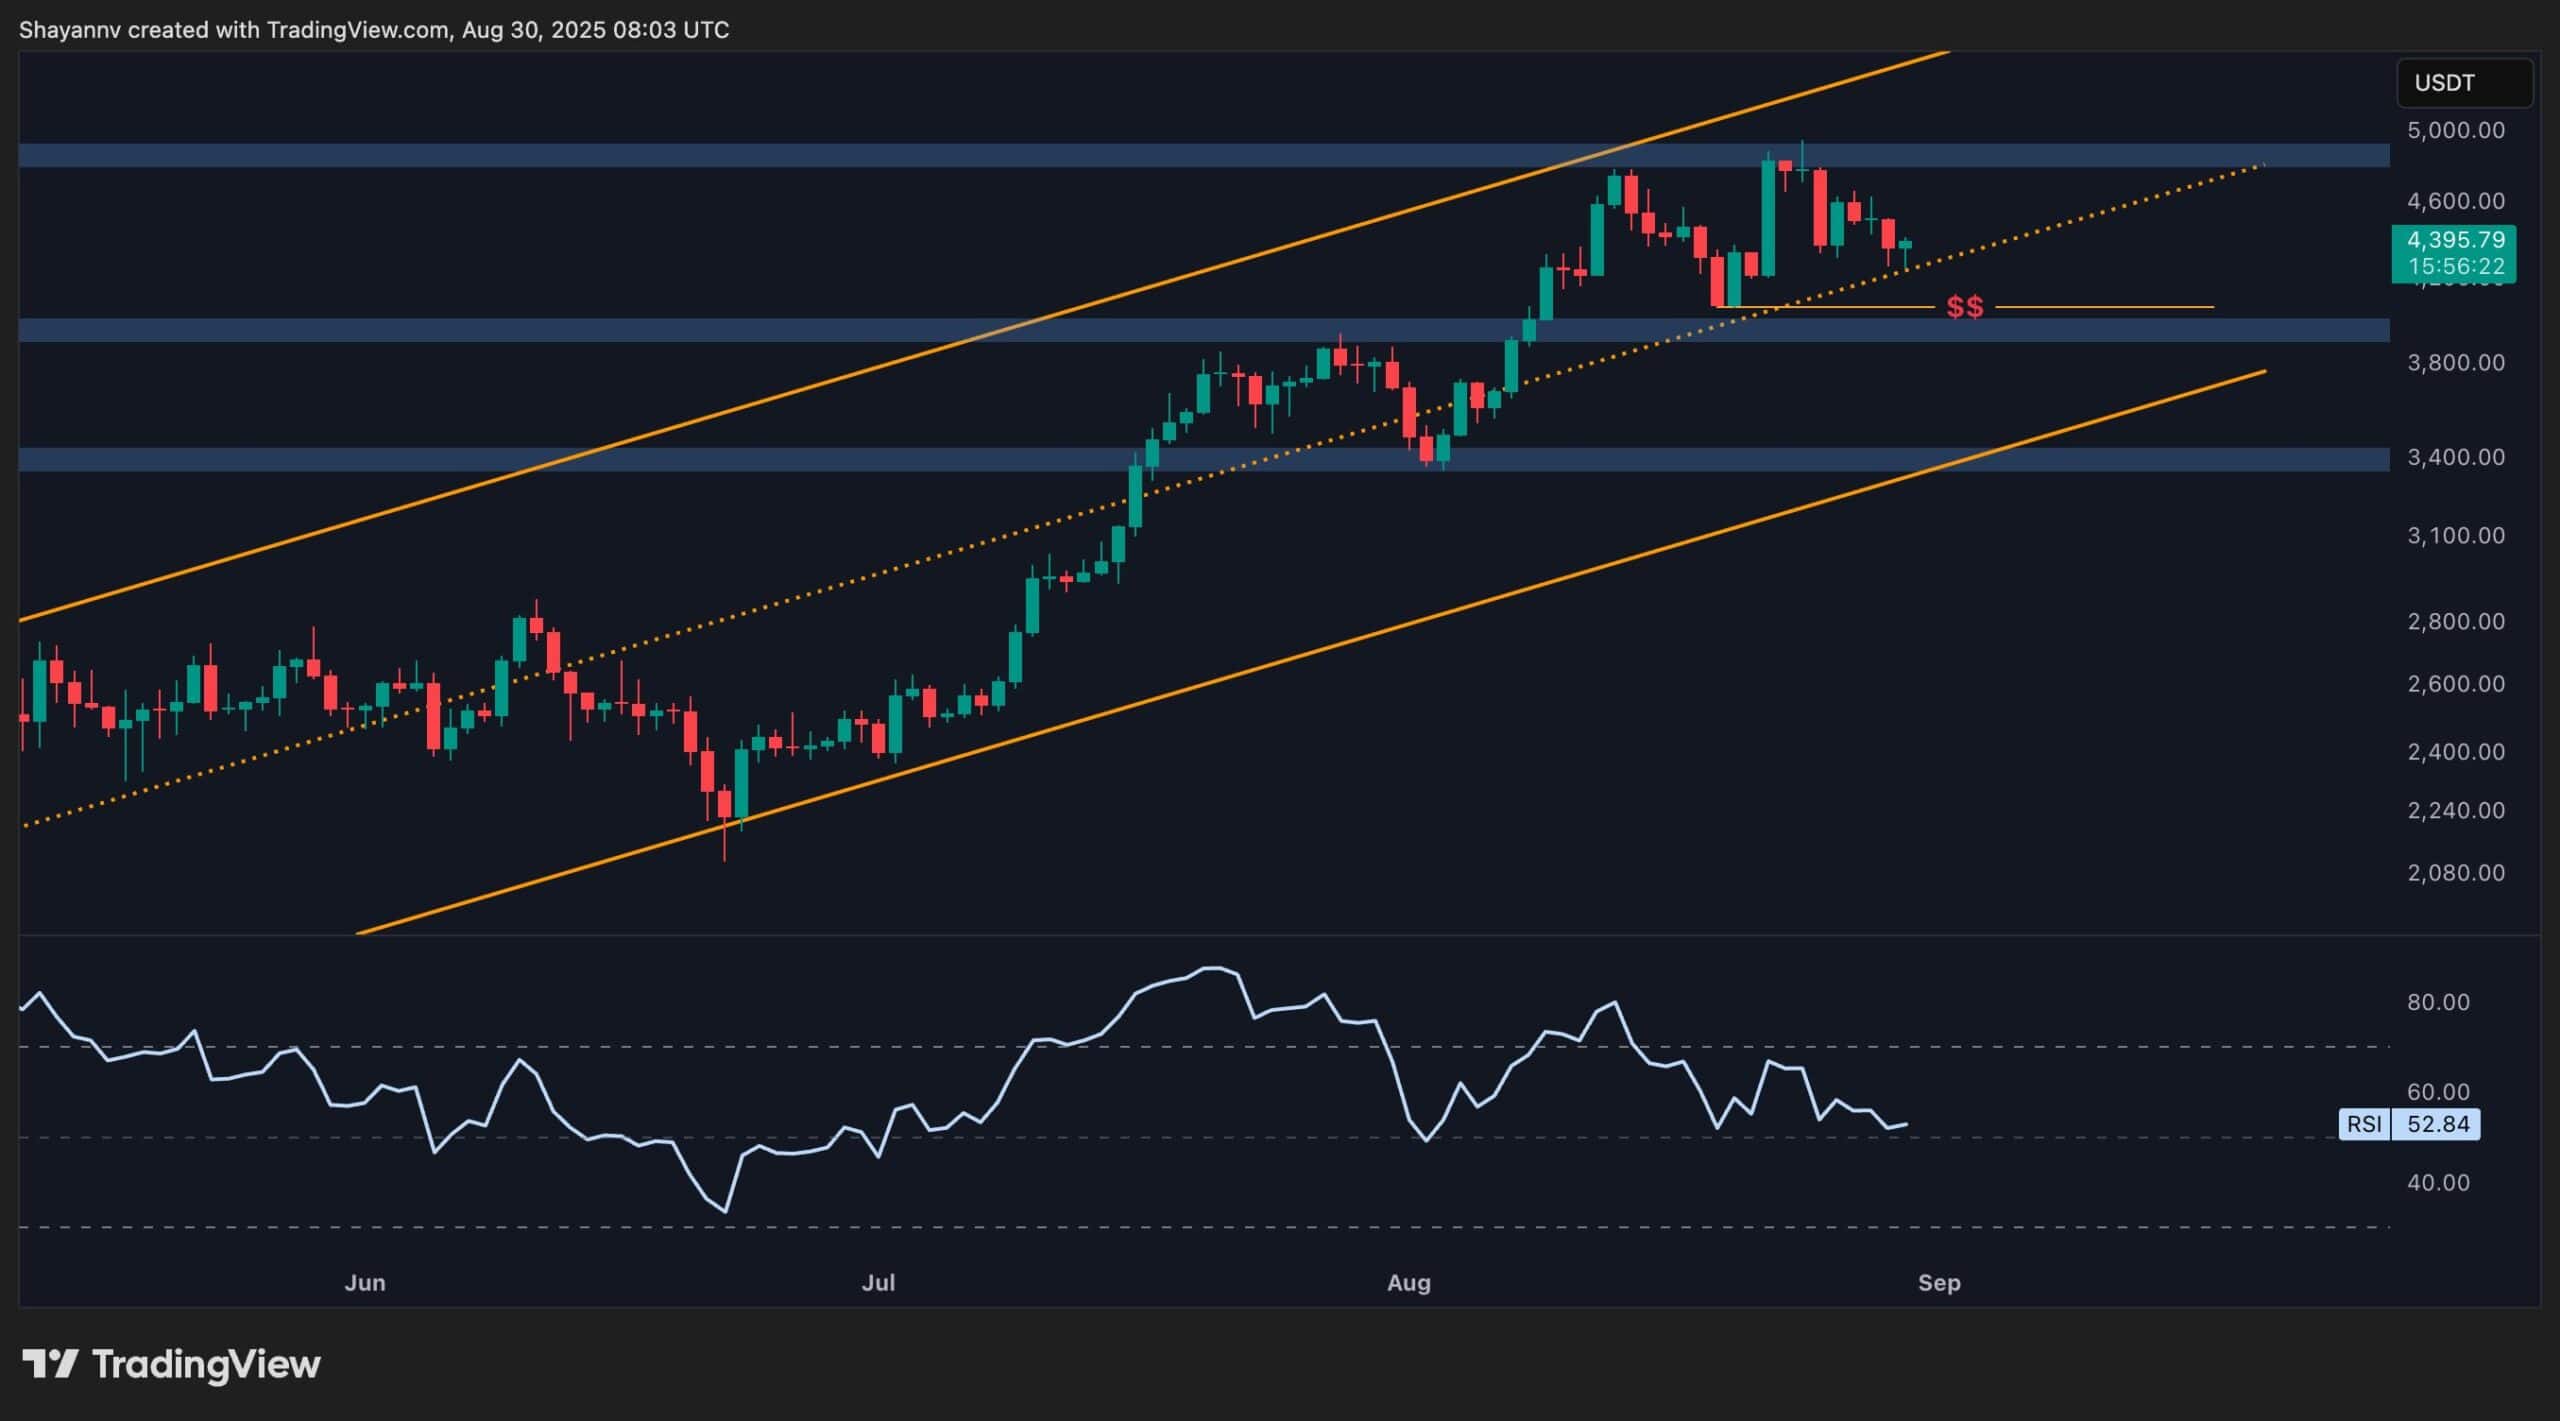
On the daily chart, ETH continues to trade within its ascending channel, though momentum has clearly weakened following the rejection at the channel’s upper boundary. The asset has now pulled back toward the midline support around $4.2K, which has repeatedly acted as a key demand zone.
The RSI has declined to around 52, reflecting cooling bullish strength and growing equilibrium between buyers and sellers. A decisive break below $4.2K WOULD likely expose the $3.8K region, which overlaps with the sell-side liquidity pocket and prior consolidation levels.
Conversely, if buyers hold this level, ETH could consolidate before mounting another attempt toward the $4.8K resistance zone, keeping the broader bullish structure intact.
The 4-Hour Chart
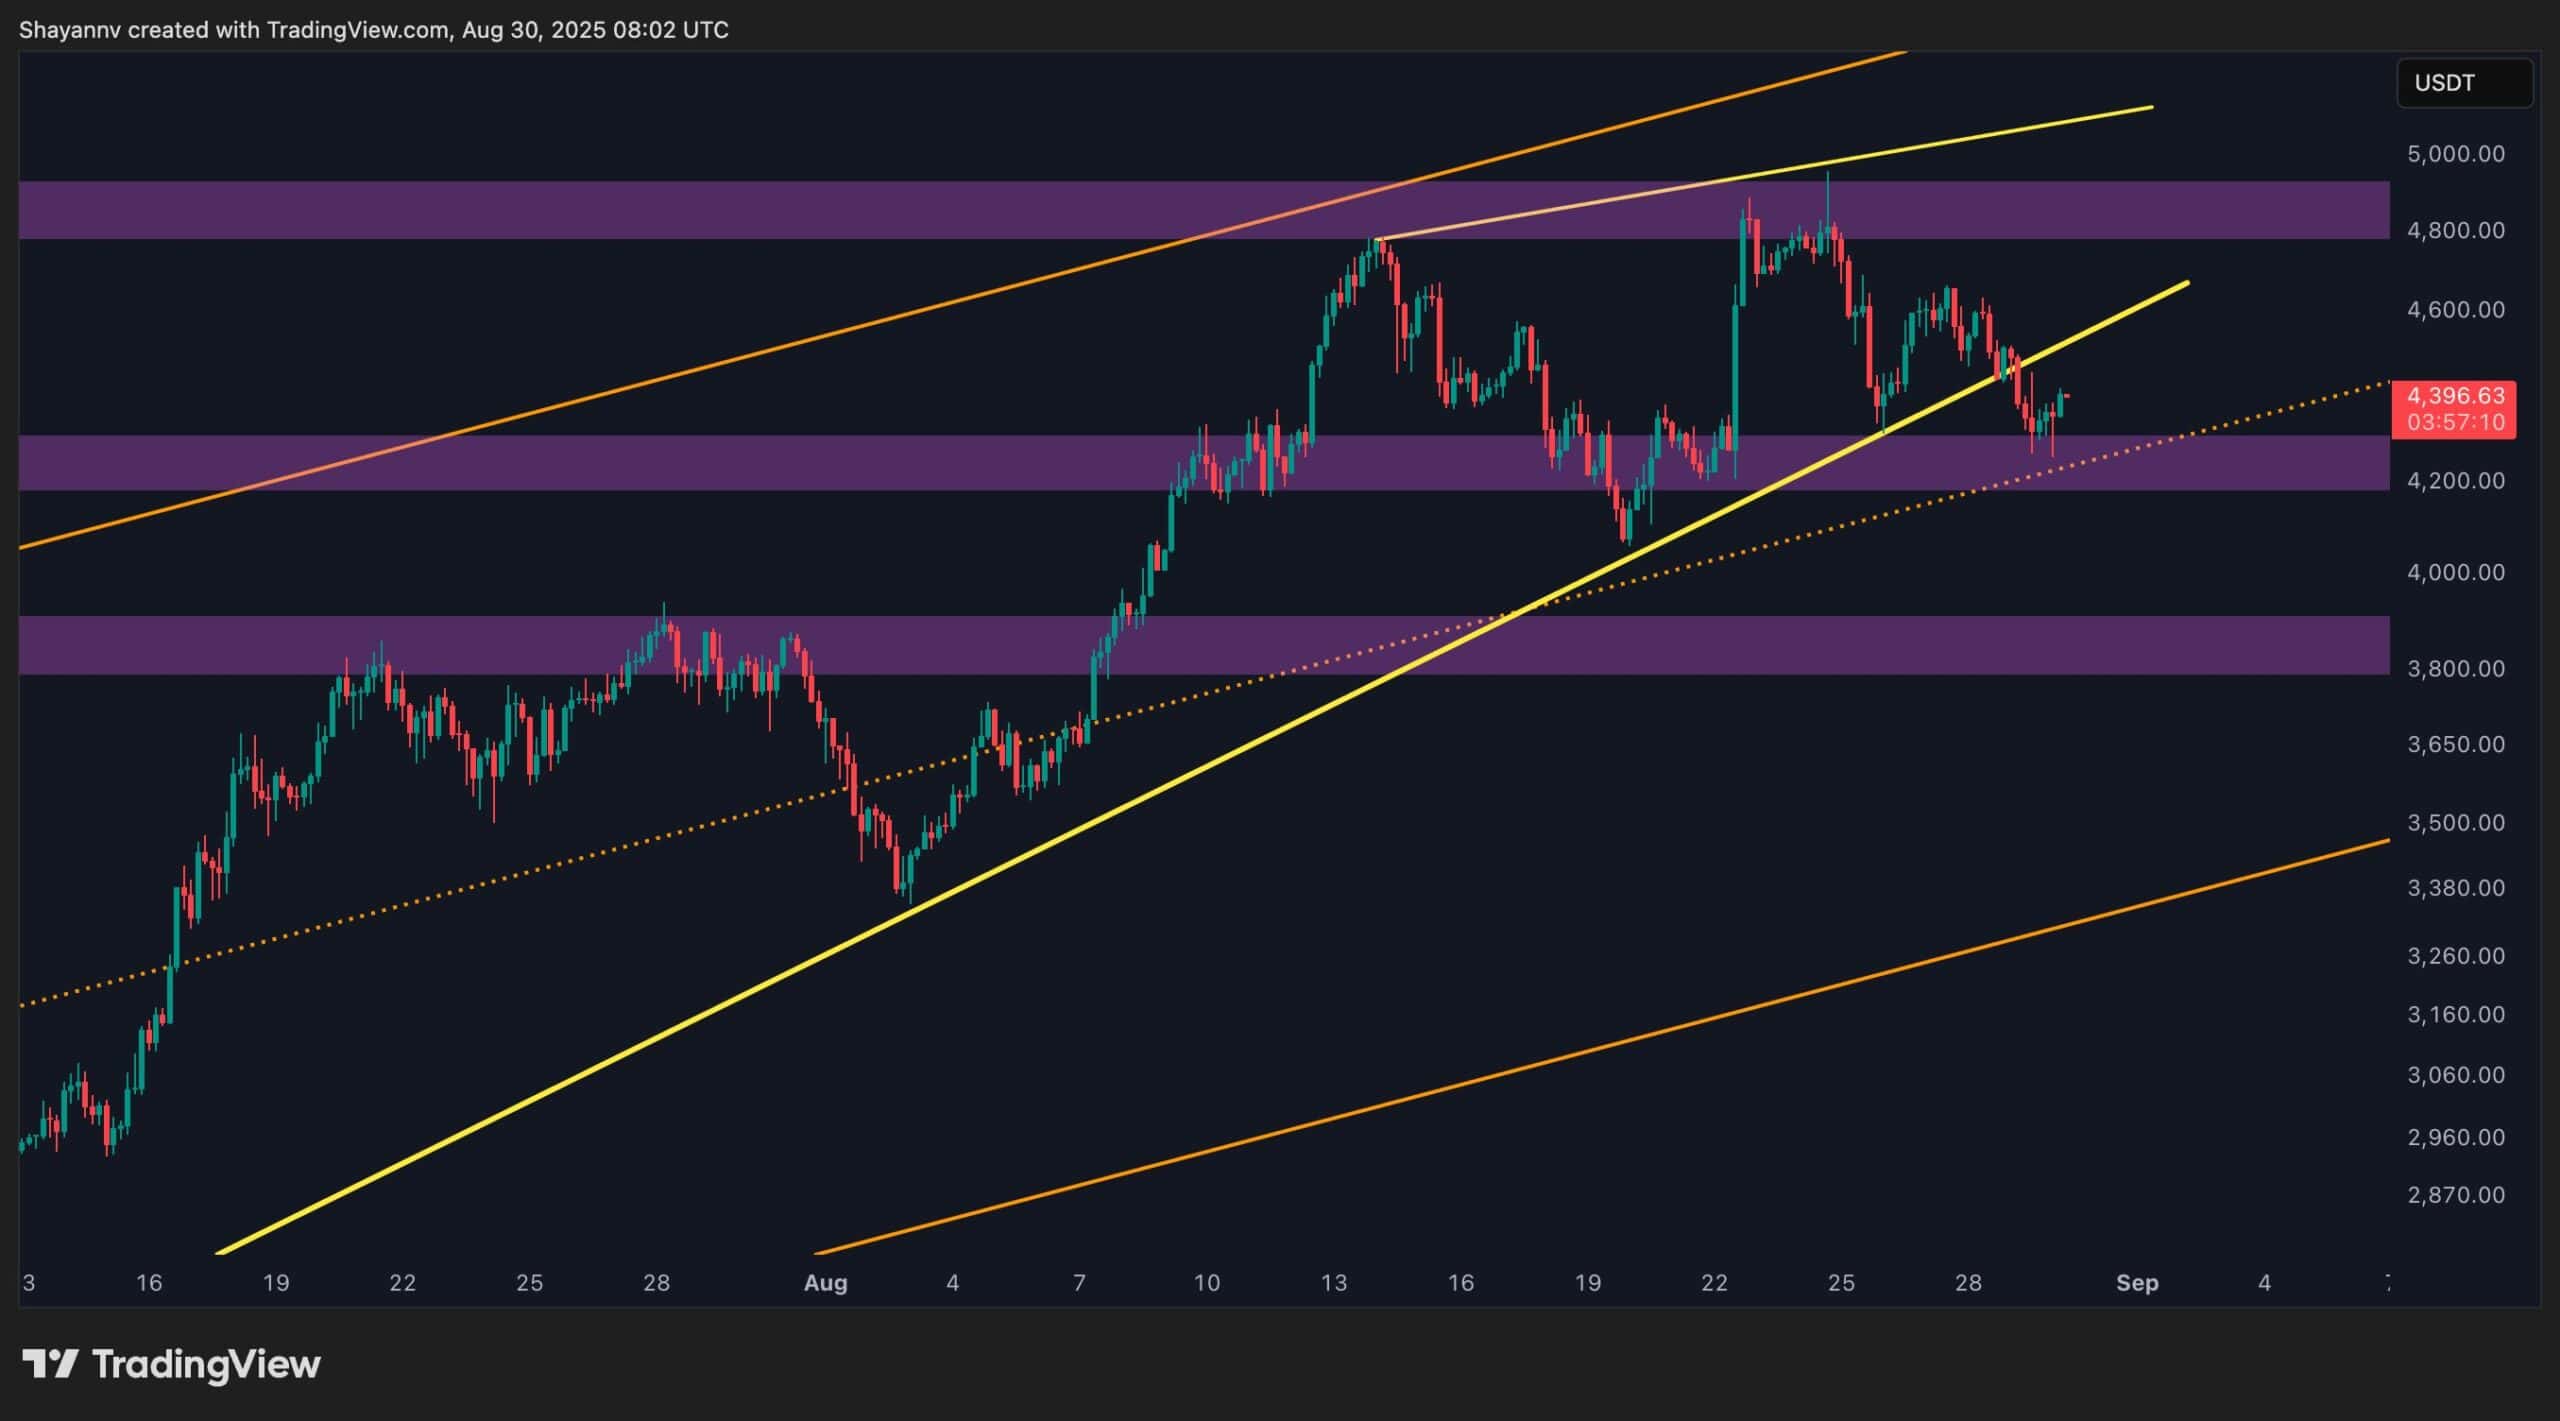
On the 4-hour timeframe, ETH has broken below its steeper ascending trendline, though the broader channel midline near $4.2K continues to provide crucial support. This has placed the market in a consolidation range bounded by $4.2K support and $4.8K resistance.
The $4.2K demand zone is the key battleground. A breakdown here would confirm a shift in market structure, likely accelerating a MOVE toward the $3.8K area. However, if buyers defend this support and reclaim the $4.6K swing high, momentum could quickly reverse, with liquidity targets at $4.8K and potentially beyond.
Onchain Analysis
By Shayan
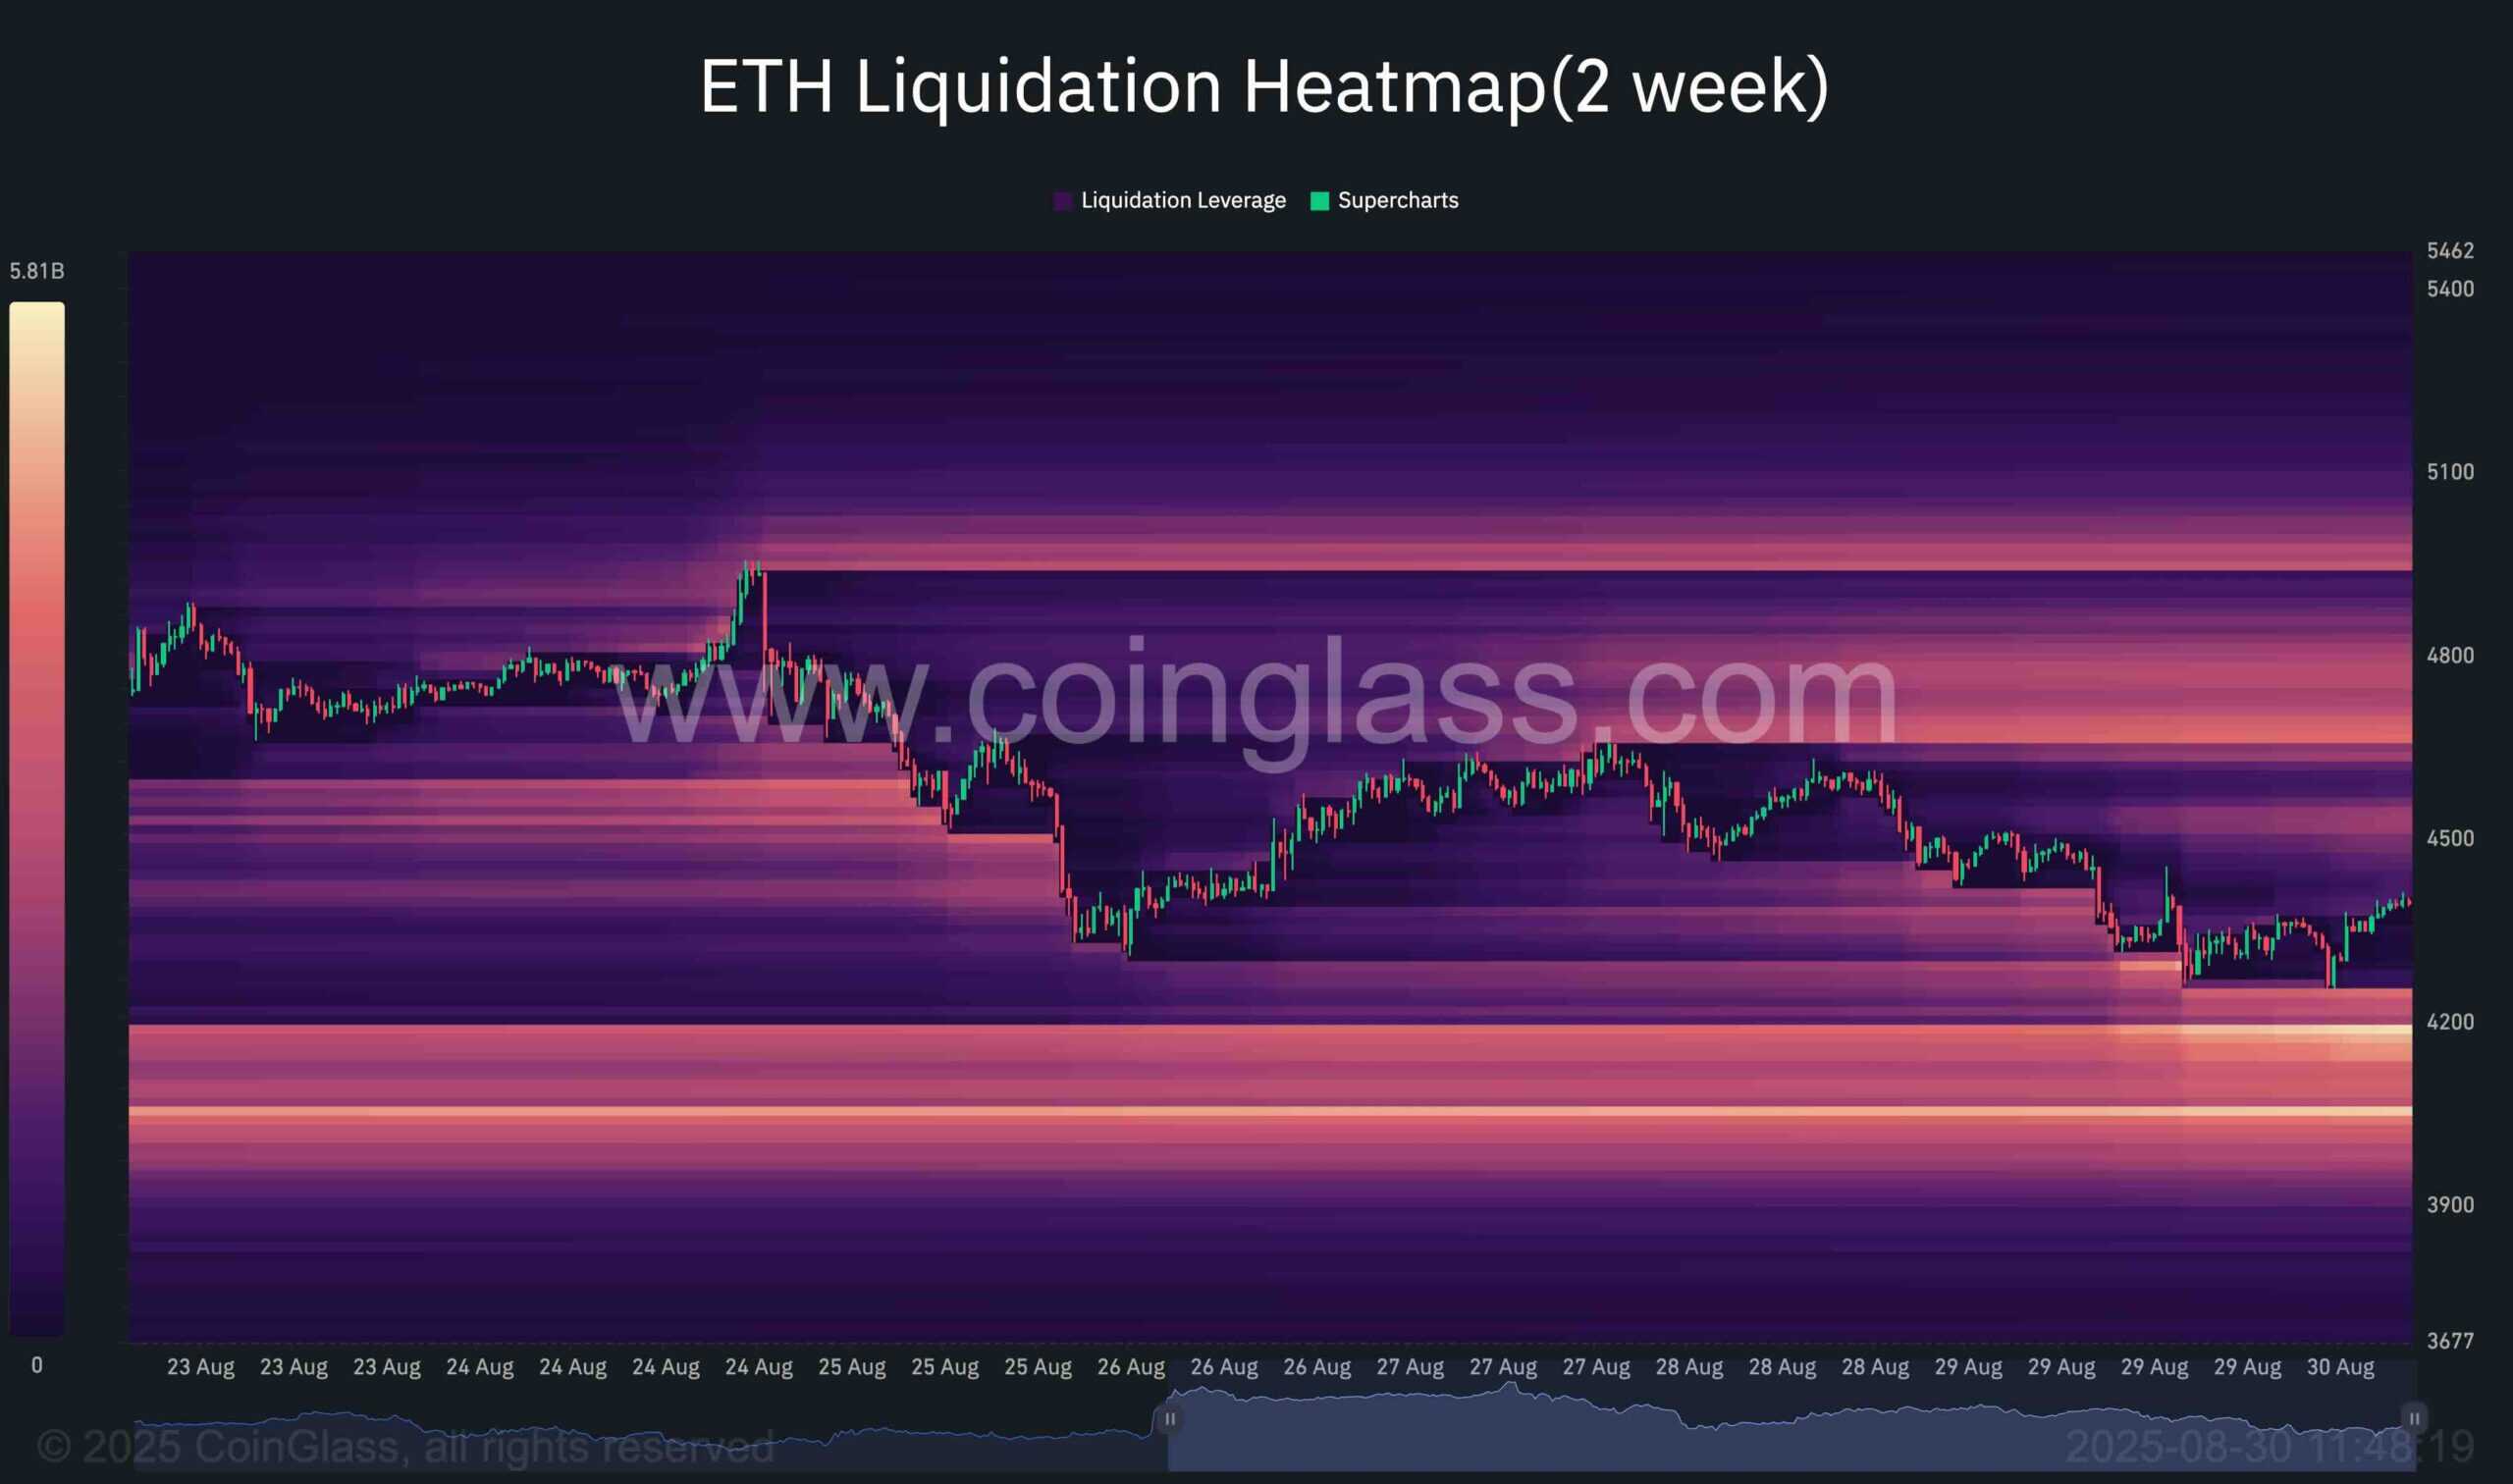
Over the past week, Ethereum’s sharp rejection from $4.9K triggered a cascade of long liquidations, sending the price lower toward the $4.2K range. The liquidation heatmap highlights where Leveraged positions are clustered, offering insight into which levels are most likely to attract price in the short term.
The heatmap currently shows a dense liquidity cluster between $4.8K and $5K, where aggressive short positions were previously trapped. This remains a significant upside target, suggesting that any bullish push could aim to sweep remaining short liquidations in this zone.
On the downside, large concentrations of long liquidations have accumulated within the $3.8K–$4.2K range, aligning with key technical support areas. If sellers regain control, these levels could serve as downside magnets, accelerating further corrections.
Until one side is decisively cleared, ethereum is likely to remain in a range-bound, liquidity-driven environment. A breakout above $4.6K would likely trigger a run into the $4.8K liquidity pool, while a breakdown below $4.2K could open the path toward the $3.8K zone.