Bitcoin Treasuries Near $100 Billion Milestone: Institutional Accumulation Hits Historic High

Bitcoin's institutional holdings approach unprecedented territory as treasury reserves near the $100 billion threshold—marking a watershed moment for digital asset adoption.
The Institutional Floodgates Are Open
Corporate balance sheets and ETF vehicles now hold staggering amounts of BTC, creating a supply squeeze that's reshaping market dynamics. This isn't speculative retail money—it's cold, calculated capital allocation from entities that typically move markets.
What $100 Billion Really Means
That number represents more than just a round figure—it signals mainstream acceptance that would've been unthinkable just years ago. While traditional finance scrambles to understand this new asset class, Bitcoin's network effect keeps compounding.
Of course, Wall Street will probably take credit for the move once prices rip higher—because nothing inspires innovation like chasing performance fees.
BTC Price: Technical Analysis
By Shayan
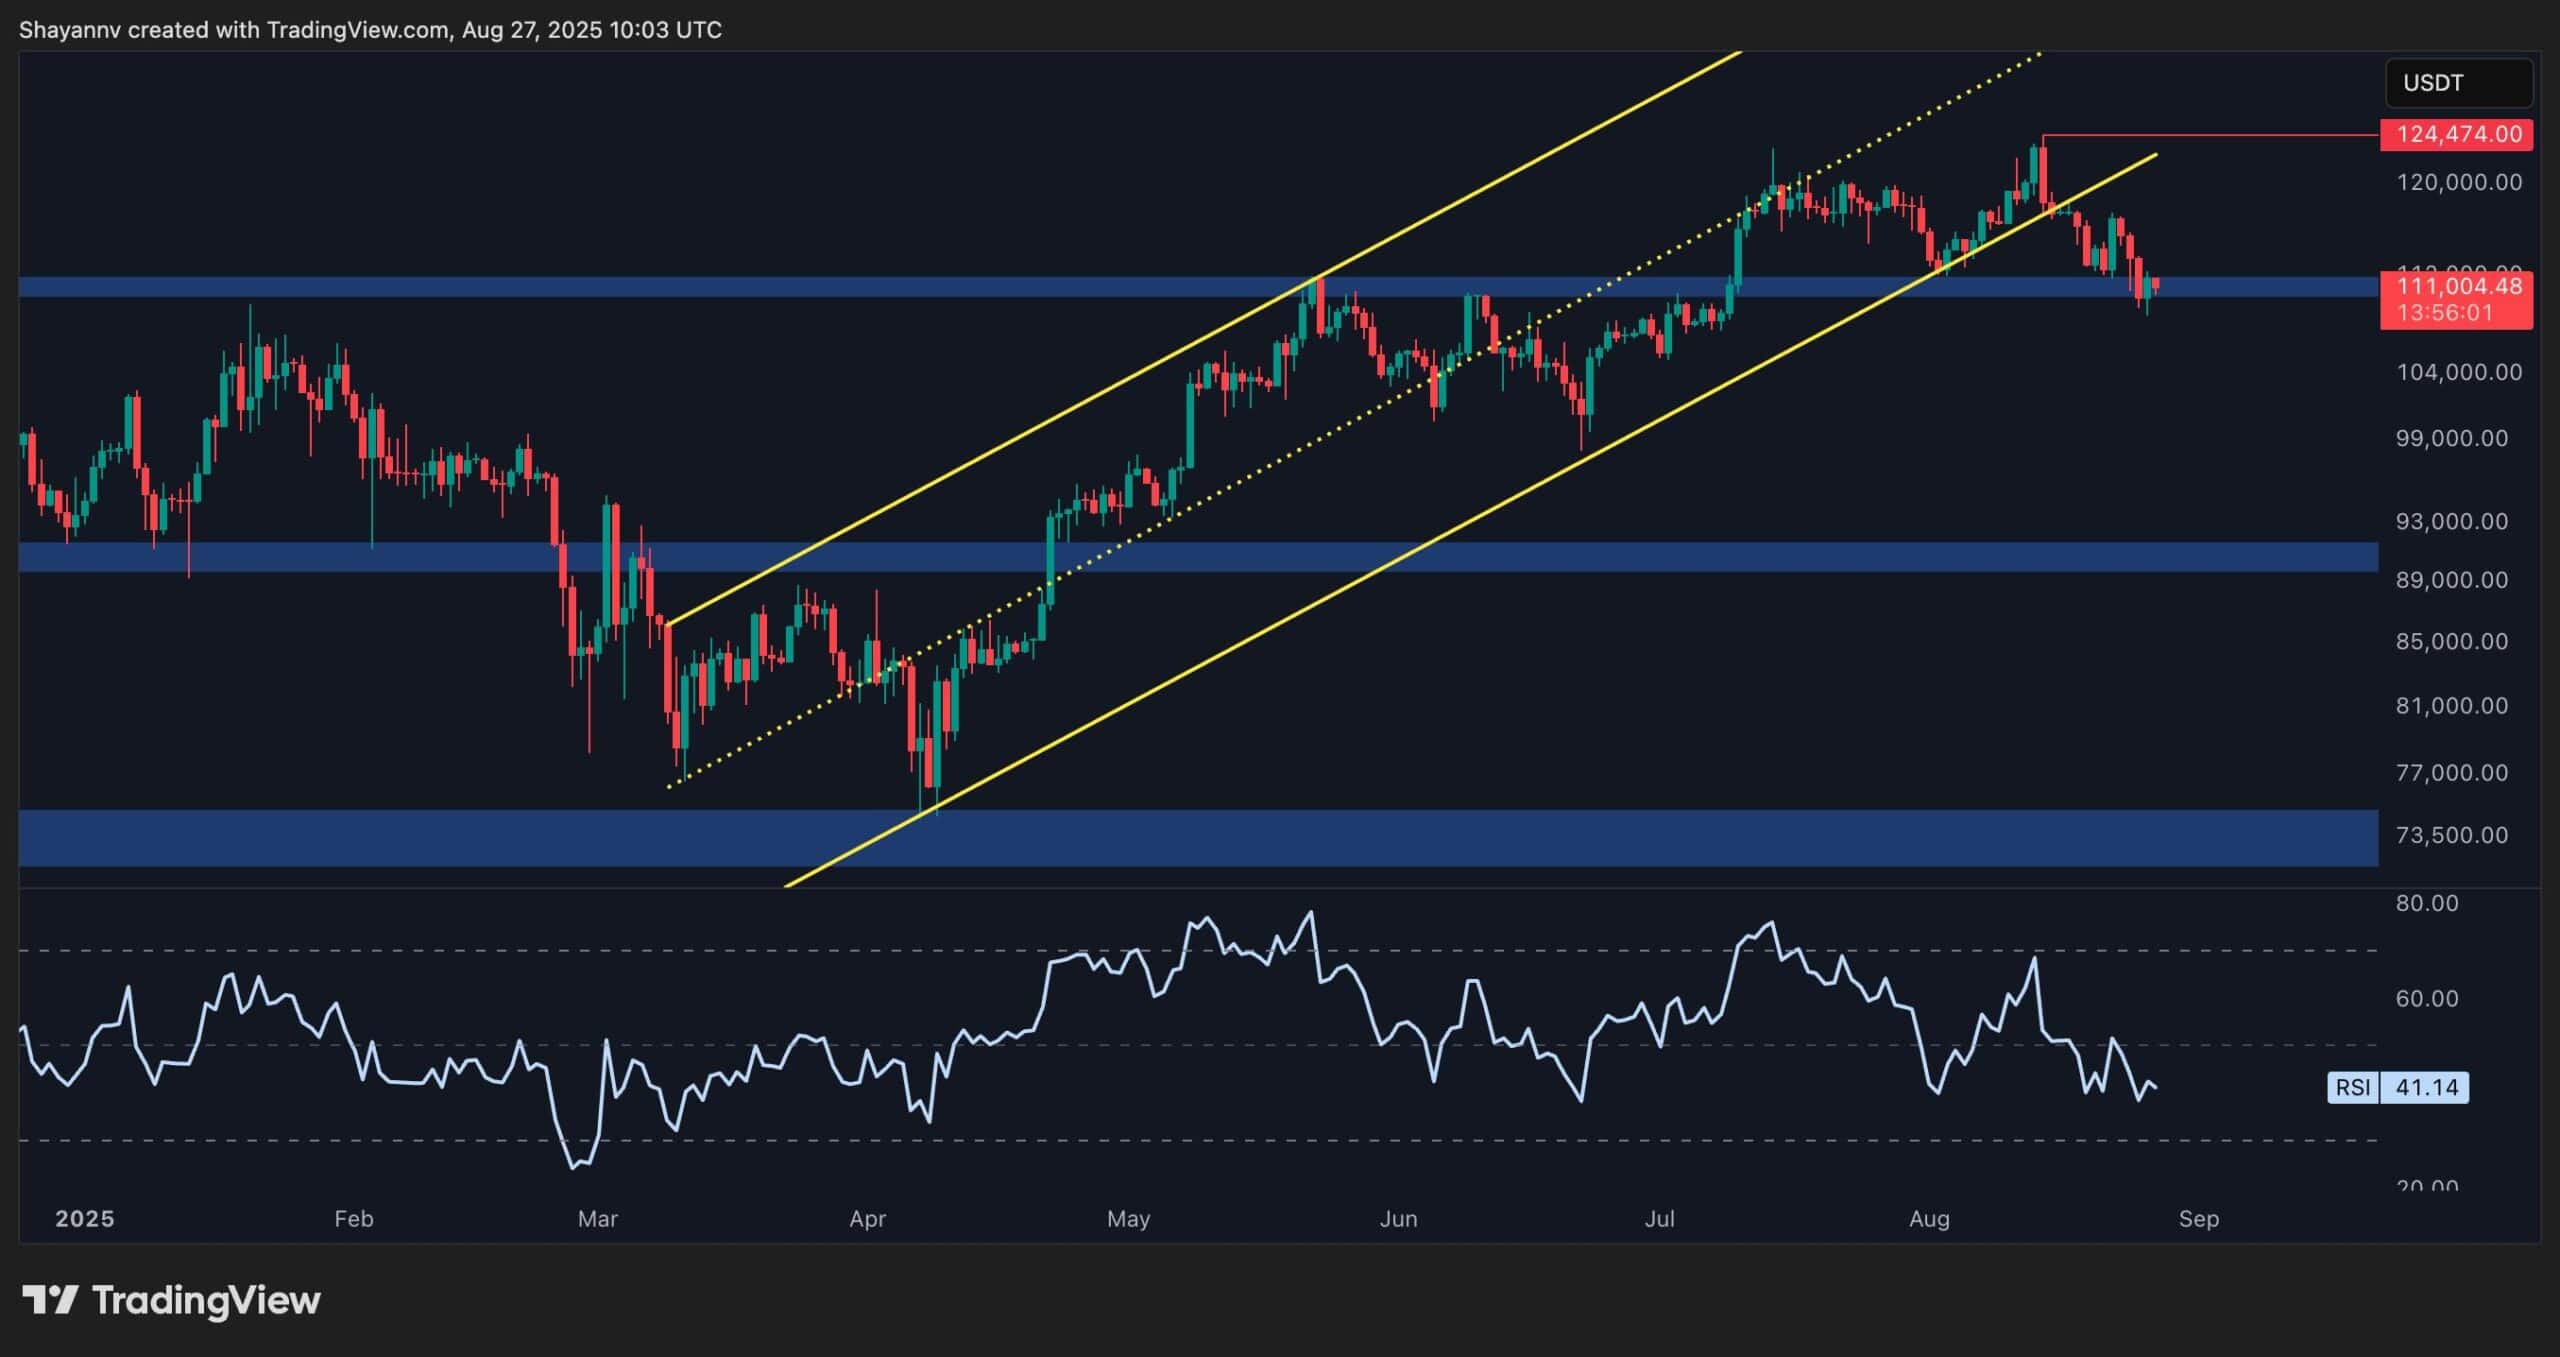
The Daily Chart
On the daily chart, the asset has made a new lower low after reversing above the $120K zone and breaking below the large ascending channel. The $110K area is currently providing support and halting the market’s short-term bearish trend. However, the price has still not demonstrated an impulsive rebound from this zone, which could point to a potential breakdown soon.
The RSI has also been below 50 for a while now, confirming the bearish momentum. This also adds to the probability of a deeper drop in the coming weeks, which could potentially drag the price as low as the $100K psychological support level.
This scenario WOULD fail if the market shows a significant bounce from the $110K level soon, and the RSI also rises above 50 to indicate a bullish shift in momentum.
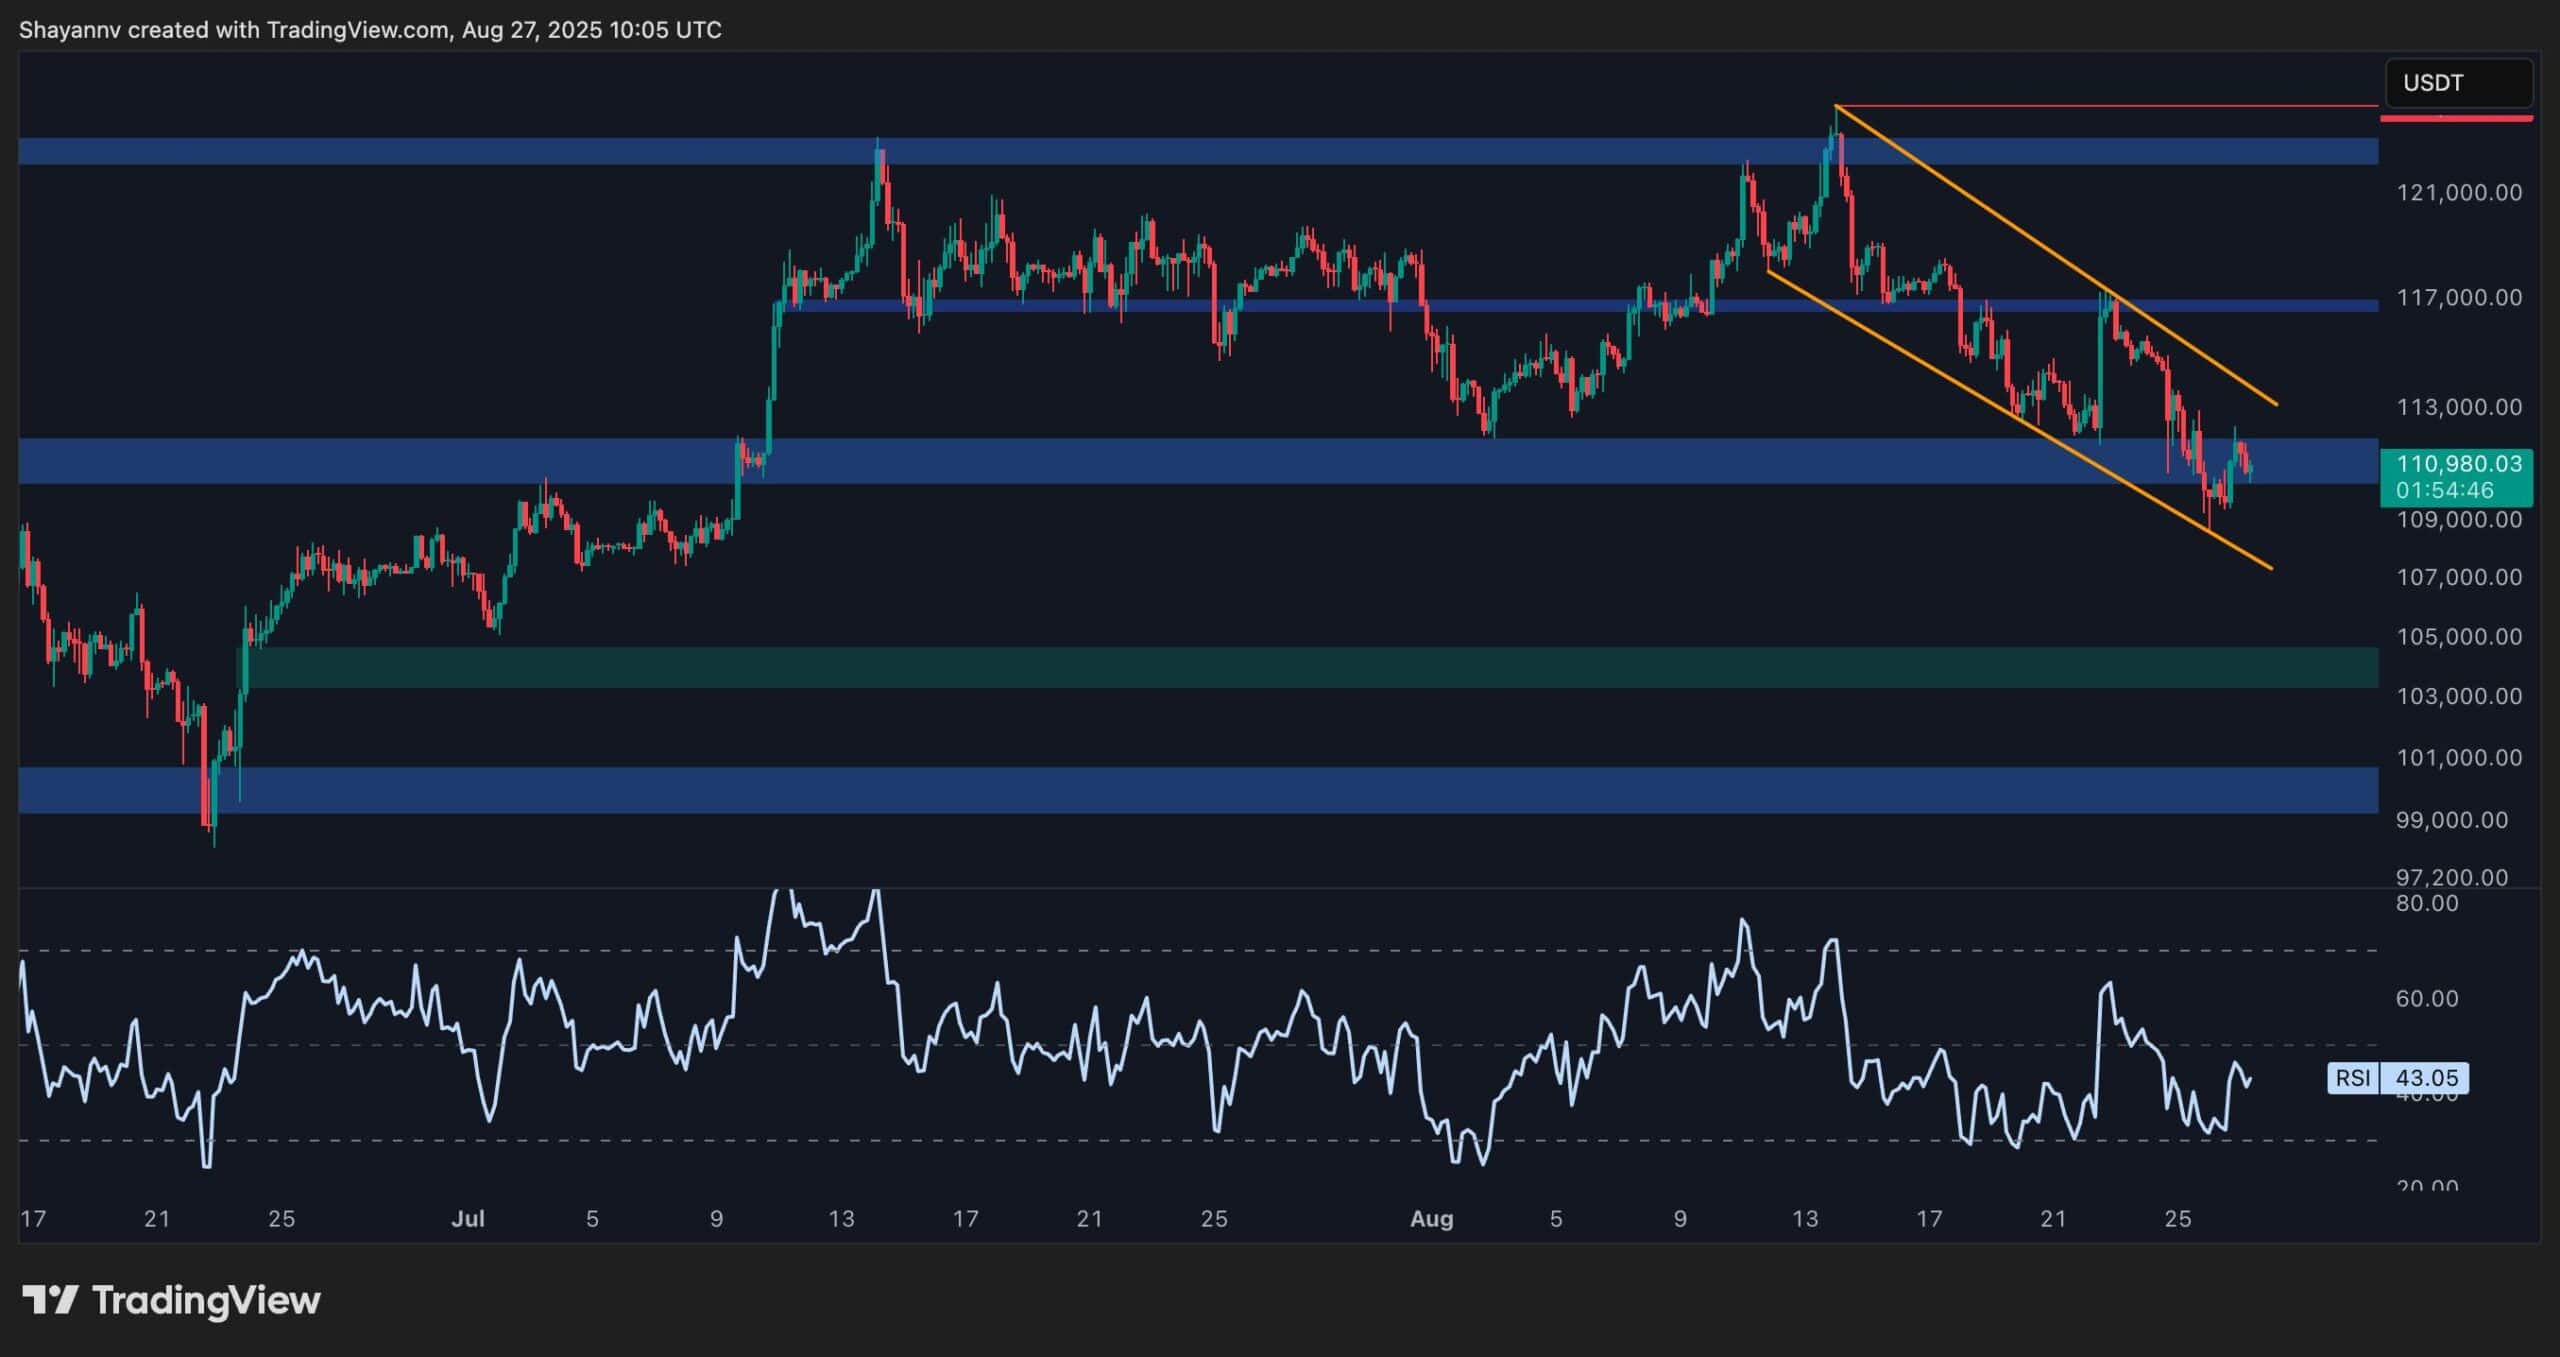
The 4-Hour Chart
Looking at the 4-hour chart, it is evident that the price has been making lower highs and lows inside a steep descending channel, which has started since the latest all-time high. The price has also briefly broken below the $110K support level, before quickly rising again.
With the momentum also being bearish as indicated by the RSI, the price is more likely to either respect the channel and decline deeper, or even begin a short-term crash by breaking the channel to the downside. This could result in a MOVE toward the $104K bullish fair value gap, or even a revisit of the $100K level if things get worse. Either way, BTC seems poised for more bearish price action, unless it breaks above the channel.
Onchain Analysis
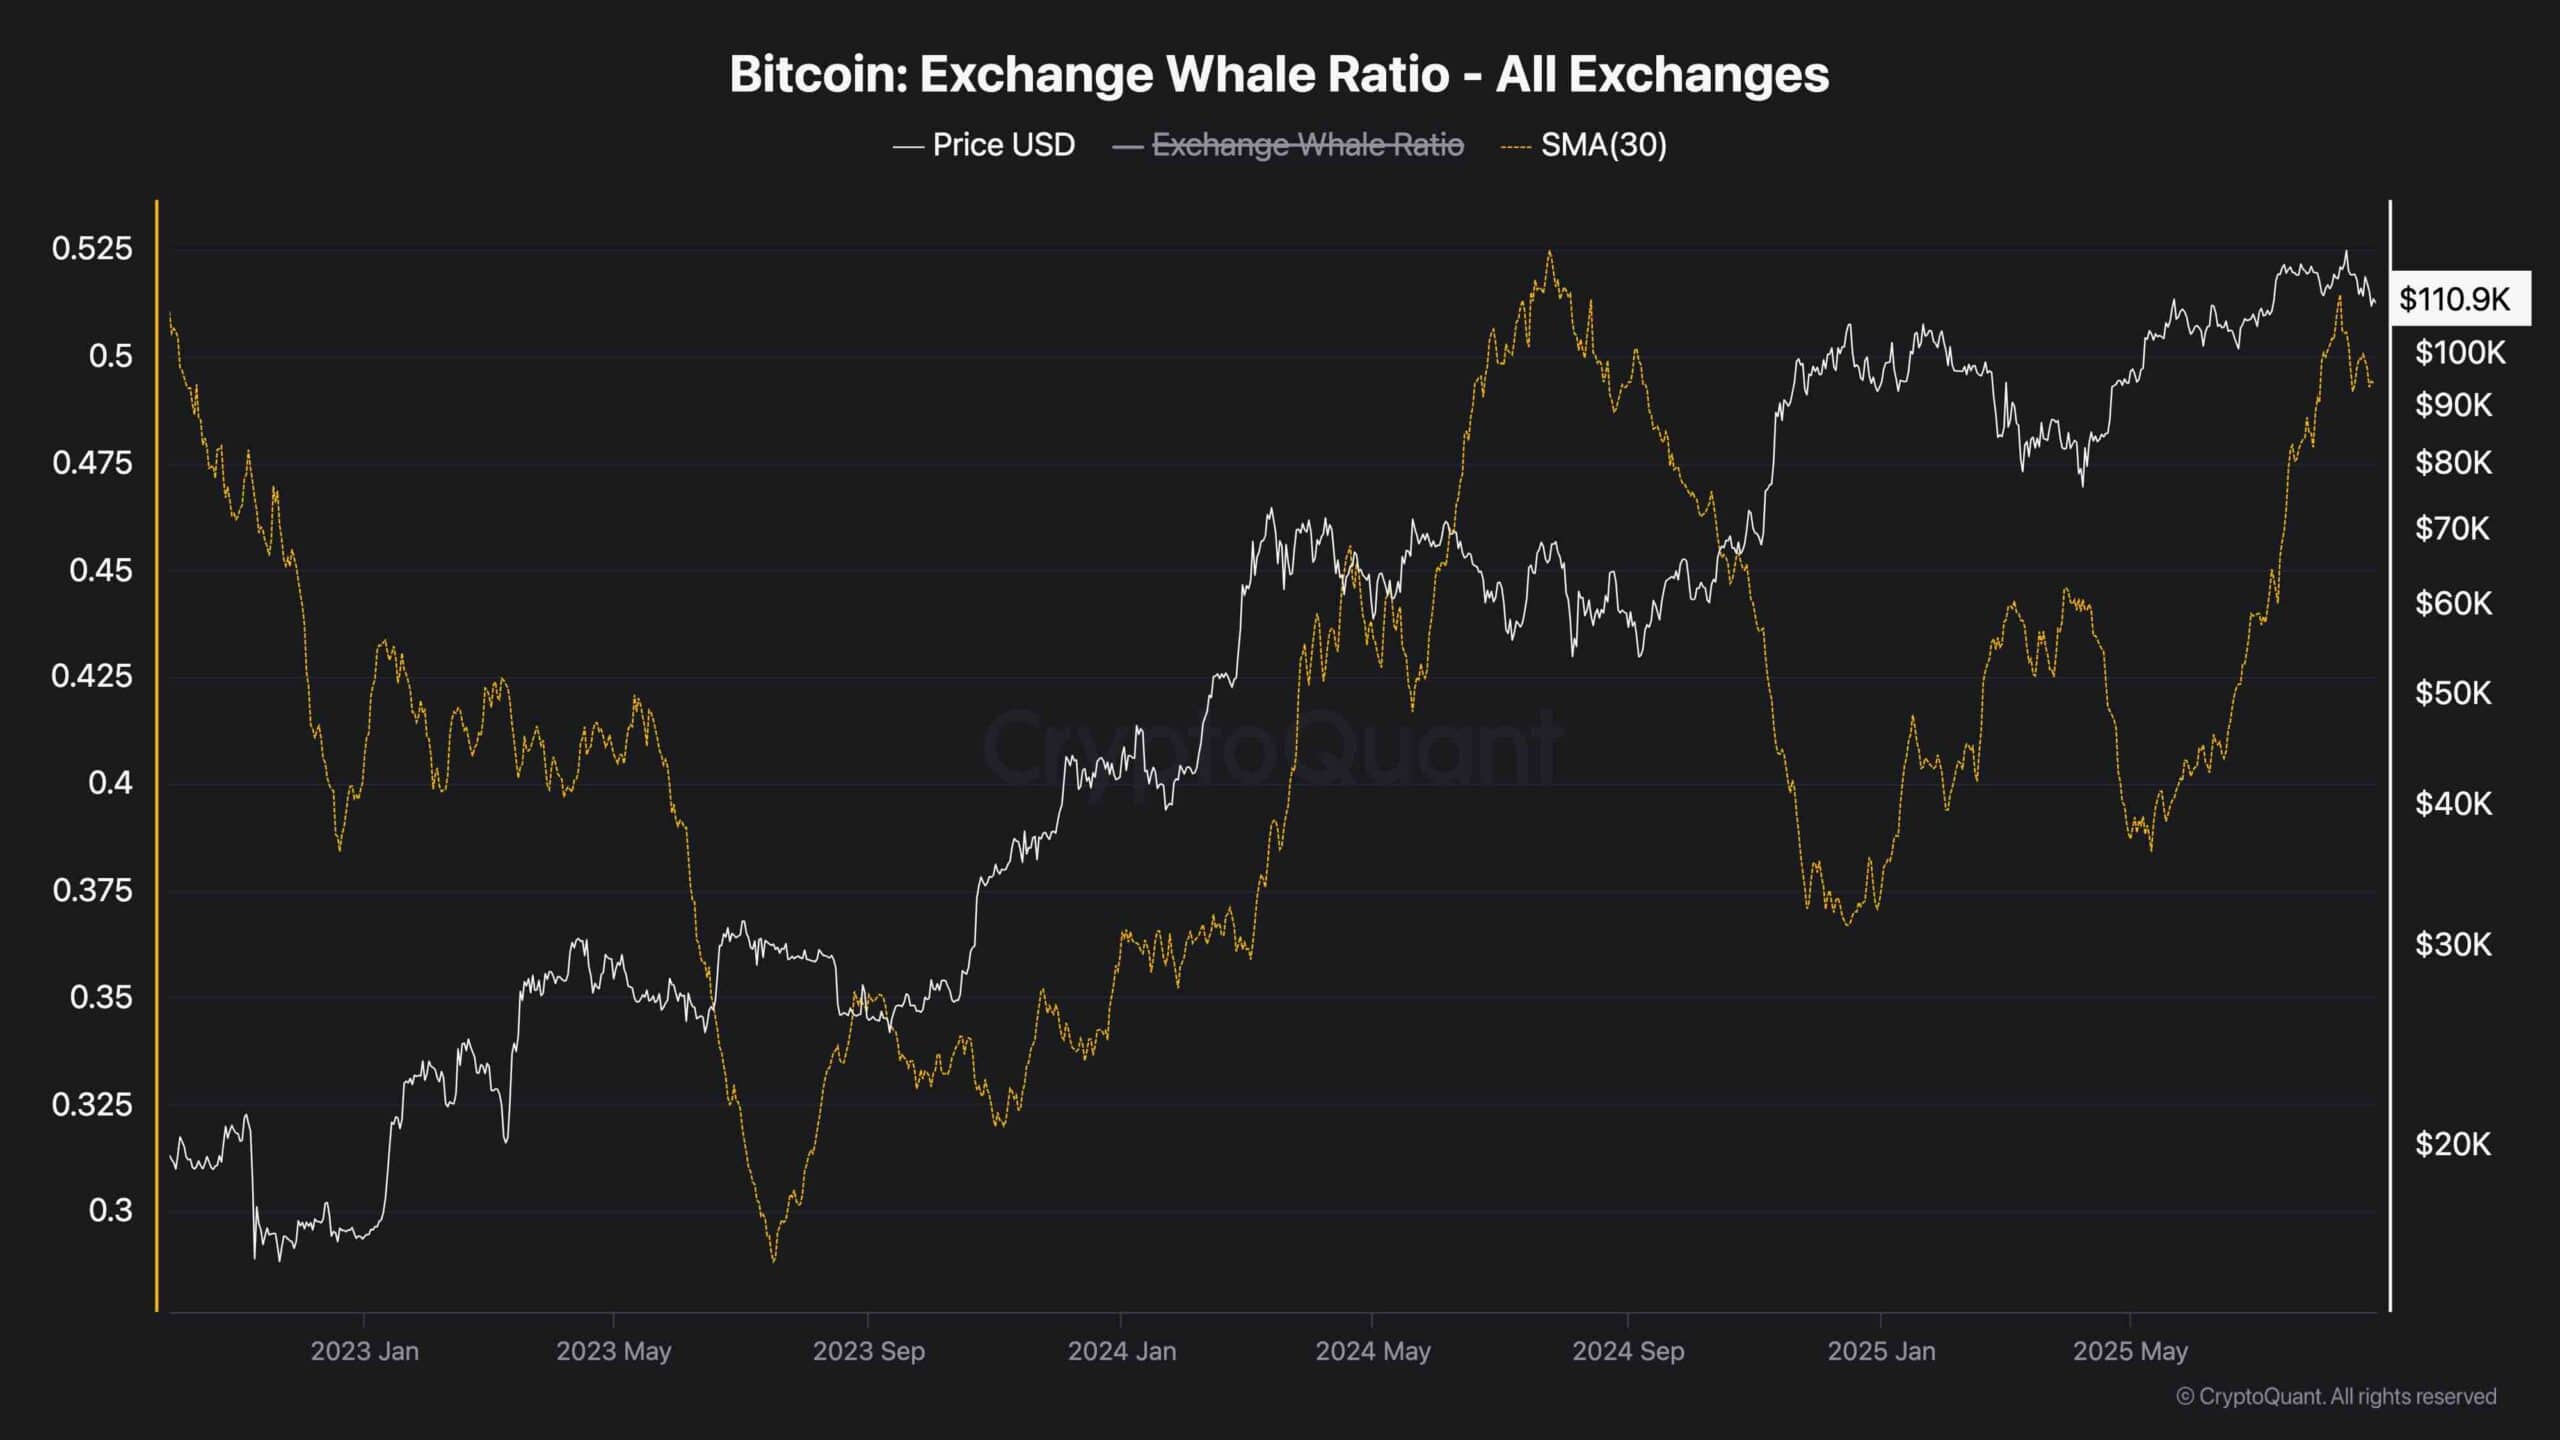
Exchange Whale Ratio (30-day moving average)
This chart highlights Bitcoin’s price action against the 100-day moving average of the Exchange Whale Ratio across all exchanges. The whale ratio represents the proportion of large inflows to exchanges coming from whales compared to overall inflows.
Historically, higher whale ratios indicate increased selling pressure since big players tend to move funds to exchanges before distribution.
In recent months, the whale ratio started a sharp rebound, moving higher alongside the latest price peak. This rise could signal a shift, with whales starting to exert more influence again, potentially preparing to offload positions. The signal points to a possible increase in short-term volatility if whale selling accelerates.
If the ratio continues climbing while Bitcoin hovers near $110K, the market might face stronger resistance and corrective moves.