Ethereum Price Analysis: Has ETH’s Momentum Faded Following its ATH?

Ethereum hits historic peak—then stalls. The question every trader's asking: is this the calm before another storm or signs of genuine fatigue?
Technical Indicators Under Microscope
Volume patterns tell conflicting stories. While some metrics suggest consolidation, others hint at accumulation beneath the surface. The ATH breakthrough wasn't accompanied by the explosive volume many purists wanted to see.
Market Sentiment Shift
Whales aren't dumping—but they're not aggressively accumulating either. Retail interest remains elevated, though the leverage frenzy from previous cycles appears tempered. Maybe everyone finally read the 'this is not financial advice' disclaimers.
Institutional Footprint
Traditional finance still can't decide whether to embrace Ethereum or regulate it into oblivion. The usual dance—public skepticism while quietly building positions through shell companies and 'innovation funds.'
What's Next for ETH?
History says post-ATH consolidation often precedes another leg up. But history also said tulip bulbs were solid investments. The network's fundamental utility remains stronger than ever—even if trader patience wears thinner than a banker's apology.
Technical Analysis
By Shayan
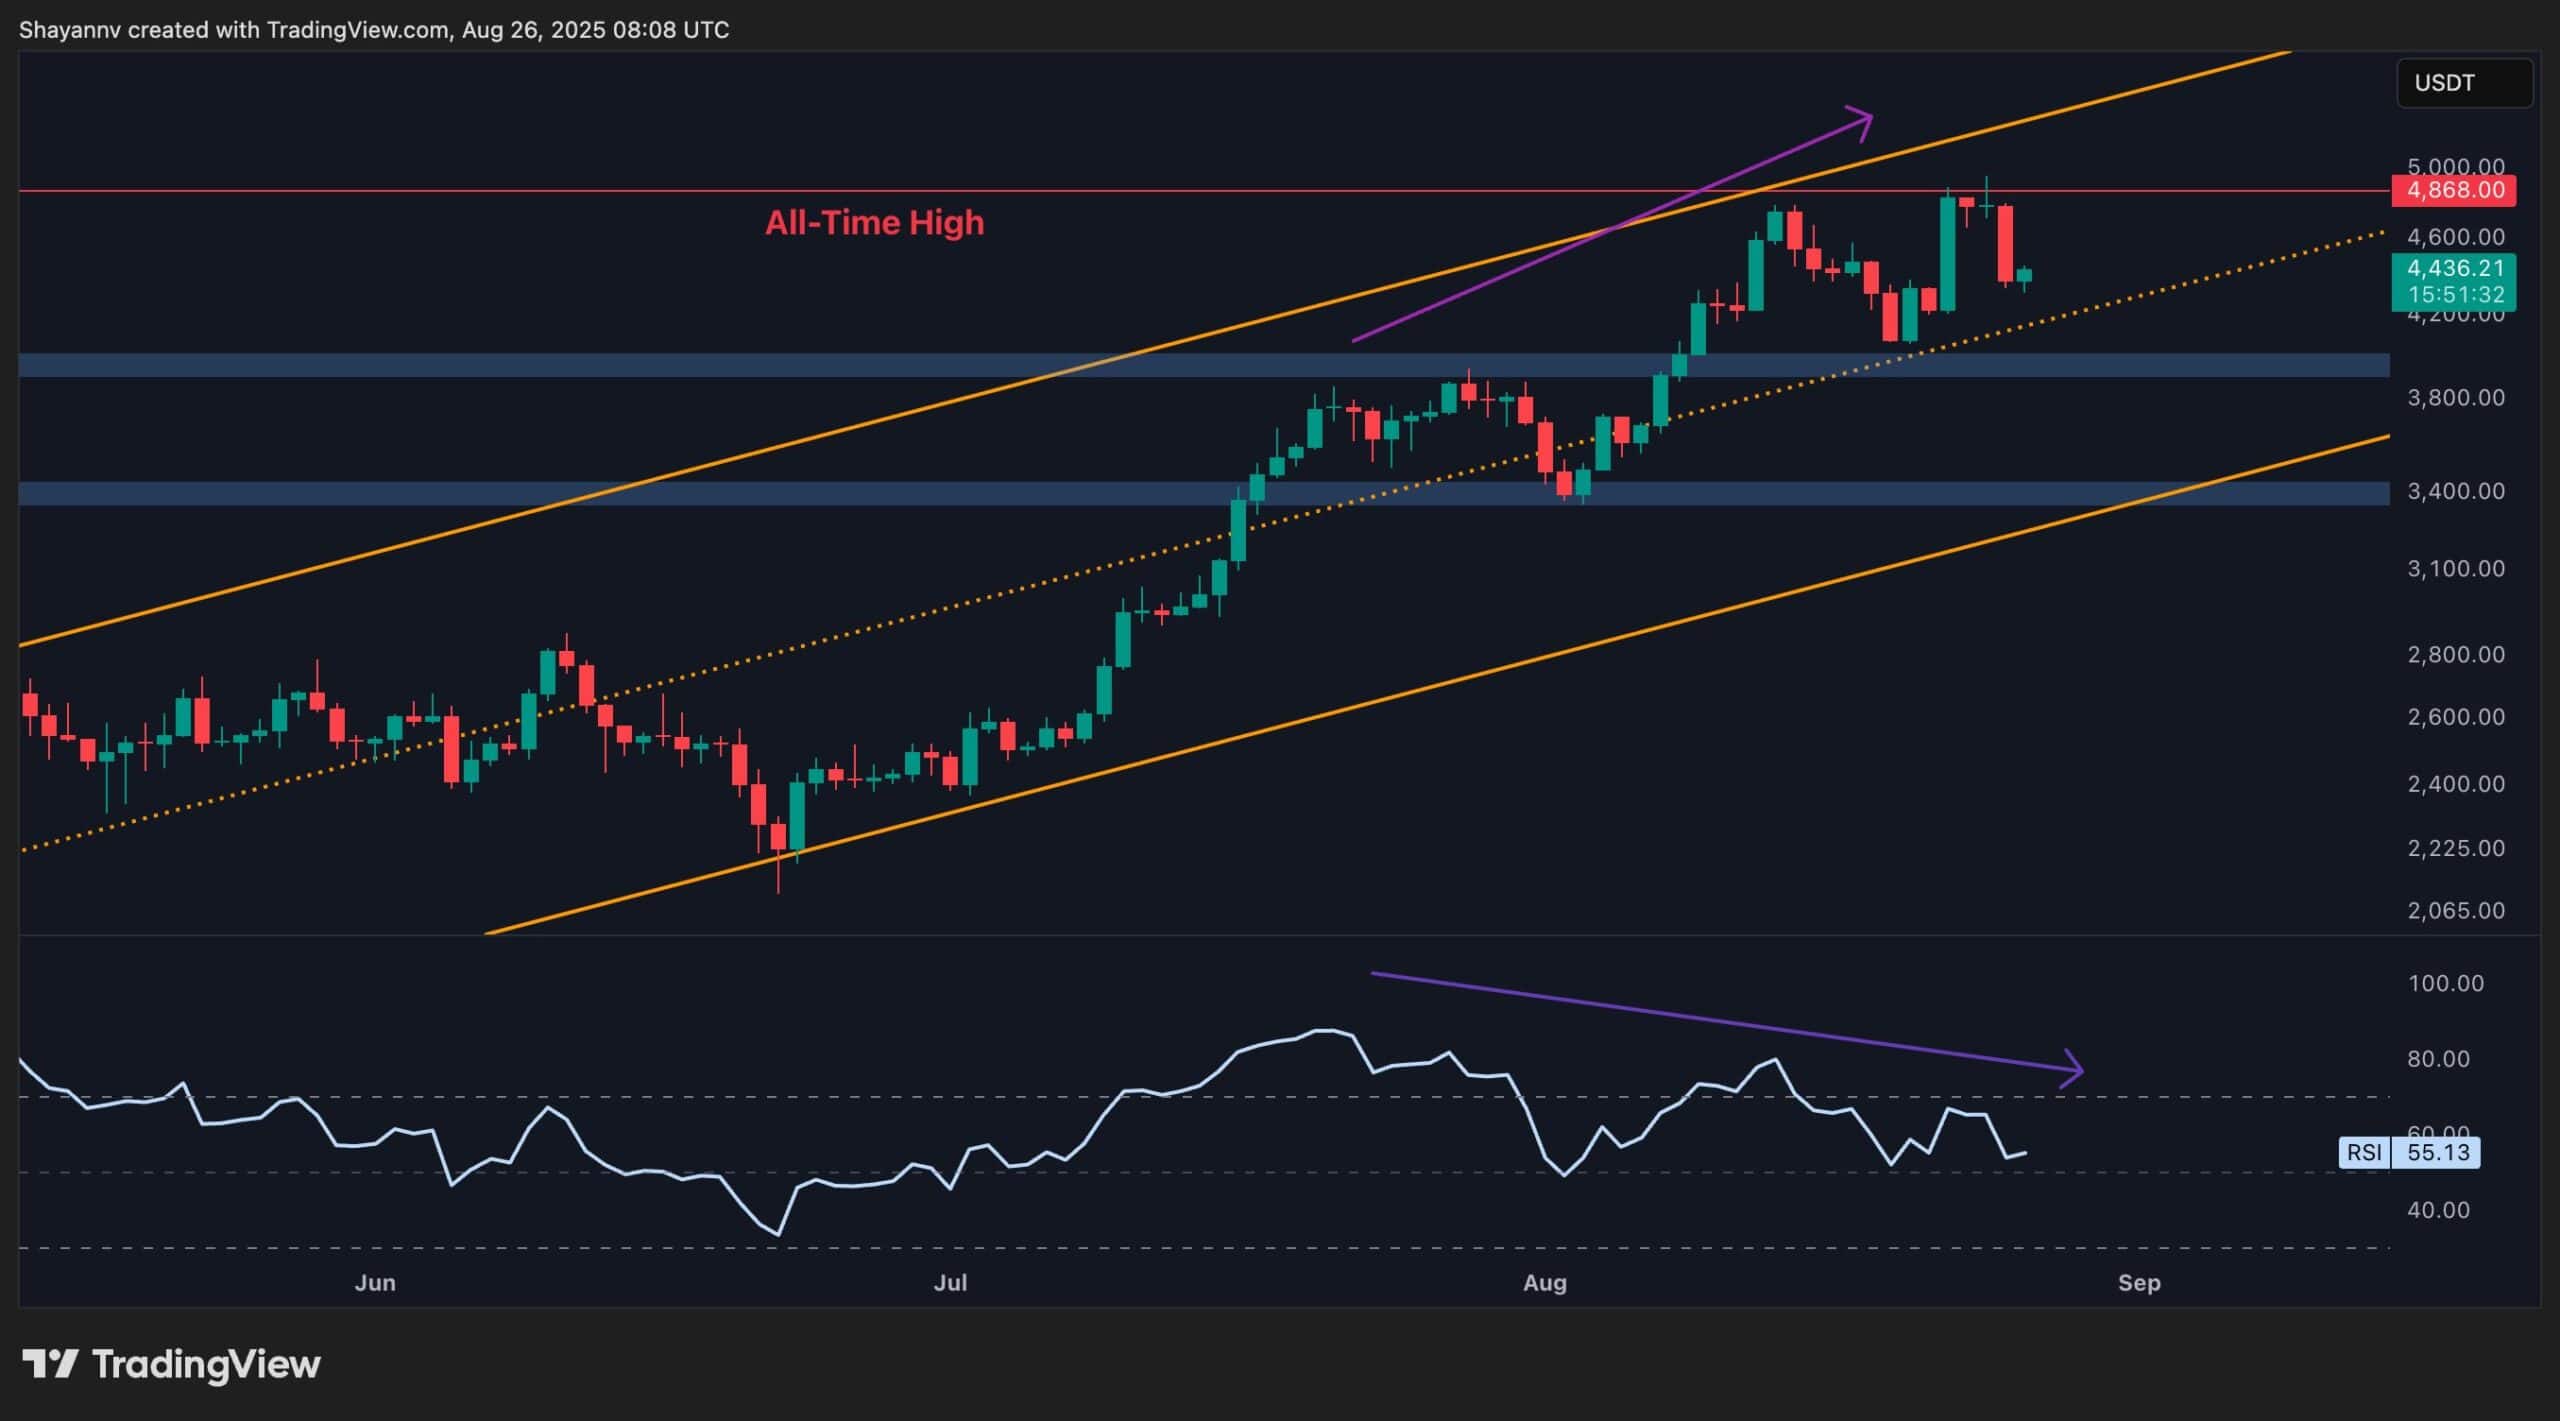
The Daily Chart
On the daily chart, ETH broke slightly above its previous peak, recording a marginally higher ATH. However, the RSI failed to make a new high, forming a bearish divergence that reflects waning momentum.
Following this, the asset pulled back toward the ascending channel’s midline, now finding support in the $4,400–$4,450 region. If this level holds, ETH may consolidate before another retest of the $4.9K zone. Conversely, a breakdown below $4,400 WOULD expose the $4K support range, which aligns with a prior swing high and marks the next major demand area.
Overall, ethereum is trading within a tight and dynamic range, and a decisive breakout in either direction is likely to trigger an impulsive move.
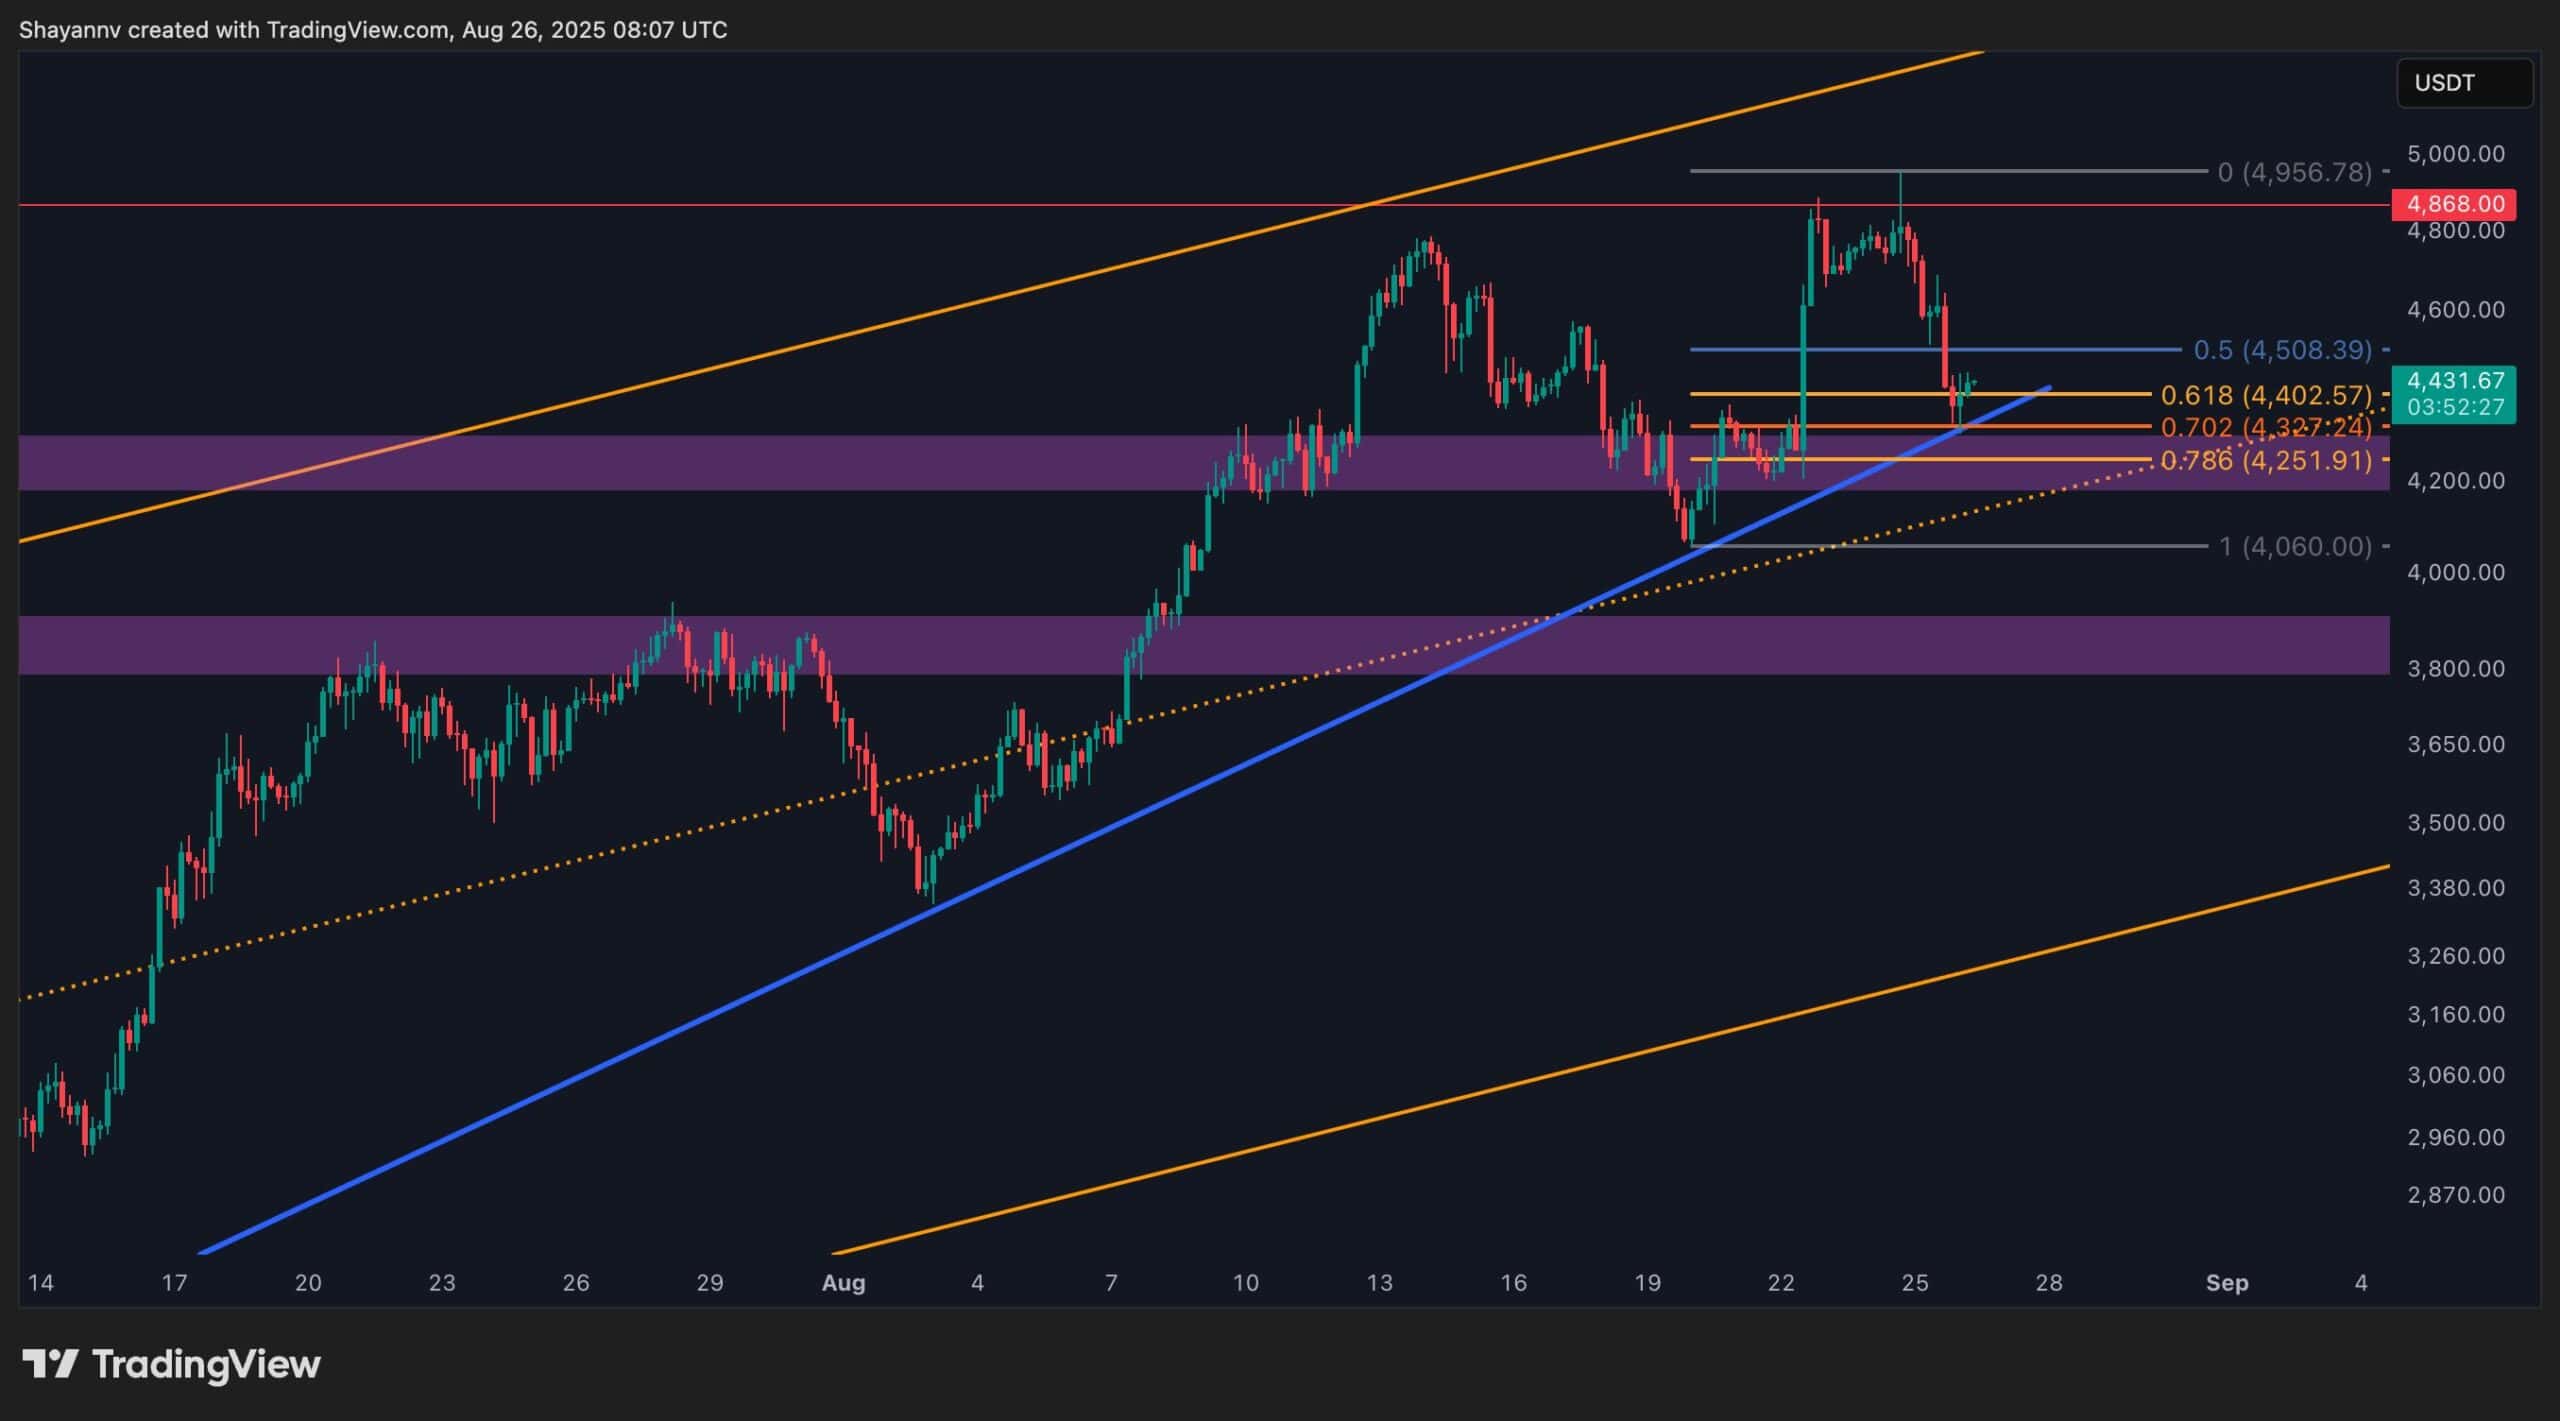
The 4-Hour Chart
On the lower timeframe, ETH recently performed a liquidity sweep above $4.8K, only to reverse sharply. This rejection coincided with distribution in the Bitcoin market, confirming short-term exhaustion across majors.
Ethereum has since retraced to the $4.4K Fibonacci cluster (0.618–0.702 retracement), where it currently hovers above trendline support. This confluence zone is a critical battleground. While holding above $4.4K could fuel a retest of the $4.9K highs, losing this level would likely open the door for a deeper correction toward $4K.
Onchain Analysis
By ShayanM
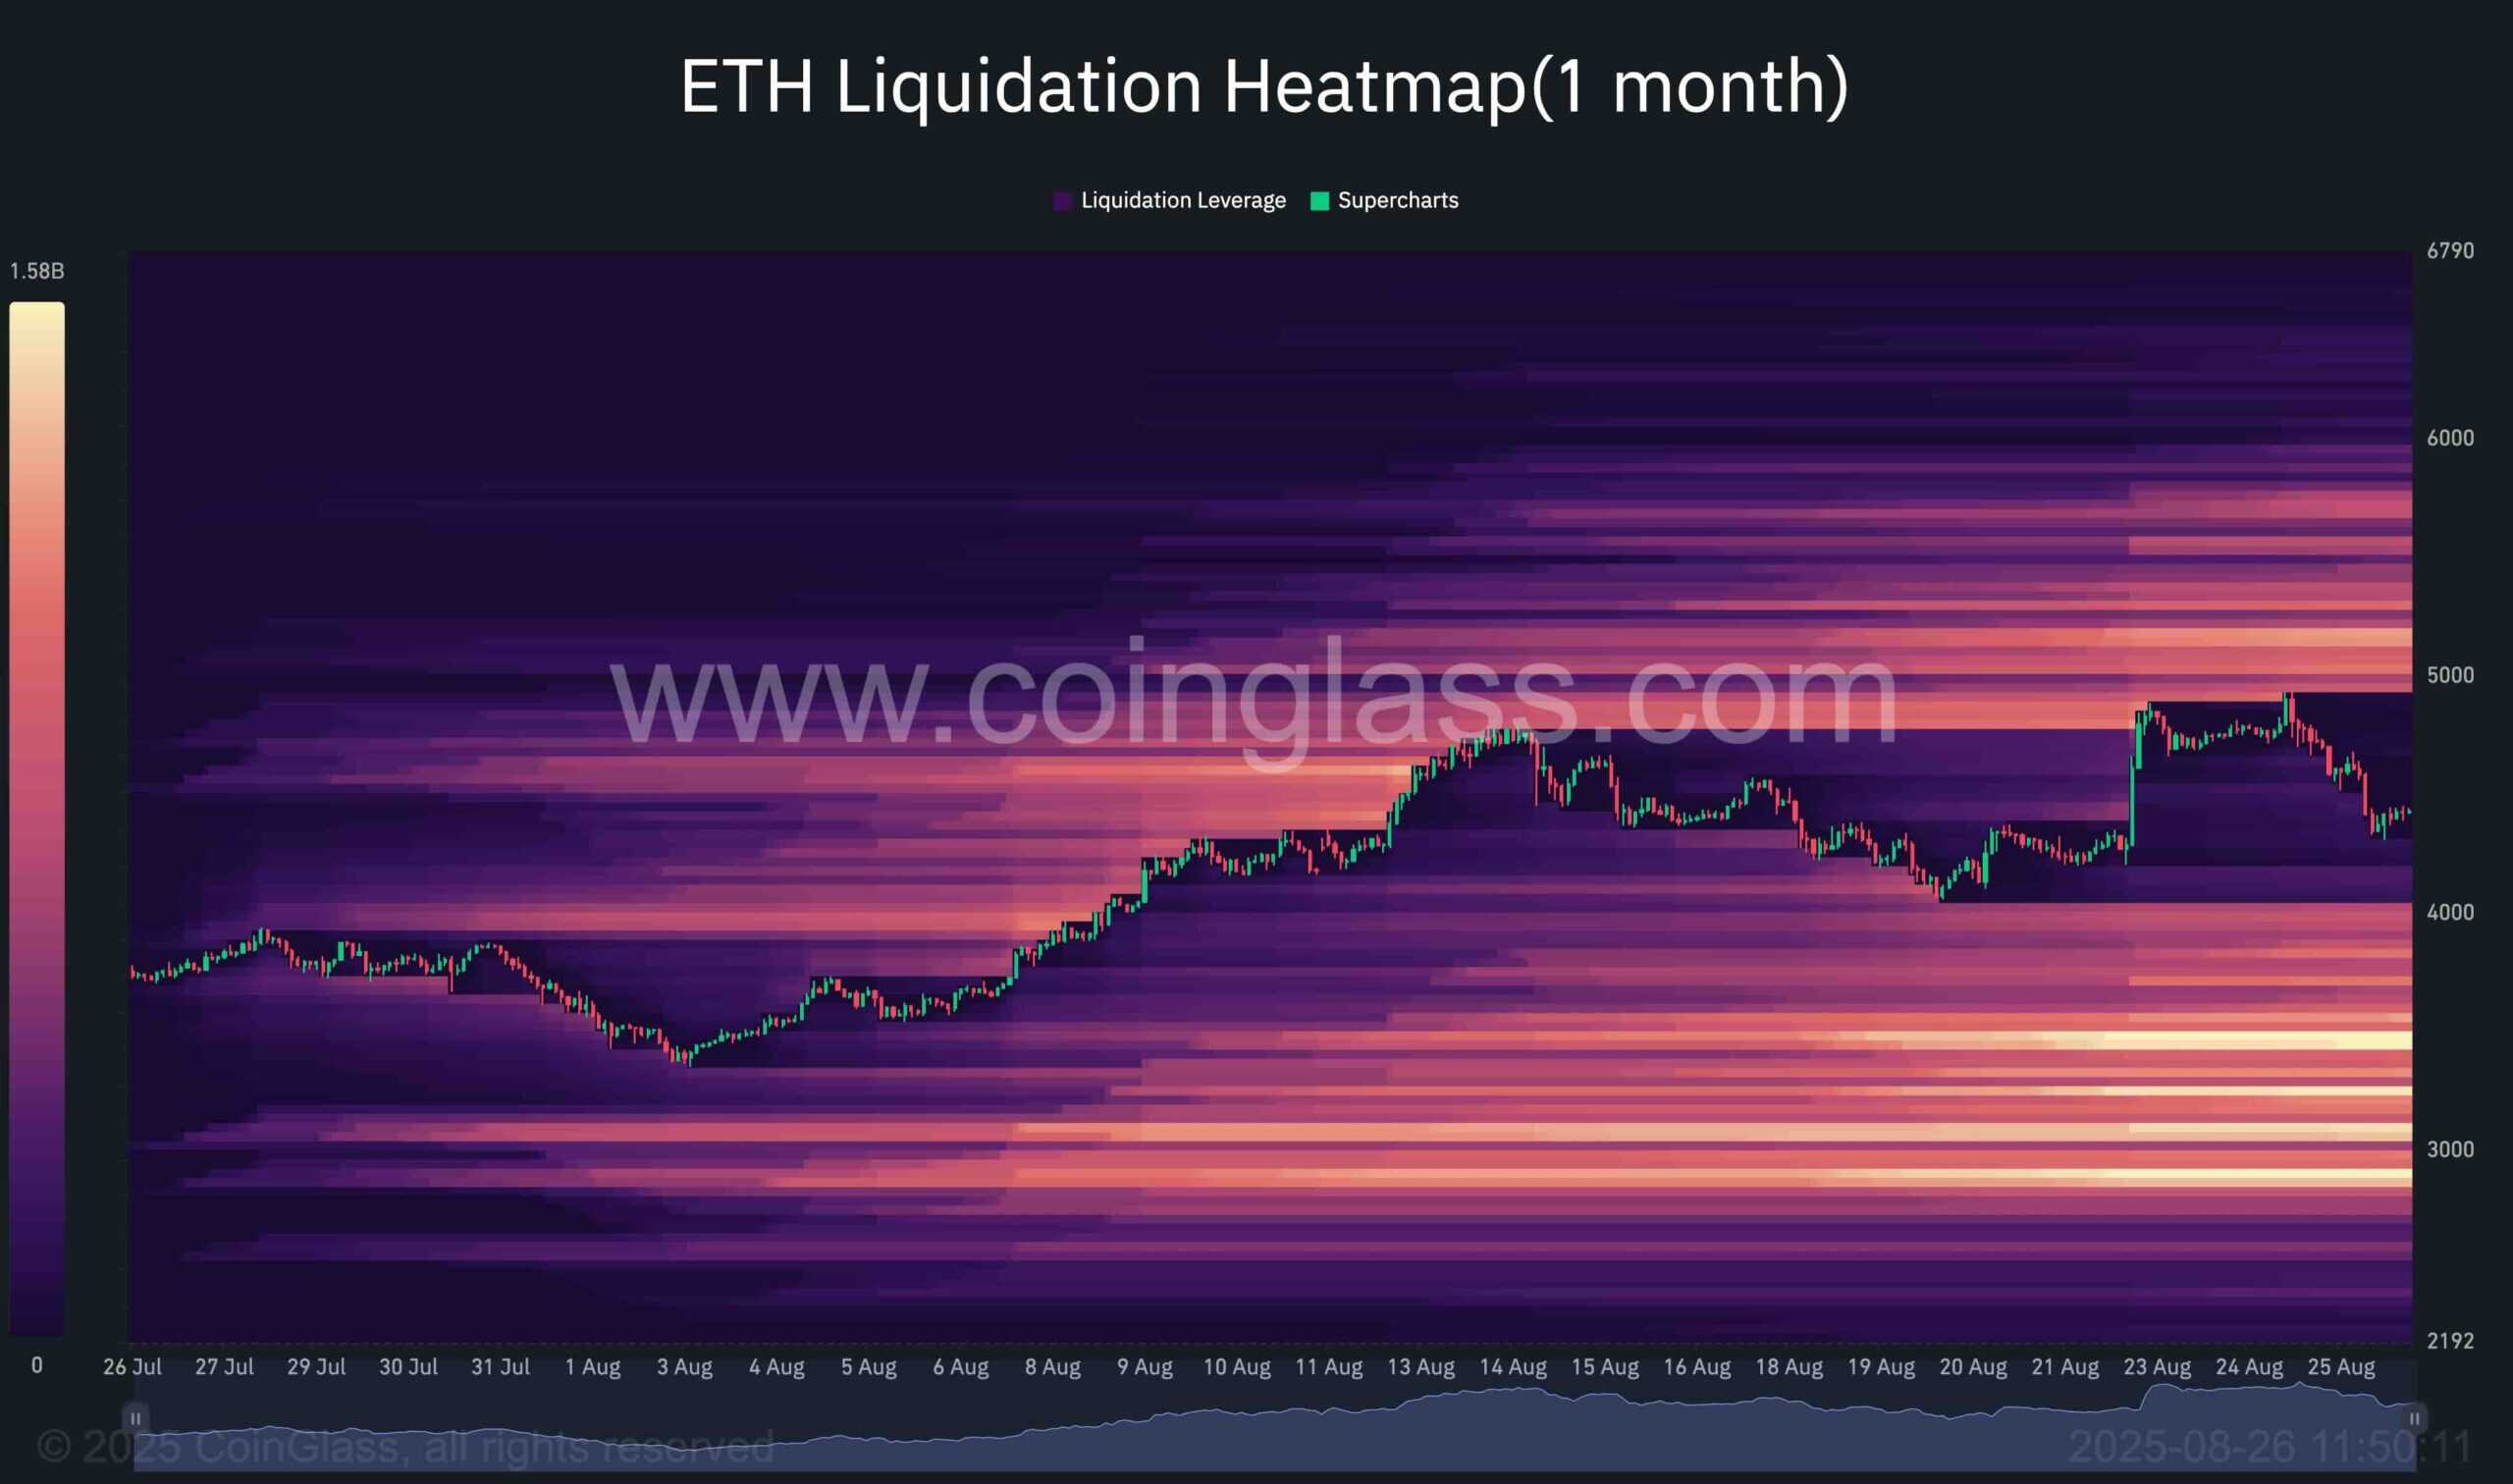
Ethereum has experienced extreme volatility in August, marked by sharp rallies followed by equally aggressive reversals. The liquidation heatmap sheds light on where Leveraged long and short positions are clustered, highlighting the levels that act as liquidity magnets for the price action.
During its surge toward $4.9K, ETH triggered a dense cluster of short liquidations, wiping out aggressive sellers. However, the sharp rejection that followed signaled exhaustion at those highs, trapping late buyers in the process.
At present, the heatmap reveals two critical liquidity zones:
- Upside: Above $4.9K, where untested short liquidations remain stacked, providing a magnet if bullish momentum regains strength.
- Downside: Below $4K, where dense clusters of long liquidations could attract price action if the $4.2K support fails to hold.
Currently, ETH is consolidating within a liquidity-driven range between $4.2K and $4.9K. With significant liquidity pools positioned on both sides, the market remains highly vulnerable to sharp, leverage-fueled moves, as liquidity hunts continue to dominate short-term dynamics.