Stellar (XLM) Primed for $1 Breakout: Here’s the Dip-Buying Strategy Smart Money Is Using
XLM bulls are eyeing the dollar milestone as key support levels hold firm against market volatility.
Technical formations suggest Stellar's infrastructure token is building momentum for a major push upward—if current levels sustain through the week's trading sessions.
Market analysts point to institutional accumulation patterns while retail traders remain distracted by meme coin mania. The smart money isn't chasing hype; it's stacking fundamental value during corrections.
Remember: Wall Street still can't decide if crypto is a bubble or the future—so they're shorting both sides just to collect the fees.
XLM Price and Market Activity
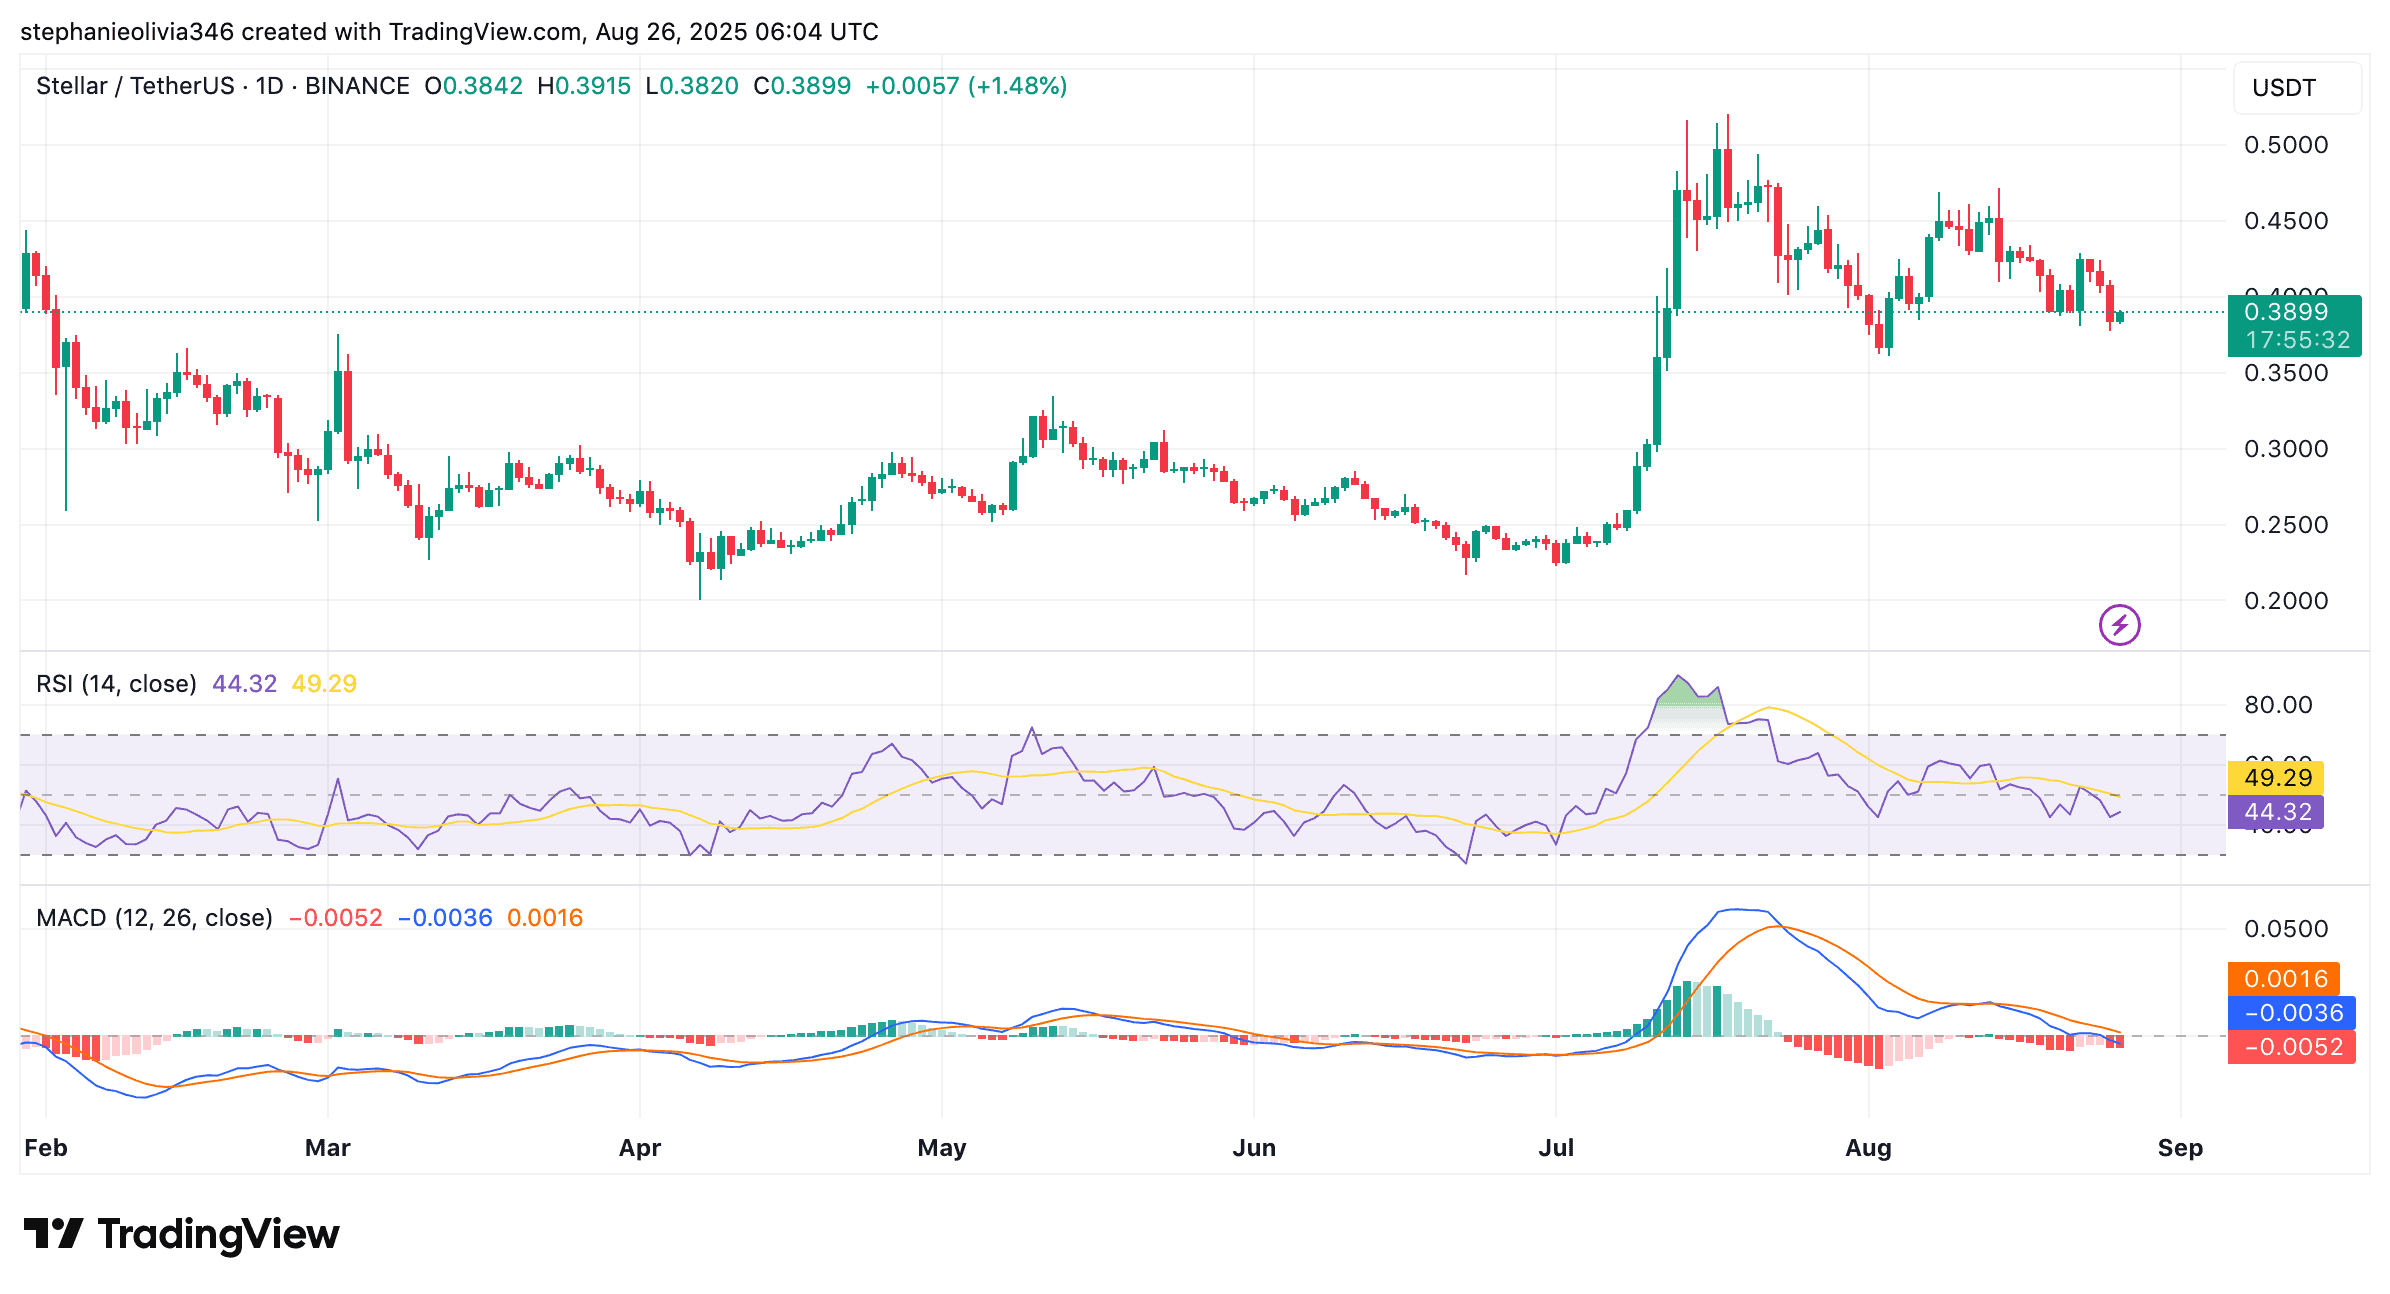
Stellar (XLM) was trading at $0.39 at the time of writing, with a 24-hour trading volume of $324 million. The token has fallen 3% daily and 4% in the past week. Over the last month, XLM has dropped 11%, even as most of the crypto market posted gains in August.
Crypto analyst Ali Martinez noted,
“Stellar $XLM still needs one more dip before the breakout to $1.”
His chart suggests the token is forming an inverse head and shoulders pattern, which often appears before a trend reversal.
Stellar $XLM still needs one more dip before the breakout to $1! pic.twitter.com/pIyUOqGX2B
— Ali (@ali_charts) August 25, 2025
Interestingly, the pattern shows a left shoulder earlier this year, a head in May and June, and a developing right shoulder through August. Support is near $0.36, aligned with the 0.618 Fibonacci retracement level. A move down into this zone WOULD complete the structure.
If XLM slips below $0.36, the next level of support sits NEAR $0.33. On the upside, the neckline is around $0.50. A confirmed breakout above this price could open targets at $0.62, $0.82, $0.94, and $1.10 based on Fibonacci projections.
Indicators Show Neutral Momentum
The Relative Strength Index (RSI) is at 44, slightly below the midpoint of 50. This suggests weaker momentum but not oversold conditions. A fall toward 30 would show heavier selling, while a push above 50 would indicate strength returning.

Meanwhile, the MACD reading shows the line at -0.0035 and the signal line at -0.0051, with the histogram at 0.0016. The near-zero values point to consolidation. The MACD is close to crossing upward, which would suggest fading bearish pressure if it continues.
Leverage and ETF Developments
Data from Coinglass shows trading volume down 10% to $465 million, while open interest is down 5% to $314 million. Liquidation data for 26 August shows $10K in short liquidations and $1K in long liquidations across Binance and Bybit.

Notably, the largest recent spike came in mid-July, when millions in positions were liquidated during a surge above $0.45. Since then, liquidation levels have eased, with more pressure on short positions.
Separately, a filing for the Canary American-Made crypto ETF was reported by Eric Balchunas. The spot fund would list the US-origin tokens, such as Stellar. Balchunas noted, “Get ready for ETFs to try every combo imaginable.”

