Ripple Price Analysis: XRP Primed for One Final Explosive Rally Before Major Correction Hits
XRP teeters on the edge of a make-or-break moment—technical indicators scream final pump before the floor drops out.
The Setup
Ripple's token shows classic exhaustion pattern signals—overbought momentum meeting critical resistance levels that historically precede sharp reversals. Trading volumes suggest speculative frenzy rather than organic growth.
The Countdown
Watch for that last-gasp rally pushing toward previous highs before reality sets in. Pattern similarities to 2021's blow-off top look downright eerie—because nothing says 'healthy market' like repeating past mistakes.
The Aftermath
When correction hits, it won't be gentle. Support levels below current price point suggest a painful reckoning for late entrants. Because in crypto, the only thing more predictable than hype cycles is the cleanup afterward.
Technical Analysis
By Shayan
The USDT Pair
On the USDT chart, Ripple’s token has been consolidating within a symmetrical triangle, positioned just beneath the upper boundary of the broader ascending channel that has guided the price action in recent months. Since symmetrical triangles can resolve in either direction, the next decisive breakout will determine the market’s trajectory.
Currently, XRP is trading above both the 100-day and 200-day moving averages, which have recently shown a bullish crossover. This setup favors a breakout to the upside, potentially carrying the price beyond both the triangle and the larger channel. However, if XRP falls back below these moving averages, the outlook WOULD turn bearish, opening the door for a decline toward the $2.10 support zone.

The BTC Pair
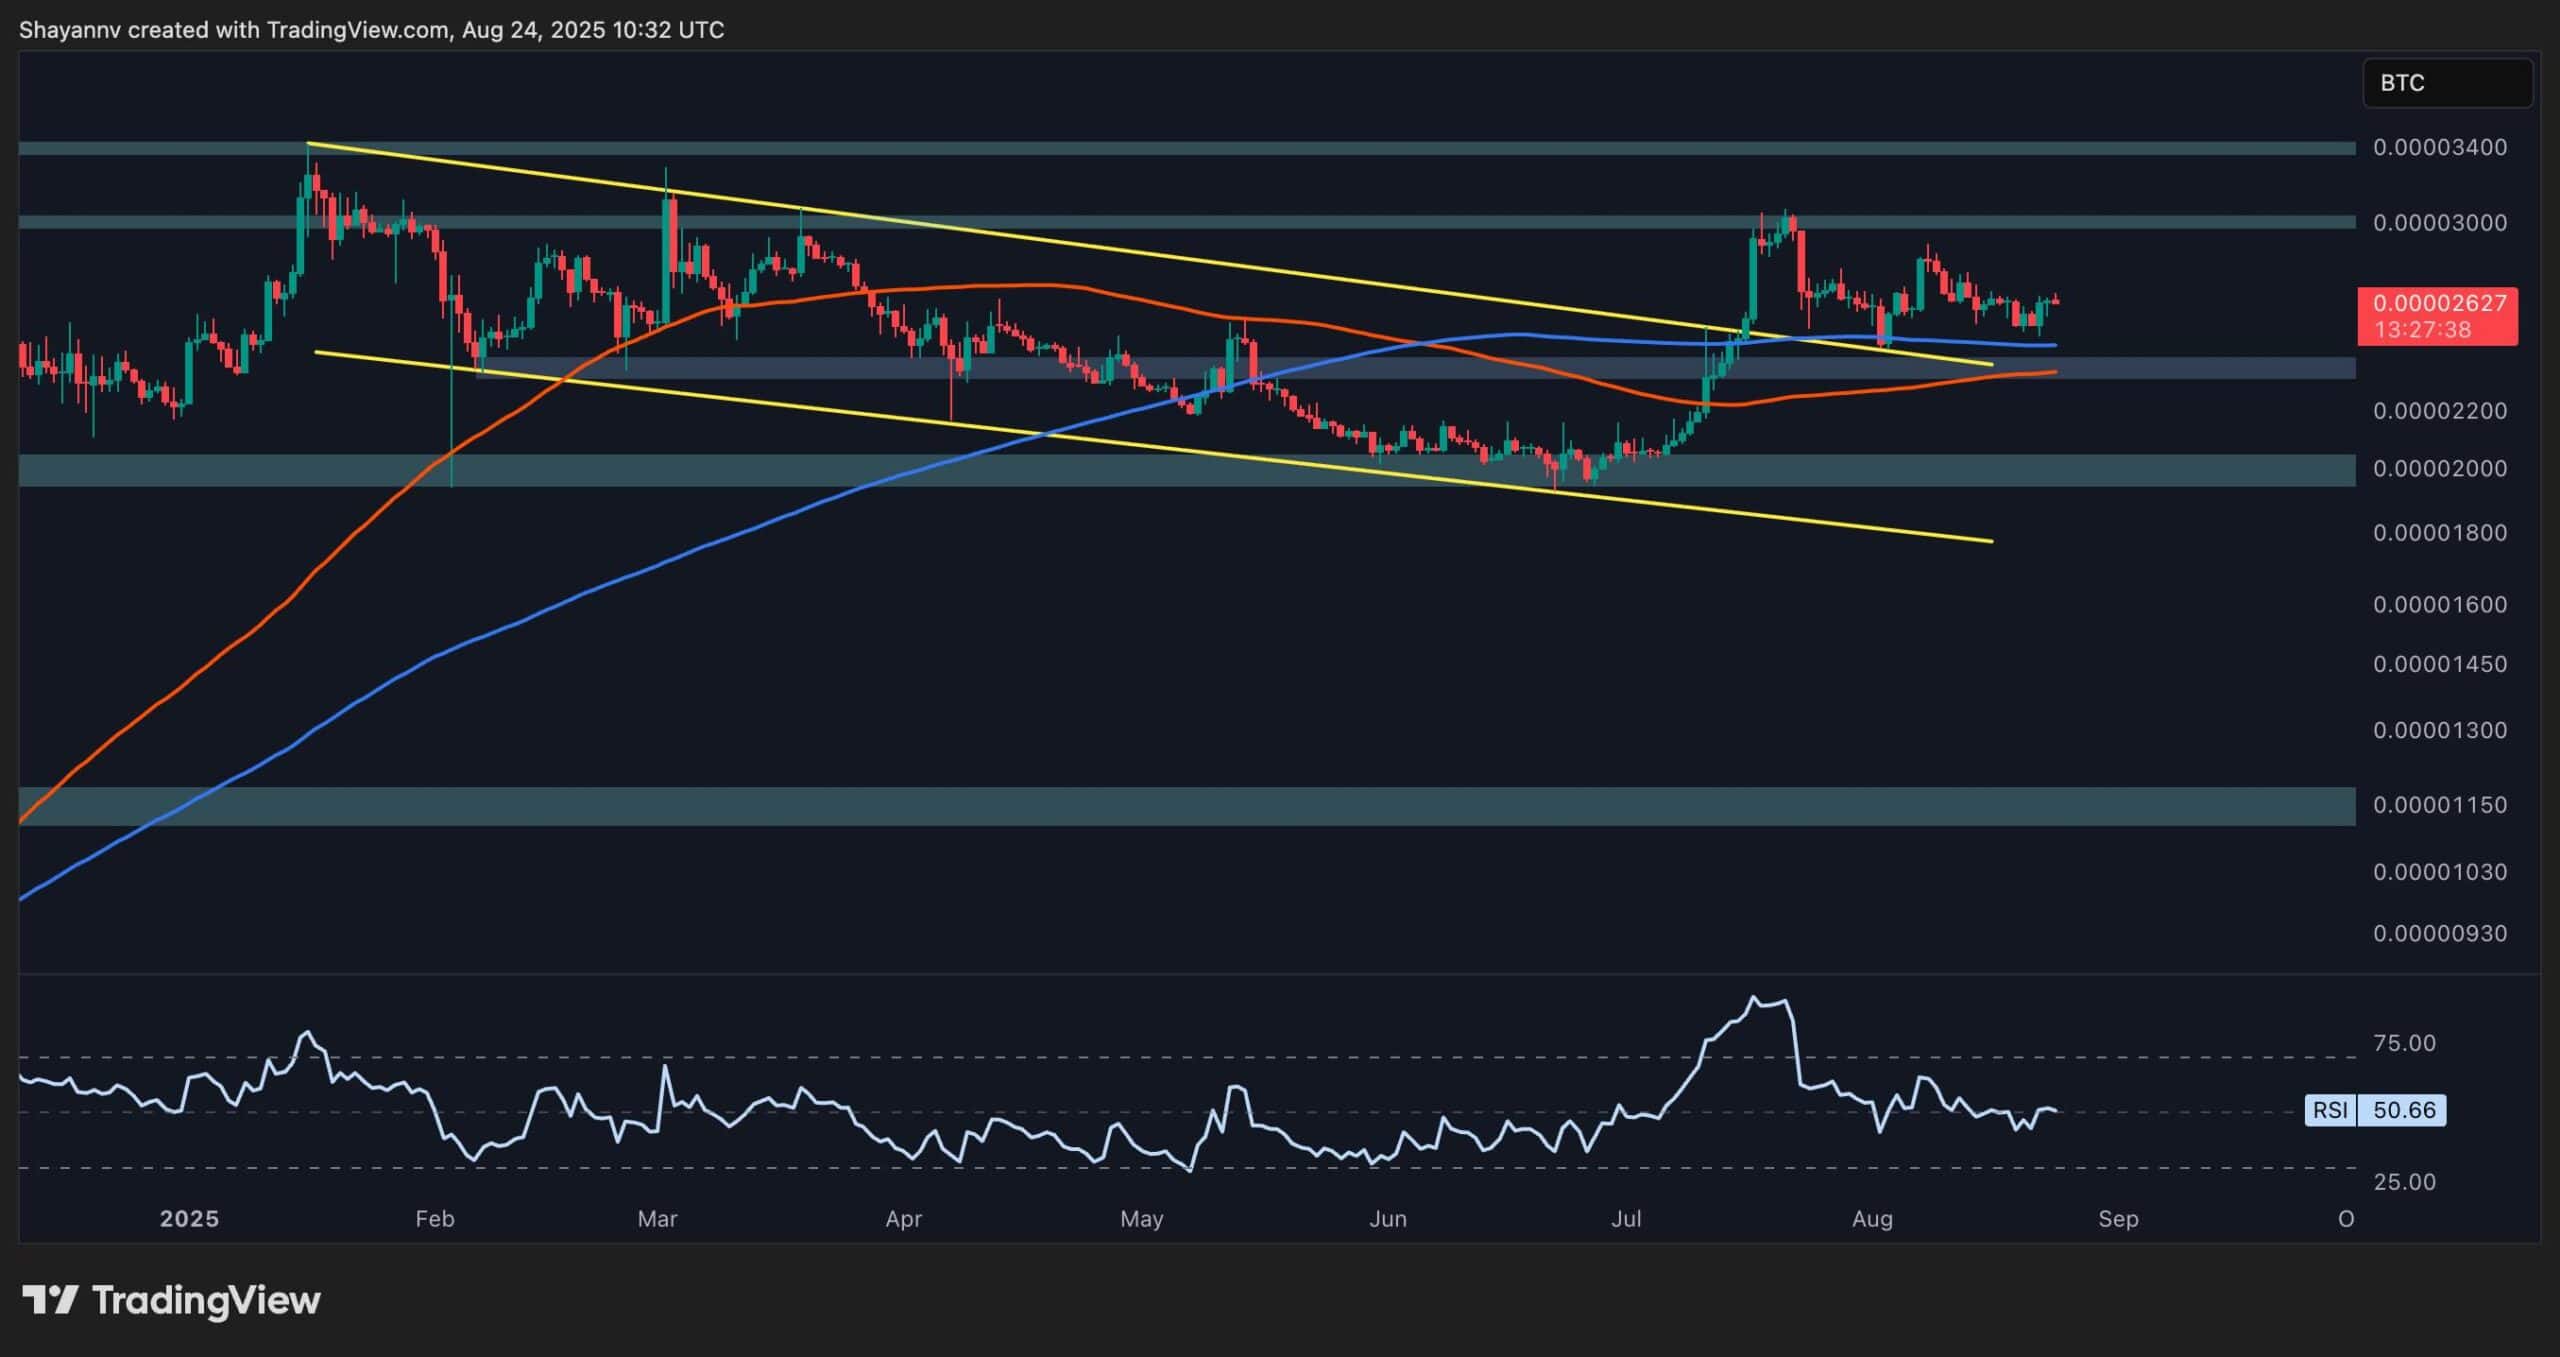
On the XRP/BTC chart, the price has also been consolidating, mirroring the USDT pair’s behavior after breaking out of a descending channel and moving above both the 100-day and 200-day moving averages. The key difference here is that these moving averages have not yet formed a bullish crossover, suggesting the market may not be ready for a decisive breakout just yet.
Still, with the asset holding above both moving averages and the critical 2,400 SAT support area, the outlook remains constructive. If momentum builds, a rally toward the 3,000 SAT level seems likely, with even a potential retest of the 3,400 SAT resistance zone on the table.


