Bitcoin Price Analysis: This Critical Resistance Holds the Key to BTC’s Next All-Time High Breakout

Bitcoin bulls face their ultimate test as a formidable resistance level stands between current prices and historic new highs.
The Make-or-Break Barrier
Market analysts identify this technical ceiling as the final gatekeeper before BTC can challenge its previous all-time high. Trading volumes suggest institutional accumulation beneath this level—smart money positioning for the inevitable breakout.
Technical Tug-of-War
Each rejection at resistance strengthens the eventual breakthrough, creating coiled-spring energy that typically unleashes violent upside moves. The pattern mirrors previous cycle breakouts that saw 40-60% rallies within weeks.
Traditional Finance's Persistent Blind Spot
While Wall Street still debates Bitcoin's 'intrinsic value'—as if fiat currencies backed by nothing but government promises have any—the network processes another block of irreversible settlements. Some things never change, except your portfolio's purchasing power against real assets.
The countdown to conquering resistance begins now.
The Daily Chart
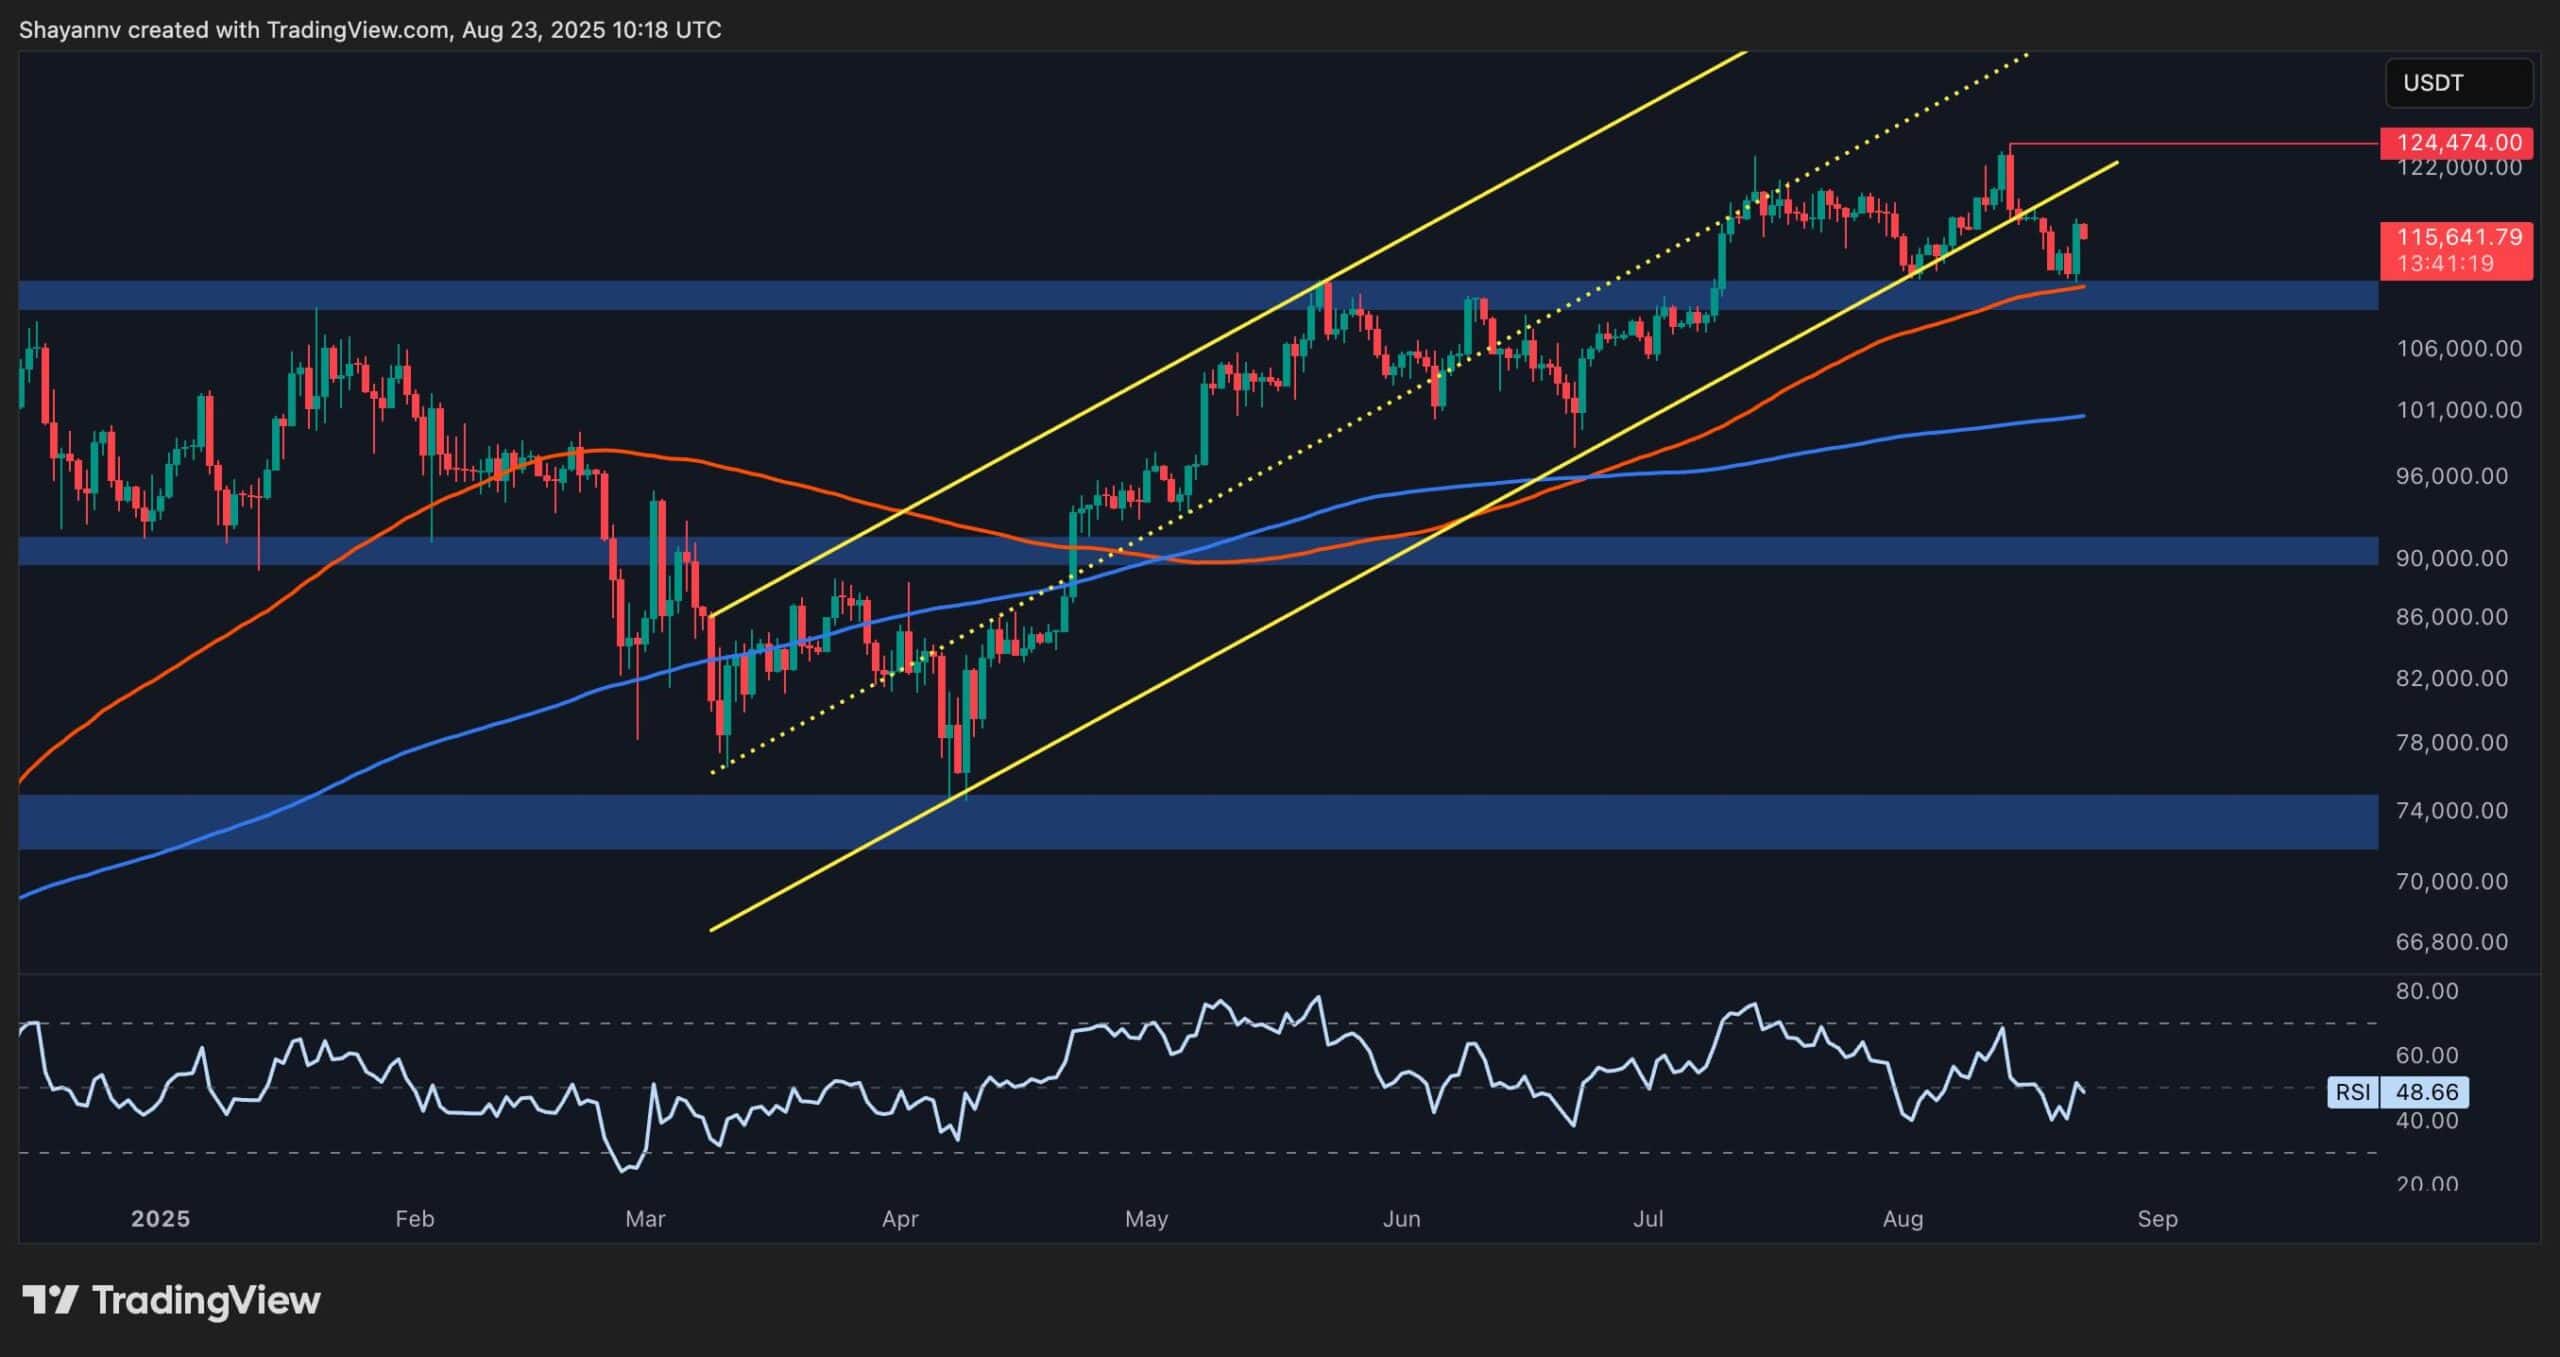
On the daily chart, Bitcoin has recently broken below its long-term ascending channel, signalling a potential trend reversal. Yet, with the likelihood of an upcoming interest rate cut, the price has rebounded strongly from the $110K support zone, which also aligns with the 100-day moving average.
At the same time, the RSI is hovering NEAR 50, reflecting market indecision and neutral momentum. As long as the price remains beneath the lower boundary of the broken channel, the risk of a deeper decline, with the 200-day moving average being a potential target near the $100K area, persists. However, if the current rebound gathers strength, a rally toward the $130K region and possibly higher remains a likely scenario.
The 4-Hour Chart
The 4-hour chart highlights the recent price action with more clarity. As soon as bitcoin touched the $112K support, which aligns with the major low from early August, the market reacted sharply to the interest rate news, triggering a nearly vertical rally toward the $117K resistance zone.
While momentum currently favors the buyers, the $117K level remains a key hurdle. If this resistance holds, the price could easily retreat back to the $112K support level or even lower. A decisive breakdown of this support zone WOULD likely trigger a wave of long liquidations, potentially driving the market down toward the critical $100K level, which is the make-or-break area for the broader uptrend.

Onchain Analysis
Funding Rates
Bitcoin’s funding rates have remained consistently positive for an extended period, showing that the derivatives market continues to lean toward bullish positioning. While there have been small liquidation phases along the way, these corrections have not shifted the overall bias, as the futures market sentiment is still positive.
What’s notable is that the magnitude of the current funding rates is nowhere near the extreme peaks observed during previous major price tops. This suggests that the market is not yet overly overheated, leaving room for the bullish trend to continue potentially.
However, in a positive funding environment, the risk of a liquidation cascade always lingers. If key support levels break, long traders could be forced out rapidly, intensifying the downside MOVE and triggering a sharp correction.

