Bitcoin at a Crossroads: BTC Battles Key Support Level Following Record-Breaking Rally
Bitcoin's bull run hits a speed bump as prices test make-or-break support.
After notching yet another all-time high, BTC faces its first real test of conviction. The king of crypto now dances on a critical support level—break below here, and the bears might finally get their moment.
Market watchers are split: some see this as healthy consolidation before the next leg up, while others spot early warning signs of exhaustion. Meanwhile, traditional finance pundits—still waiting for that 'imminent collapse' they've predicted since 2013—adjust their Bloomberg terminals and pour another martini.
One thing's certain: volatility's back on the menu. Whether this is the pause that refreshes or the start of something uglier depends entirely on whether buyers defend this line in the sand.
The Daily Chart
On the daily chart, Bitcoin is once again testing the lower boundary of its long-term ascending channel, raising the possibility of a downside breakout after months of holding within the structure. Should the breakdown materialize, the $110K region, backed by the nearby 100-day moving average, could serve as a strong support area.
Conversely, if the channel manages to contain the price, the bullish momentum may continue, paving the way for new highs toward $130K and potentially further.
The 4-Hour Chart
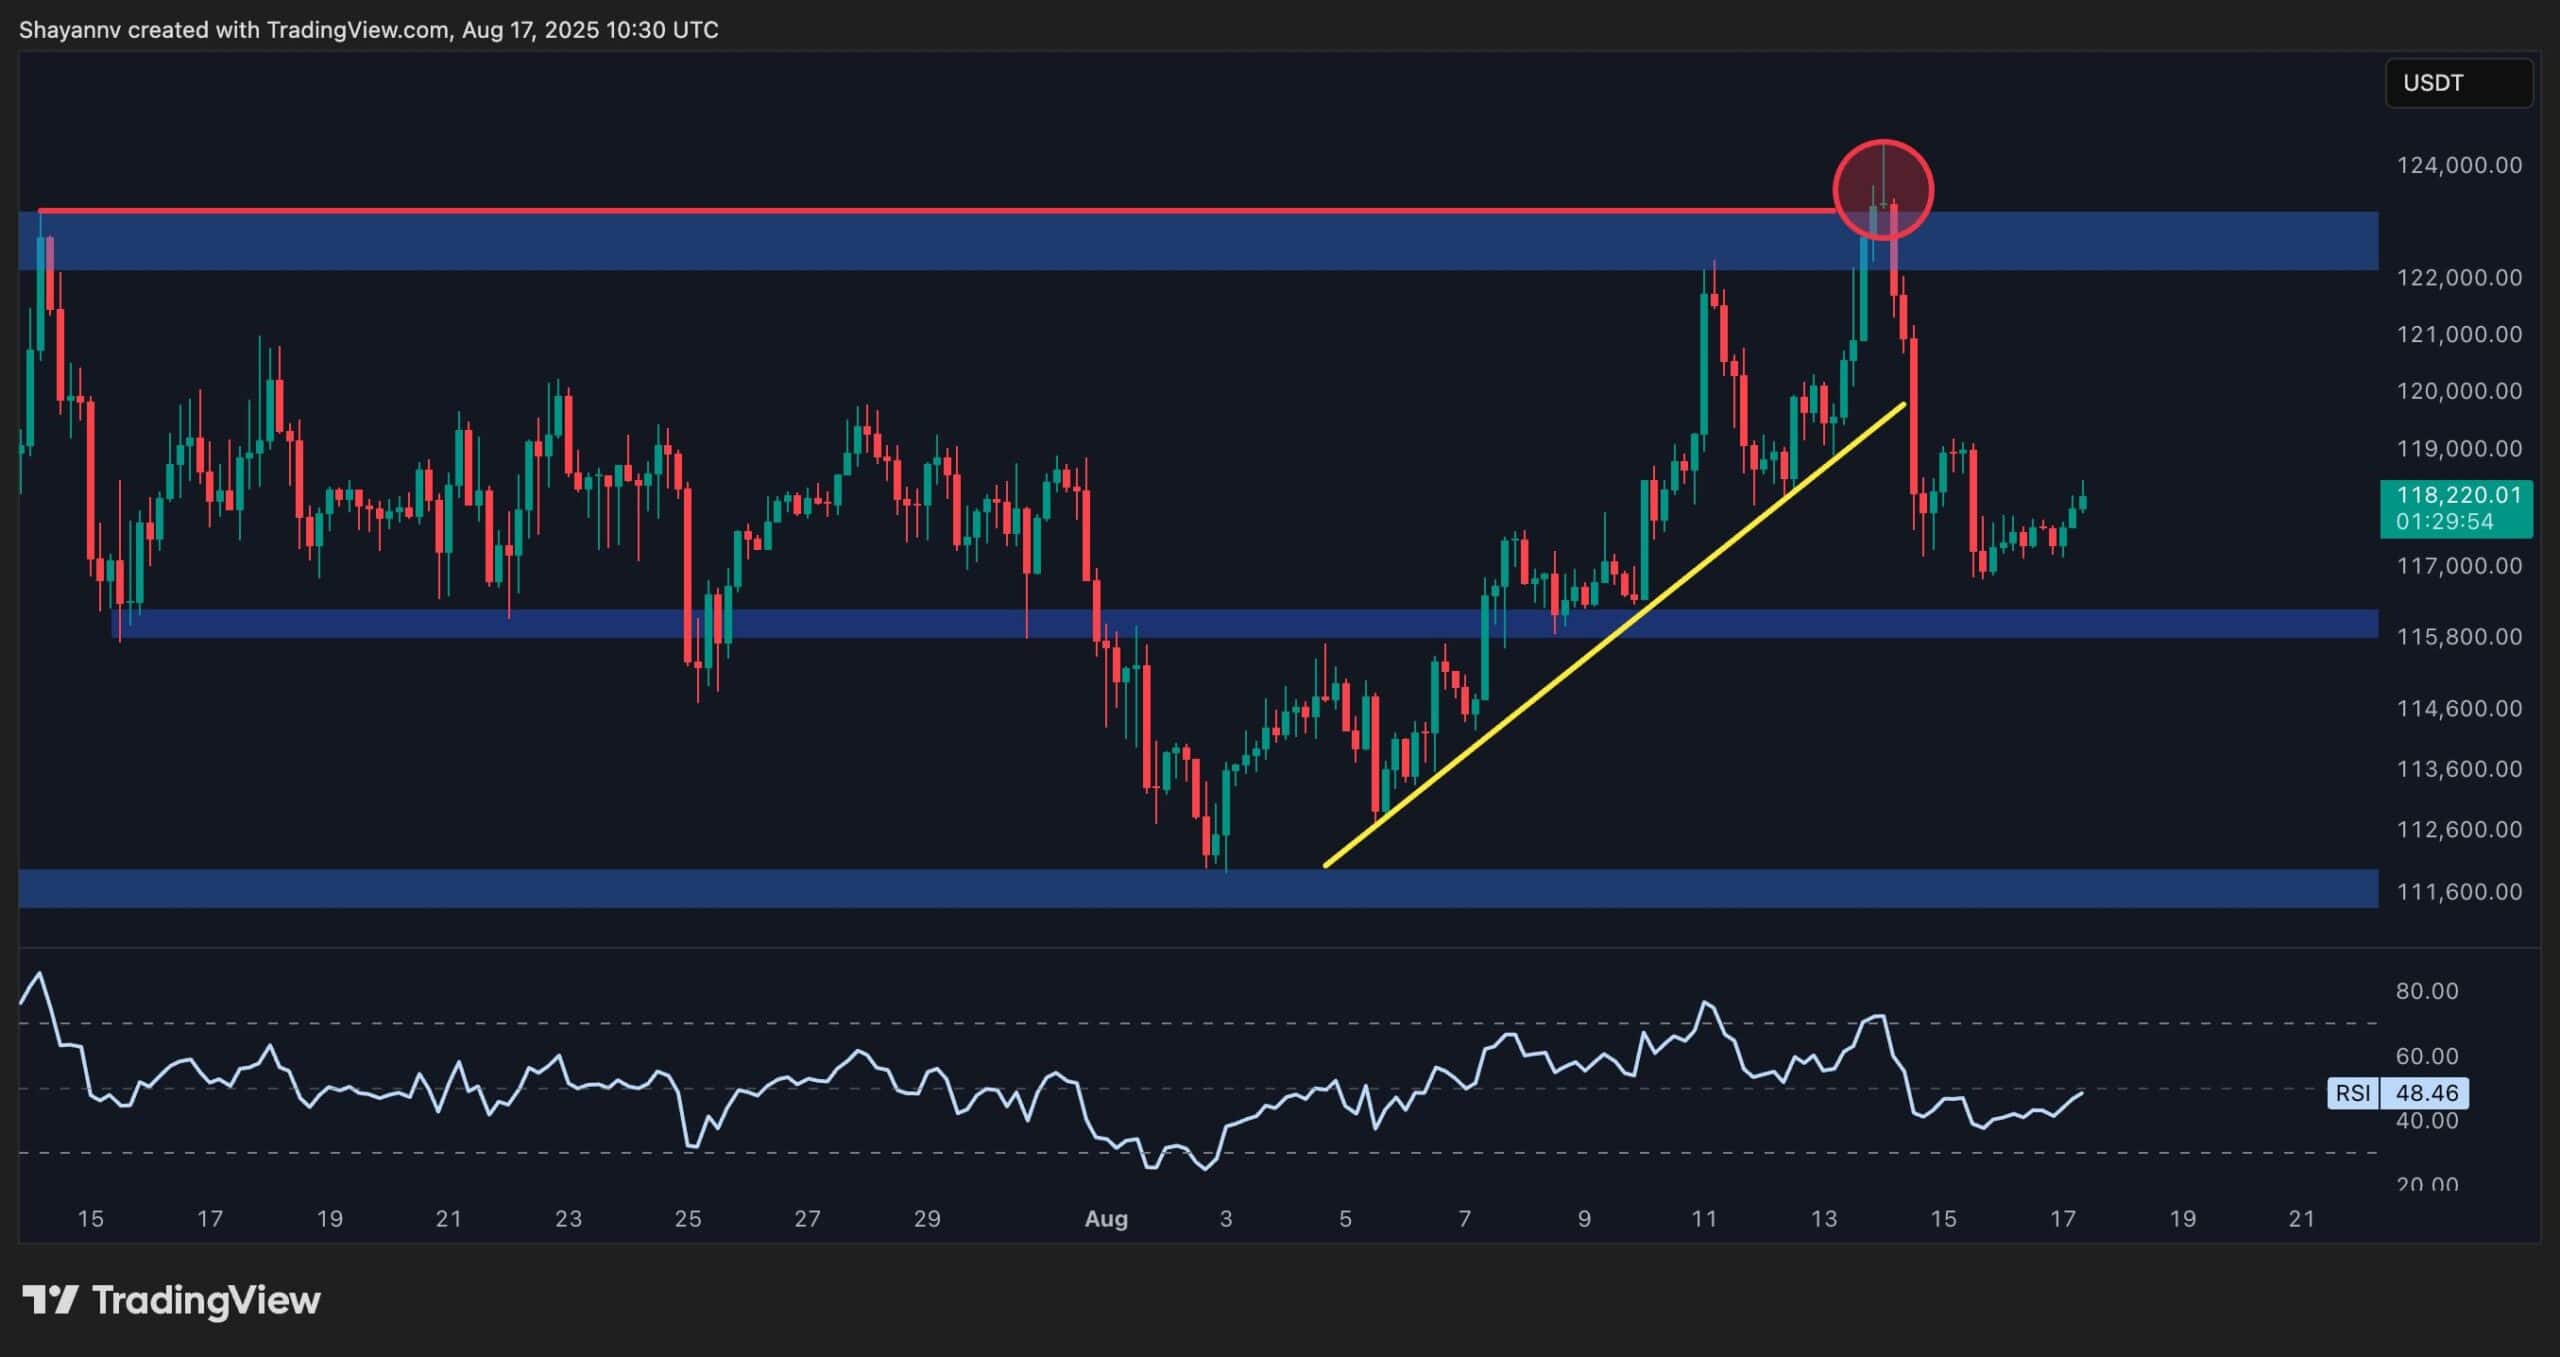
On the 4-hour timeframe, BTC recently attempted a breakout above the $123K resistance but quickly failed to sustain it, resulting in a sharp decline that also broke the short-term trendline built over the past few weeks. This rejection signals weakness at the highs and has shifted the market’s short-term structure.
At the moment, the $116K area stands out as the key support that could trigger another bounce. If this level gives way, however, a deeper drop toward the $111K region becomes increasingly likely. With the RSI recovering after dipping below 50, the price action suggests a possible retest of $116K before confirming the next move. Whether this support holds or breaks will set the tone for Bitcoin’s short-term trend.
On-chain Analysis
Bitcoin Open Interest
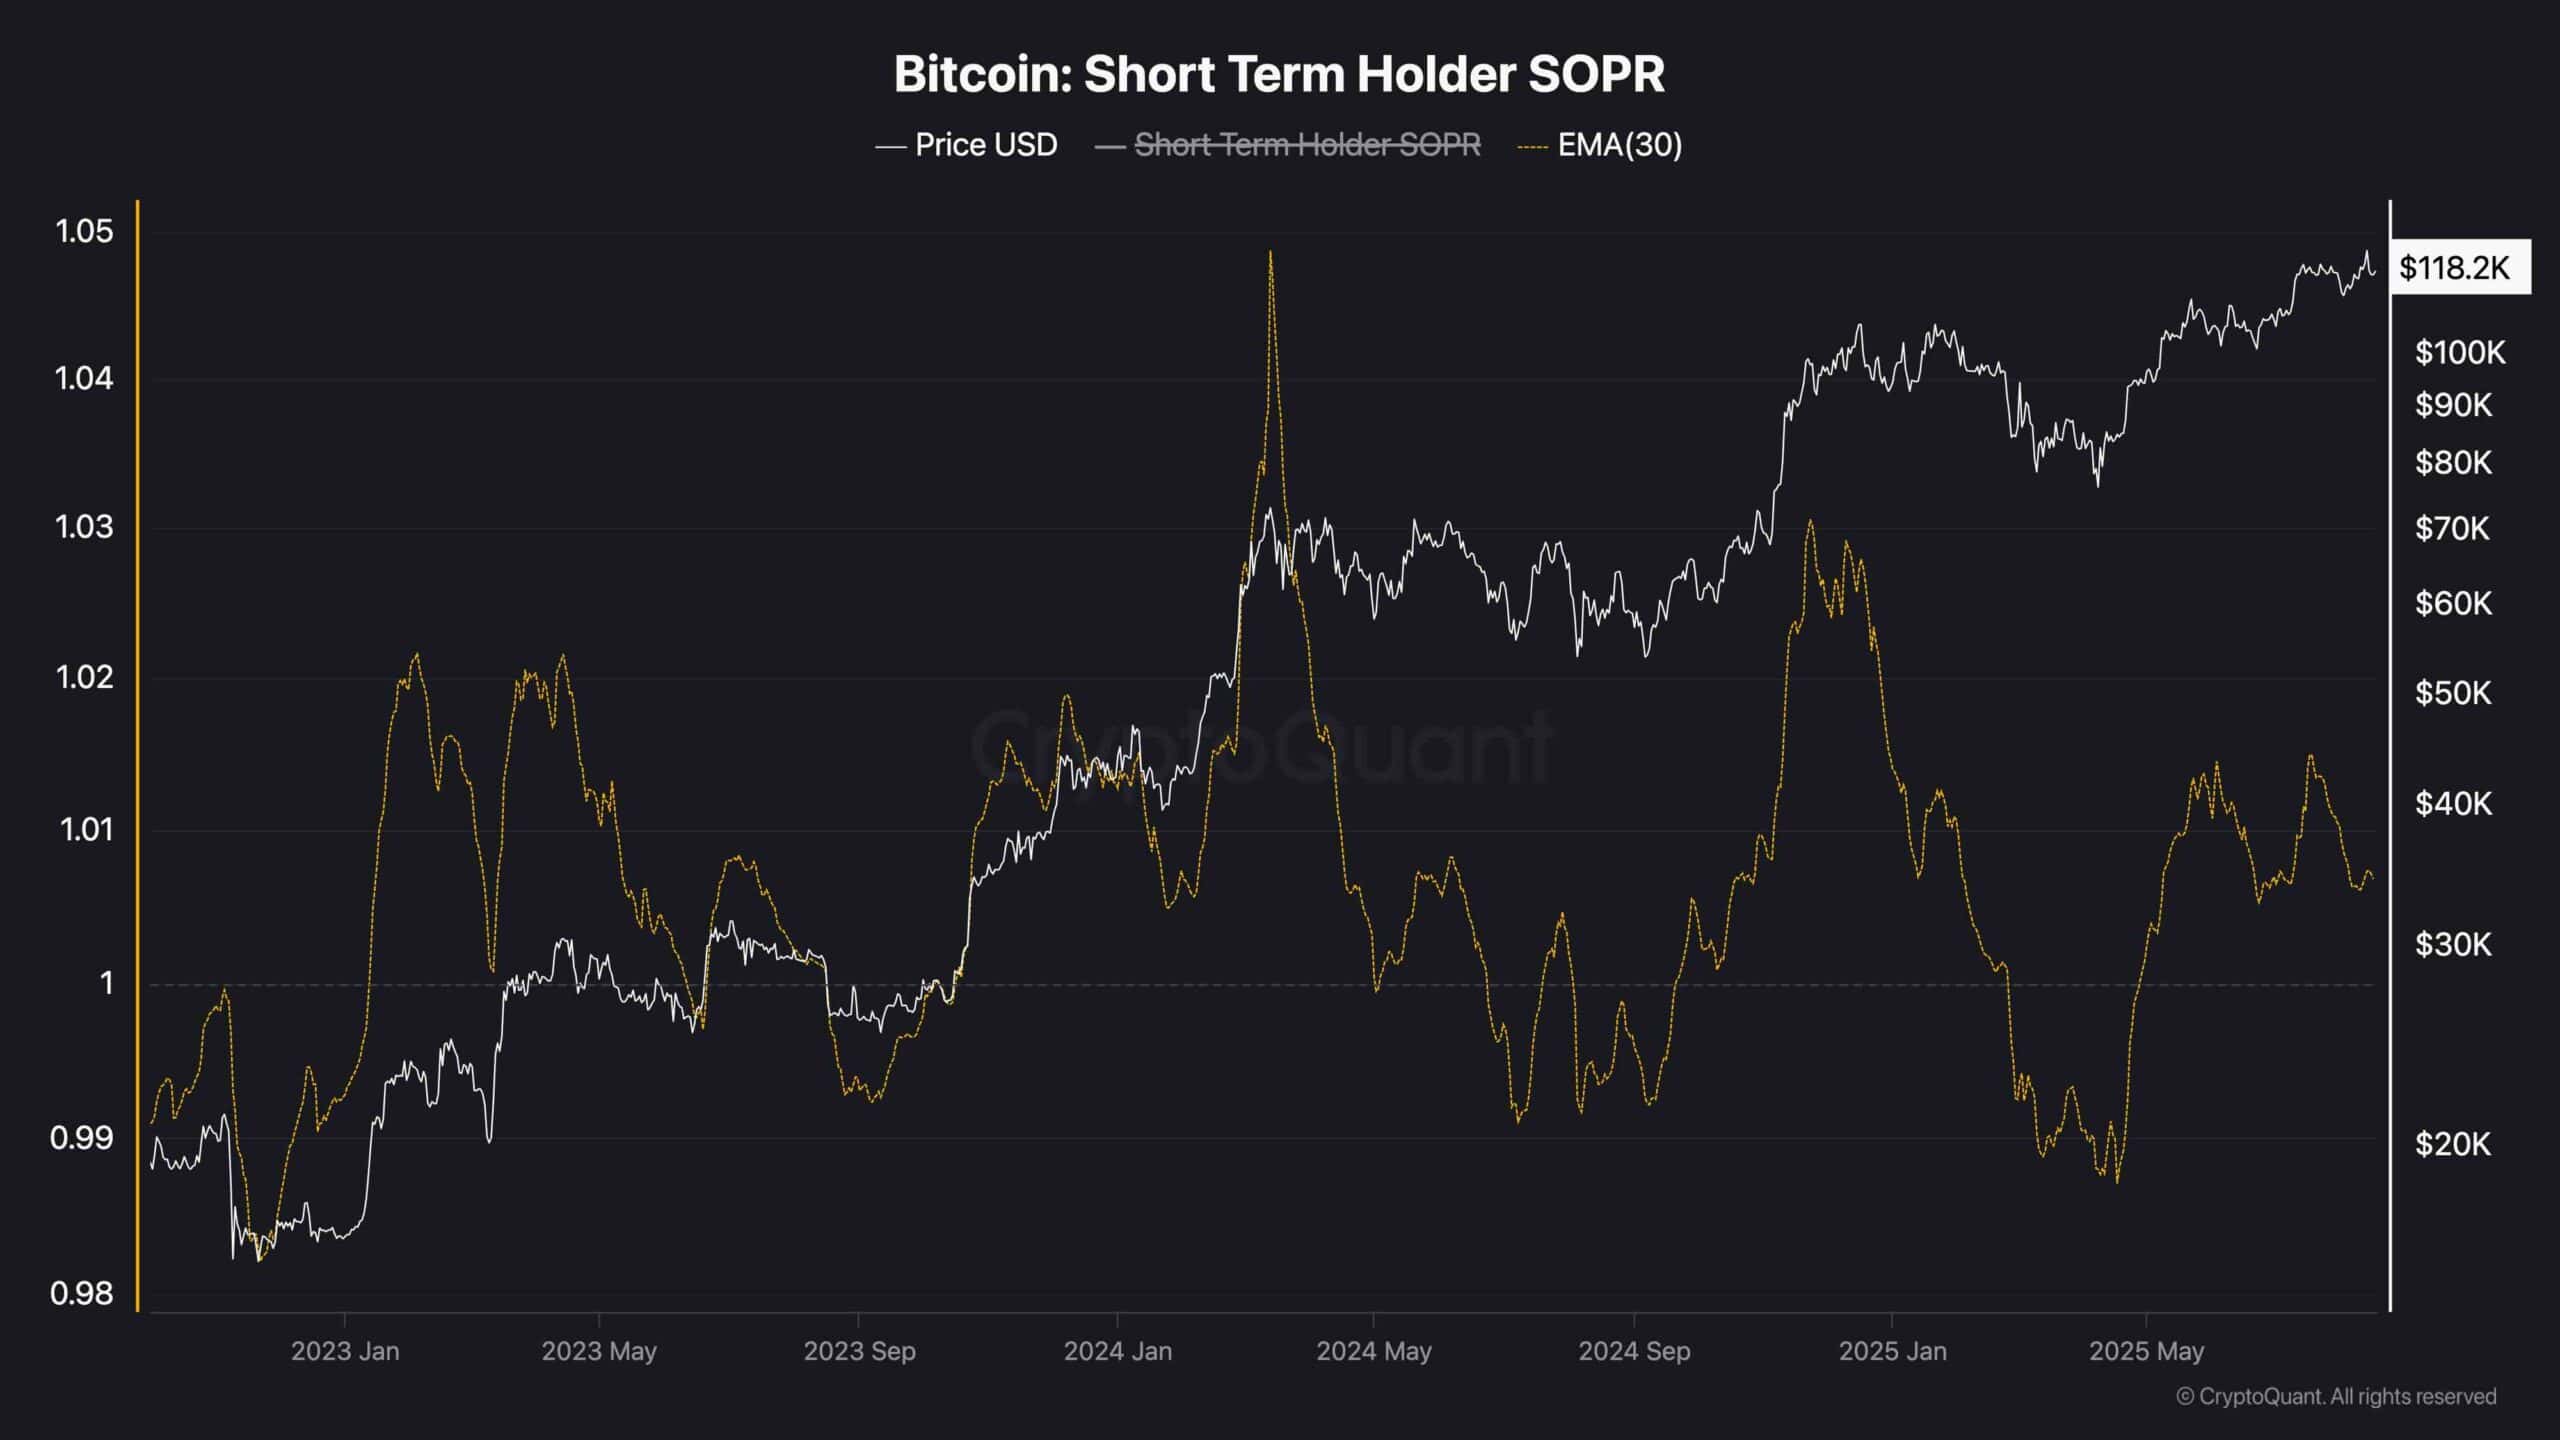
This chart shows Bitcoin’s Short-Term Holder SOPR with its 30-day EMA compared to price. SOPR above 1 means short-term holders are selling at a profit, while below 1 signals selling at a loss.
During rallies like early 2023, SOPR stayed above 1, confirming profit-taking. In contrast, dips below 1 mark short-term capitulation during corrections. Now, with bitcoin around $118K and SOPR hovering above 1, short-term holders are taking profits.
However, the magnitude of the profit taking has been declining during the recent price highs since the beginning of 2024. This observation is evident as there is a clear divergence between the price highs and STH-SOPR highs. With the profit margins shrinking for the short-term holders, the market might soon be in trouble, as this can be one of the early signs of reversal.

