🚀 Bitcoin Primed for Liftoff: Can BTC Hit $130K Before Friday?

Bitcoin's chart screams volatility—and traders are betting big on a parabolic move. Here's why the stars might align for a historic breakout.
The setup: BTC's consolidating at a critical inflection point. Every previous squeeze at these levels preceded double-digit rallies.
The catalyst: Liquidity pools cluster around $130K like Wall Street bankers at an open bar. Market makers love hunting these obvious targets.
The wildcard: Institutional FOMO. When pension funds start chasing momentum (usually late), even cynical traders hold their noses and buy.
One hedge fund manager muttered: 'We'll pretend it's a hedge against inflation while secretly praying for meme coin gains.' The market delivers irony faster than Fed printers deliver dollars.
Bitcoin Price Analysis: Technicals
By Shayan
The Daily Chart
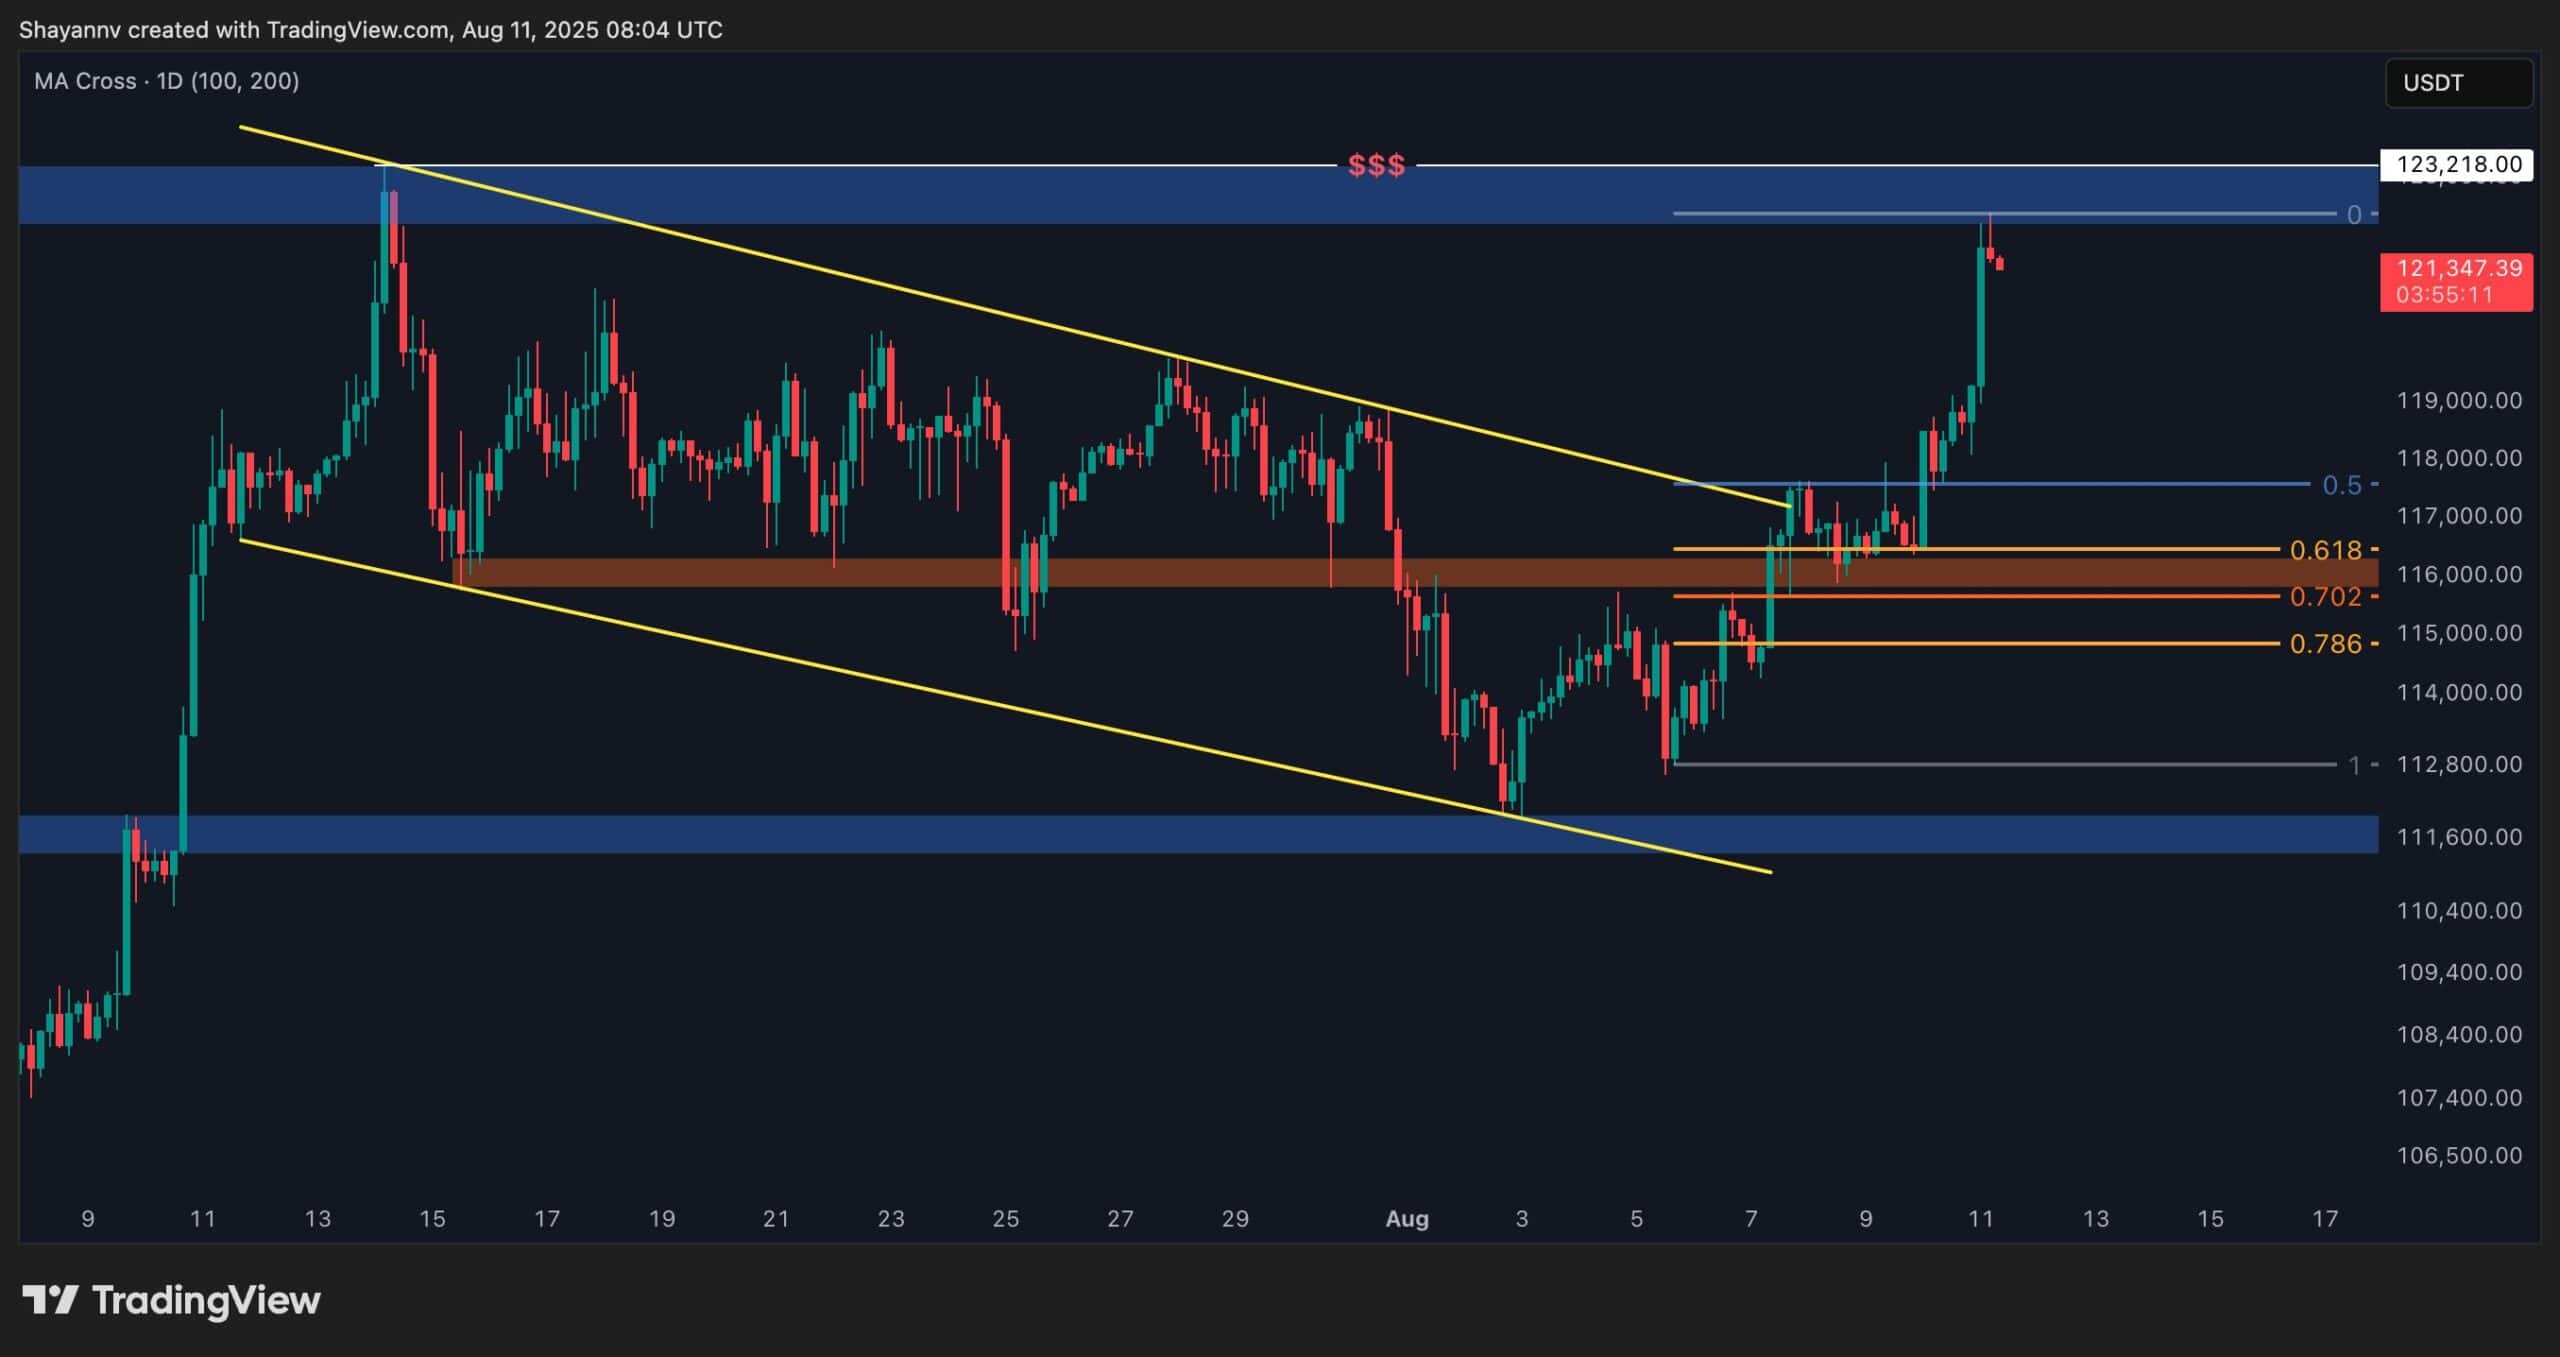
Bitcoin continues to trade within a well-defined ascending price channel, printing consistent higher highs and higher lows. T
he latest upward leg began after the price rebounded from the channel’s lower boundary, which aligned with the $112K bullish breaker block. This rebound fueled a sharp rally, carrying Bitcoin to its all-time high around $123K.
This level represents a key supply zone where profit-taking and distribution are likely to emerge, potentially leading to a short consolidation phase. Should the price decisively clear this barrier, the next upside target lies near $130K.

The 4-Hour Chart
On the lower timeframe, Bitcoin’s bounce from the $112K flag support triggered a breakout above the pattern, confirming a bullish continuation signal. Price action has now reached the ATH zone, where sellers are countering strong demand, creating a tug-of-war at this level.
A rejection here could initiate a corrective MOVE toward the $116K–$117K range, aligning with the 0.5–0.618 Fibonacci retracement. Alternatively, a clean breakout above $123K could spark a short-squeeze, accelerating the move toward higher resistance levels.
On-chain Analysis
By Shayan
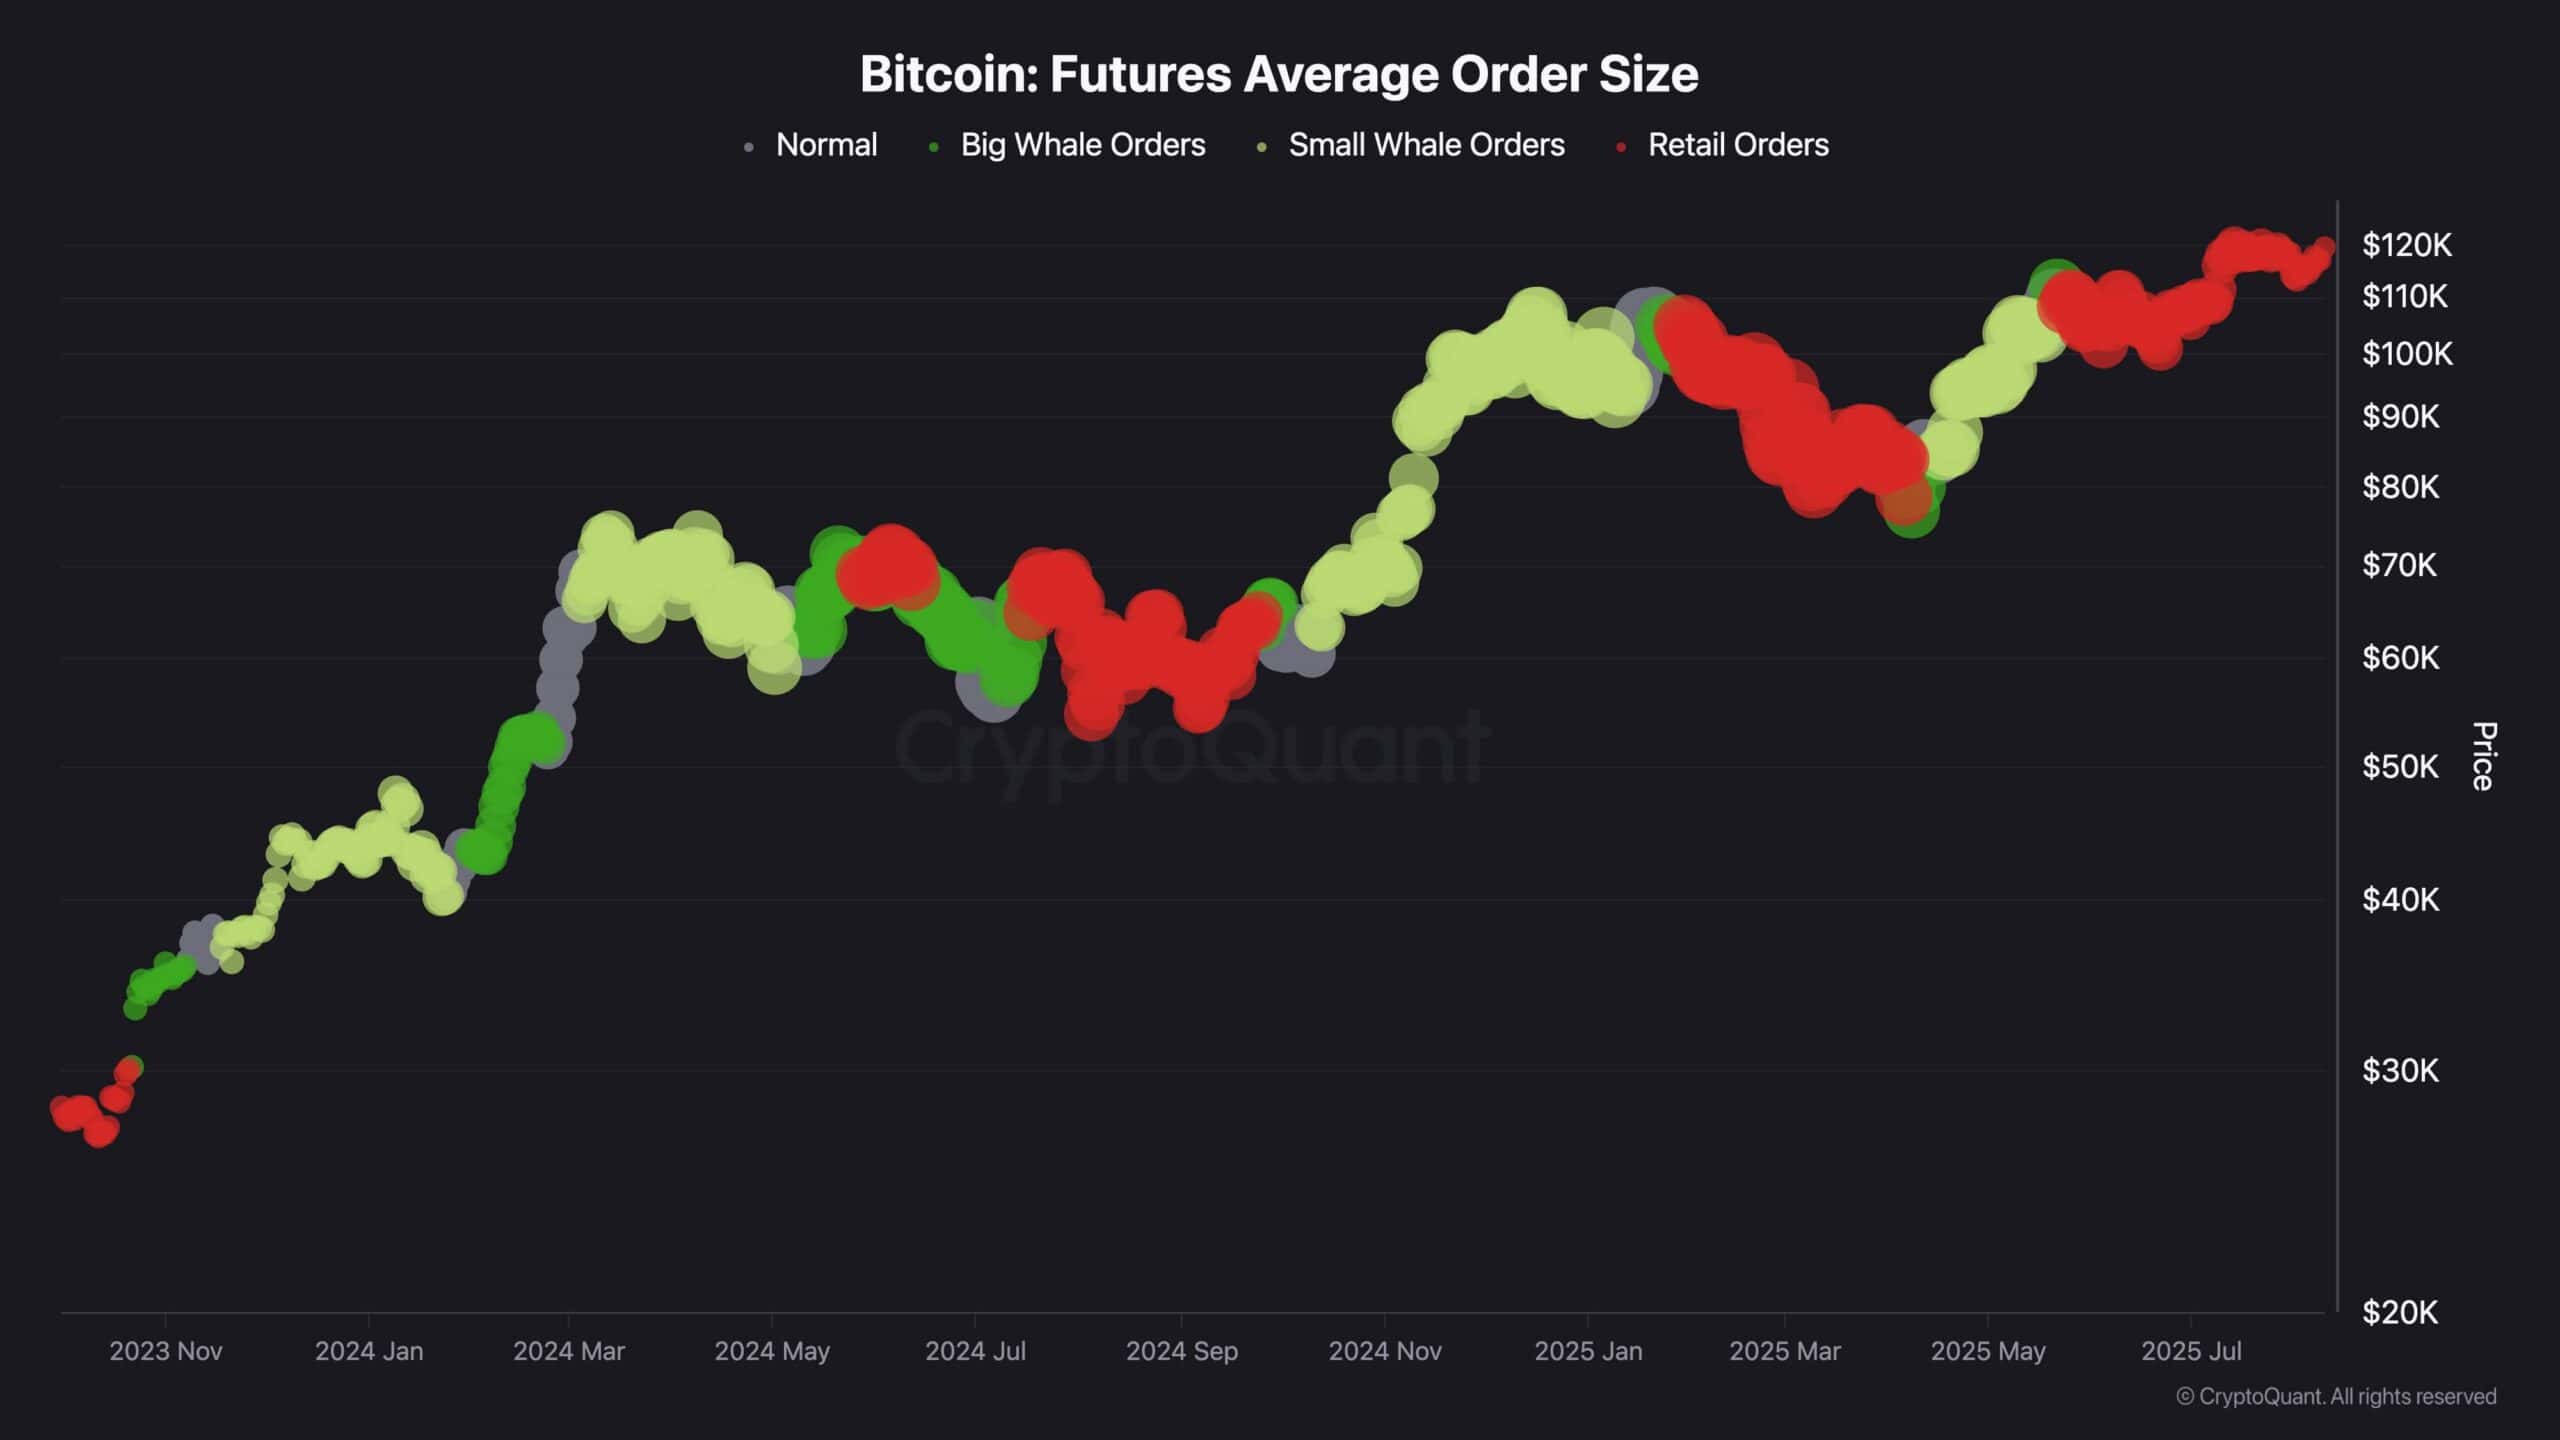
This metric measures the average executed order size in BTC futures markets, calculated by dividing total traded volume by the number of executed orders. It helps determine whether trading activity is dominated by retail participants or large-scale whales.
Over the past several months, the market has shifted from whale-driven activity to heavier retail participation. Large yellow and green clusters observed in late 2024 and early 2025 corresponded with substantial whale inflows, fueling strong bullish rallies.
In recent weeks, however, there has been a noticeable rise in red clusters, indicating that smaller, retail-sized orders are taking a larger share of market activity. Historically, extended whale dominance near market peaks often coincided with distribution phases and local tops.
Since late Q2 2025, whale involvement has diminished, suggesting that institutional or large buyers may be holding existing positions from lower levels or waiting for more favorable re-entry points. This dynamic leaves bitcoin in a position where a bullish breakout above its prior ATH could materialize in the coming weeks, unless renewed whale activity emerges to offload positions, triggering a distribution phase.