XRP at a Crossroads: Is Ripple’s Next Explosive Move Brewing in This Consolidation Phase?

XRP traders, buckle up—Ripple's token is coiled like a spring. After weeks of sideways action, the charts whisper: volatility incoming.
Key levels to watch
The $0.55 support held firm last week—three separate tests, zero breakdowns. Meanwhile, whales accumulated 120M XRP during Tuesday's dip. Classic accumulation play or desperate bag-holding? (We see you, 2017 bulls.)
Make-or-break moment
Daily Bollinger Bands pinch tighter than a Wall Street CFO during audit season. When this compression breaks, expect fireworks. Technicals suggest 23% swing potential either way.
Regulatory wildcard
SEC v. Ripple appeals loom—because nothing says 'market efficiency' like bureaucrats deciding innovation's fate over martinis. Price could gap 15% on any news.
Bottom line: XRP's either priming for liftoff or loading the trapdoor. Smart money's watching the $0.48-$0.62 range like hawks. Your move, degens.
XRP Analysis
By Shayanmarkets
The Daily Chart
XRP recently broke above the $3.4 high in mid-July, tapping into a major liquidity pool. This upward MOVE triggered buy-side liquidity, often targeted by smart money to trigger stop-losses from over-leveraged long positions, a classic bull trap scenario.
Following this sweep, XRP faced significant selling pressure, pulling the price back toward a crucial support region around the $2.7 level, which also aligns with the 0.5 Fibonacci retracement level.
This zone is likely to act as a short-term support, leading to consolidation within the $2.7–$3.4 range. As long as this structure holds, the price is expected to range sideways, absorbing selling pressure before its next decisive move. A valid breakout above or below this range will likely lead to a strong directional move.
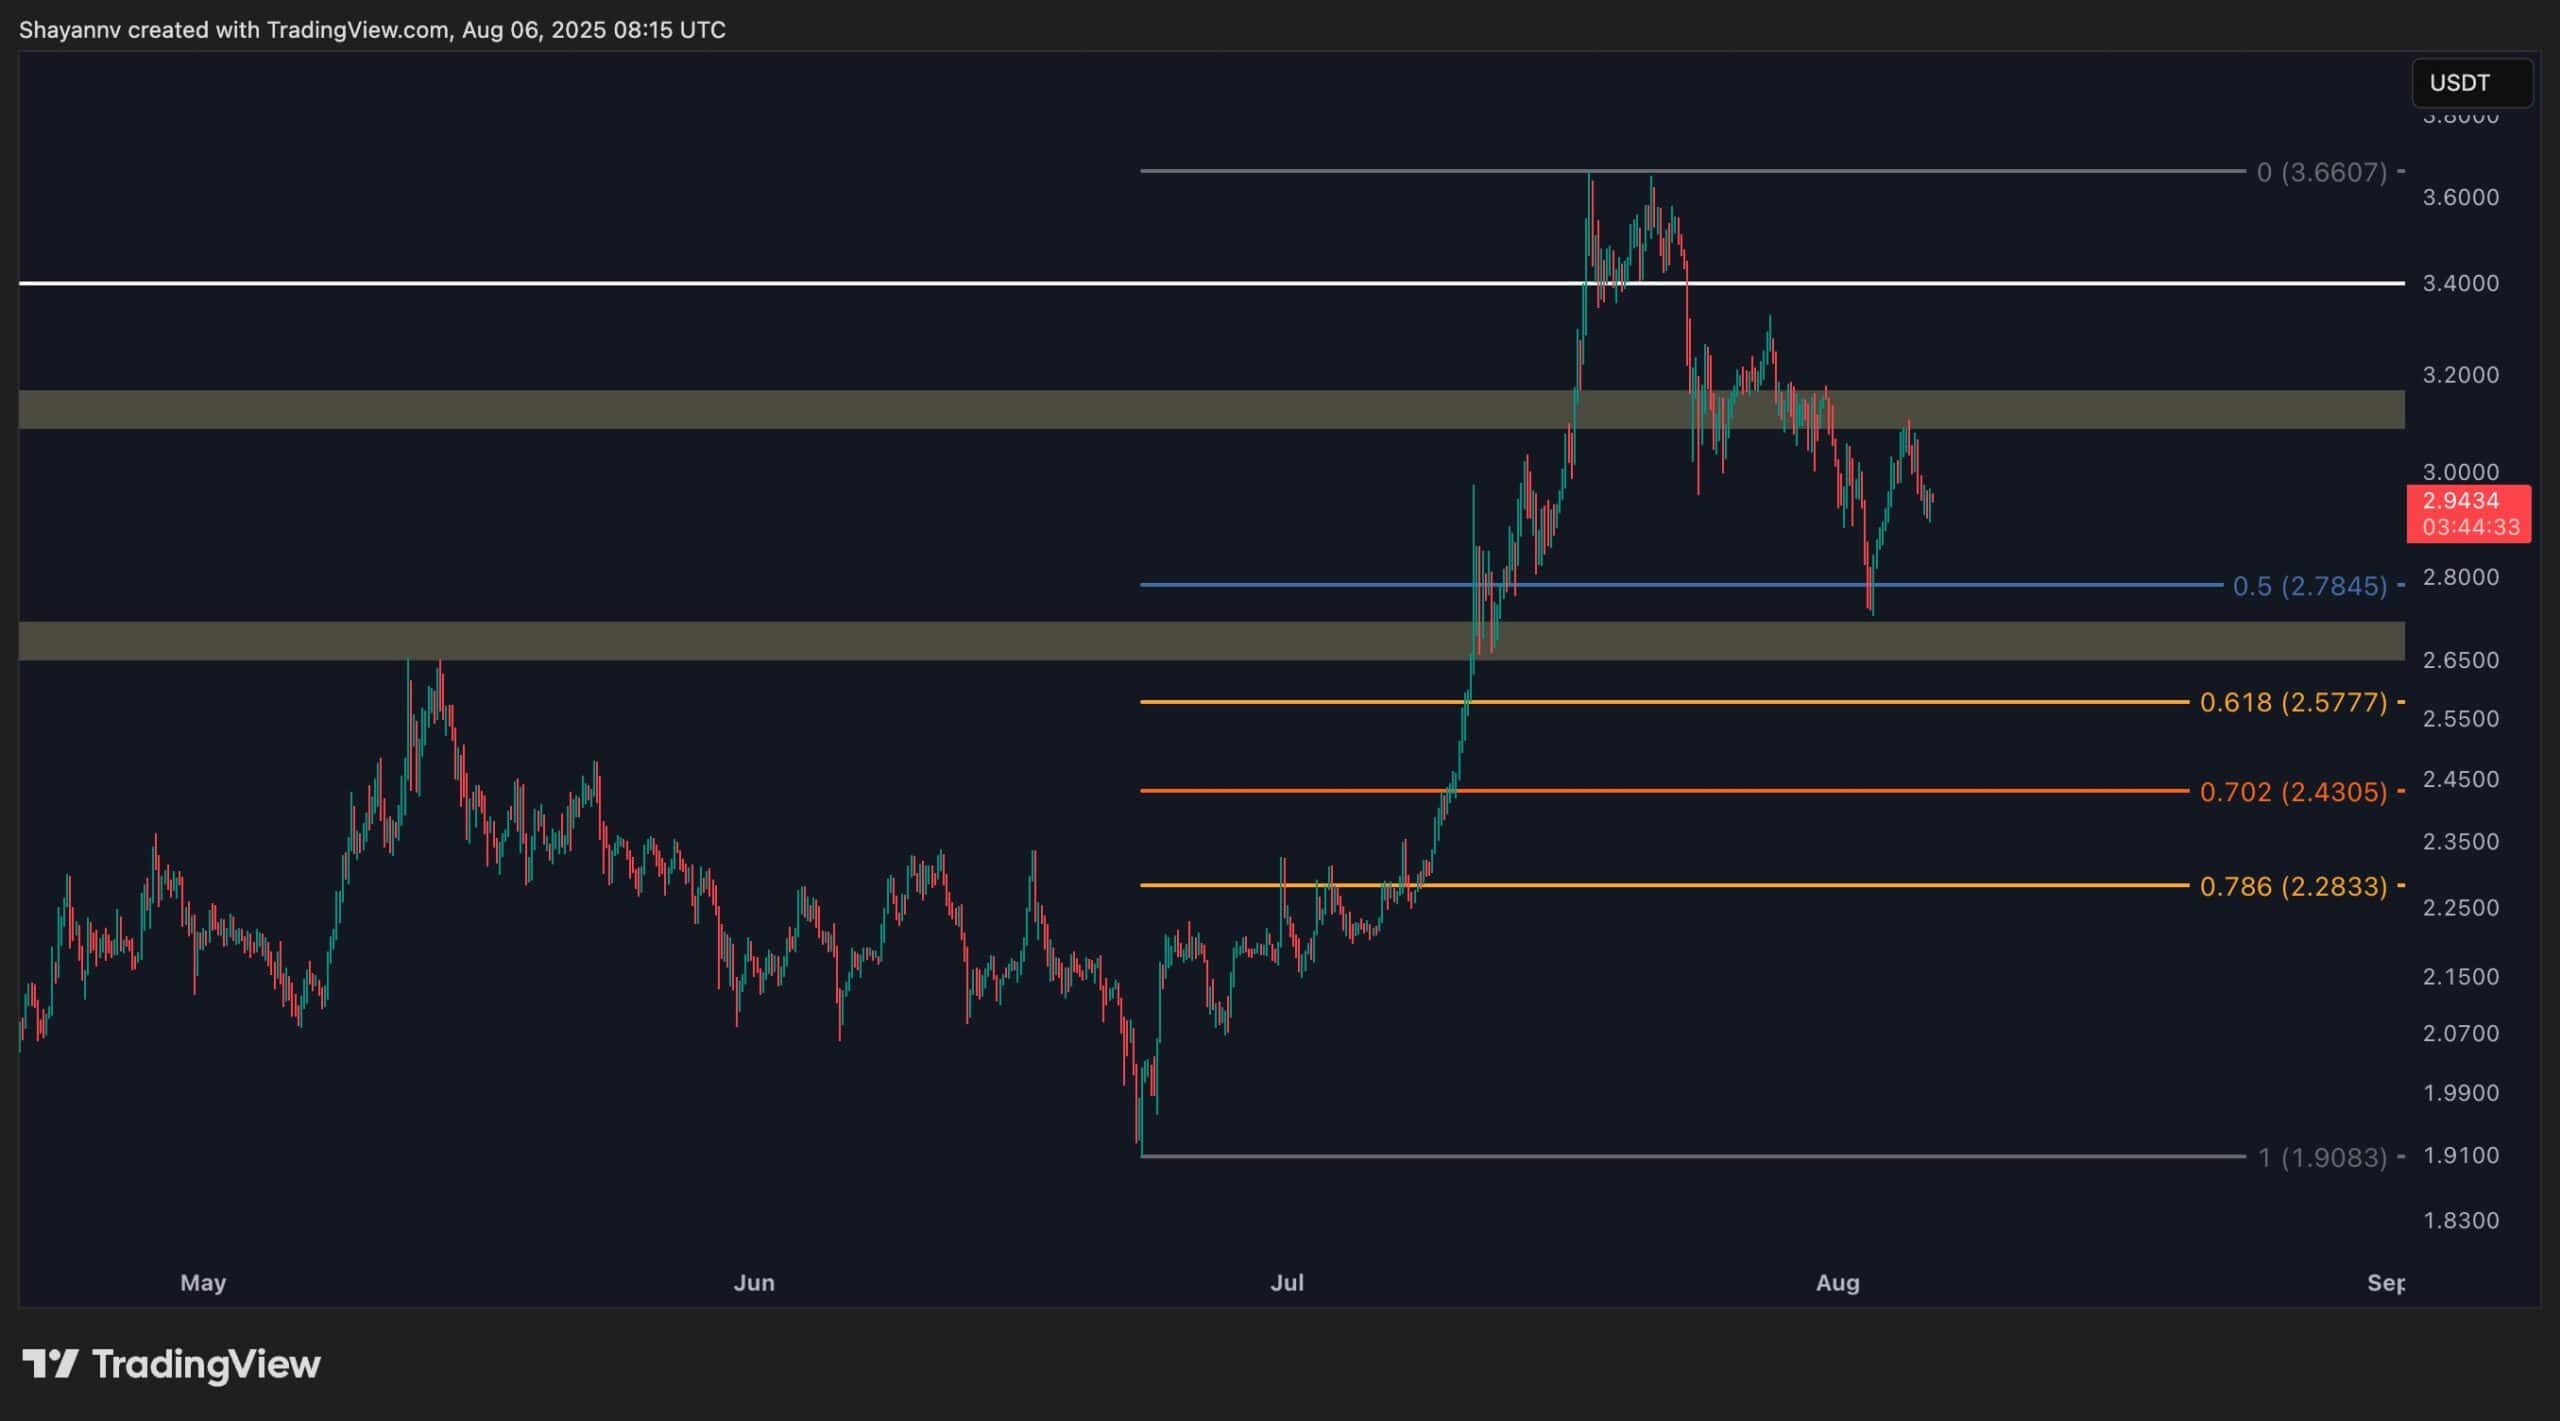
The 4-Hour Chart
Zooming into the lower timeframe, the breakout above $3.4 quickly reversed as sellers stepped in, reinforcing the idea of a bull trap. XRP has since declined sharply, finding support at the 0.5–0.618 Fibonacci retracement zone, which has triggered a minor bullish pullback.
The current price is range-bound between $2.7 (support) and $3.1 (resistance). This consolidation phase could persist unless a strong catalyst emerges.
A bullish breakout above $3.1 WOULD open the door for a retest of the $3.4 high, while a breakdown below $2.7 would expose the $2.58 support as the next key level.
This price behavior reflects classic market manipulation and liquidity dynamics, with smart money exploiting key levels. Traders should remain cautious and watch for a confirmed breakout before positioning for the next move.