Bitcoin’s Next ATH: The Make-or-Break Challenges Ahead (BTC Price Deep Dive)

Bitcoin's grinding toward a new all-time high—but the road's littered with traps. Here's what could fuel the rally... or trigger a nasty reversal.
Key Levels to Watch
The $70K psychological barrier isn't just round-number bias—it's where institutional sellers lurked last cycle. Break it cleanly, and FOMO kicks in. Stall here, and we're stuck in chop city.
Macro Wildcards
Fed rate cuts might pump crypto... unless recession fears crush risk appetite. Traders are pricing in both scenarios simultaneously—because Wall Street loves a good contradiction.
On-Chain Clues
Whale wallets are accumulating, but exchange reserves are creeping up too. Someone's preparing for a big move—the question is which direction. (Spoiler: They probably don't know either.)
The Cynical Take
If BTC dumps, 'institutional adoption' narratives will vanish faster than a Sam Bankman-Fried alibi.
Technical Analysis
By ShayanMarkets
The Daily Chart
Following a wave of heightened selling pressure, partly fueled by geopolitical tensions between Russia and the USA, Bitcoin broke below the lower boundary of its long-standing ascending channel. The decline extended toward the key $112K support range, which coincides with a major breaker block, indicating the presence of significant demand.
This level successfully halted the decline, initiating a rebound toward the previously broken channel boundary NEAR the $116K region. This movement likely represents a pullback to retest the trendline, a typical market behavior after a breakdown.
Should this retest be completed, a secondary rejection is plausible, potentially resulting in another shakeout toward the $112K support. Nonetheless, the price action within this zone suggests a phase of bullish consolidation, as the market prepares for a more decisive move.
The 4-Hour Chart
Zooming into the lower timeframe, bitcoin has demonstrated strong support around the $112K level. This region aligns with both the 0.618 Fibonacci retracement level and the lower boundary of a bullish flag pattern, both technically significant structures that attract buyers.
Recent price action indicates a corrective phase, implying a potential continuation of the broader uptrend. As long as Bitcoin remains supported above the $112K range, the prevailing outlook remains bullish. However, extended sideways consolidation within the flag pattern is likely before any decisive breakout occurs.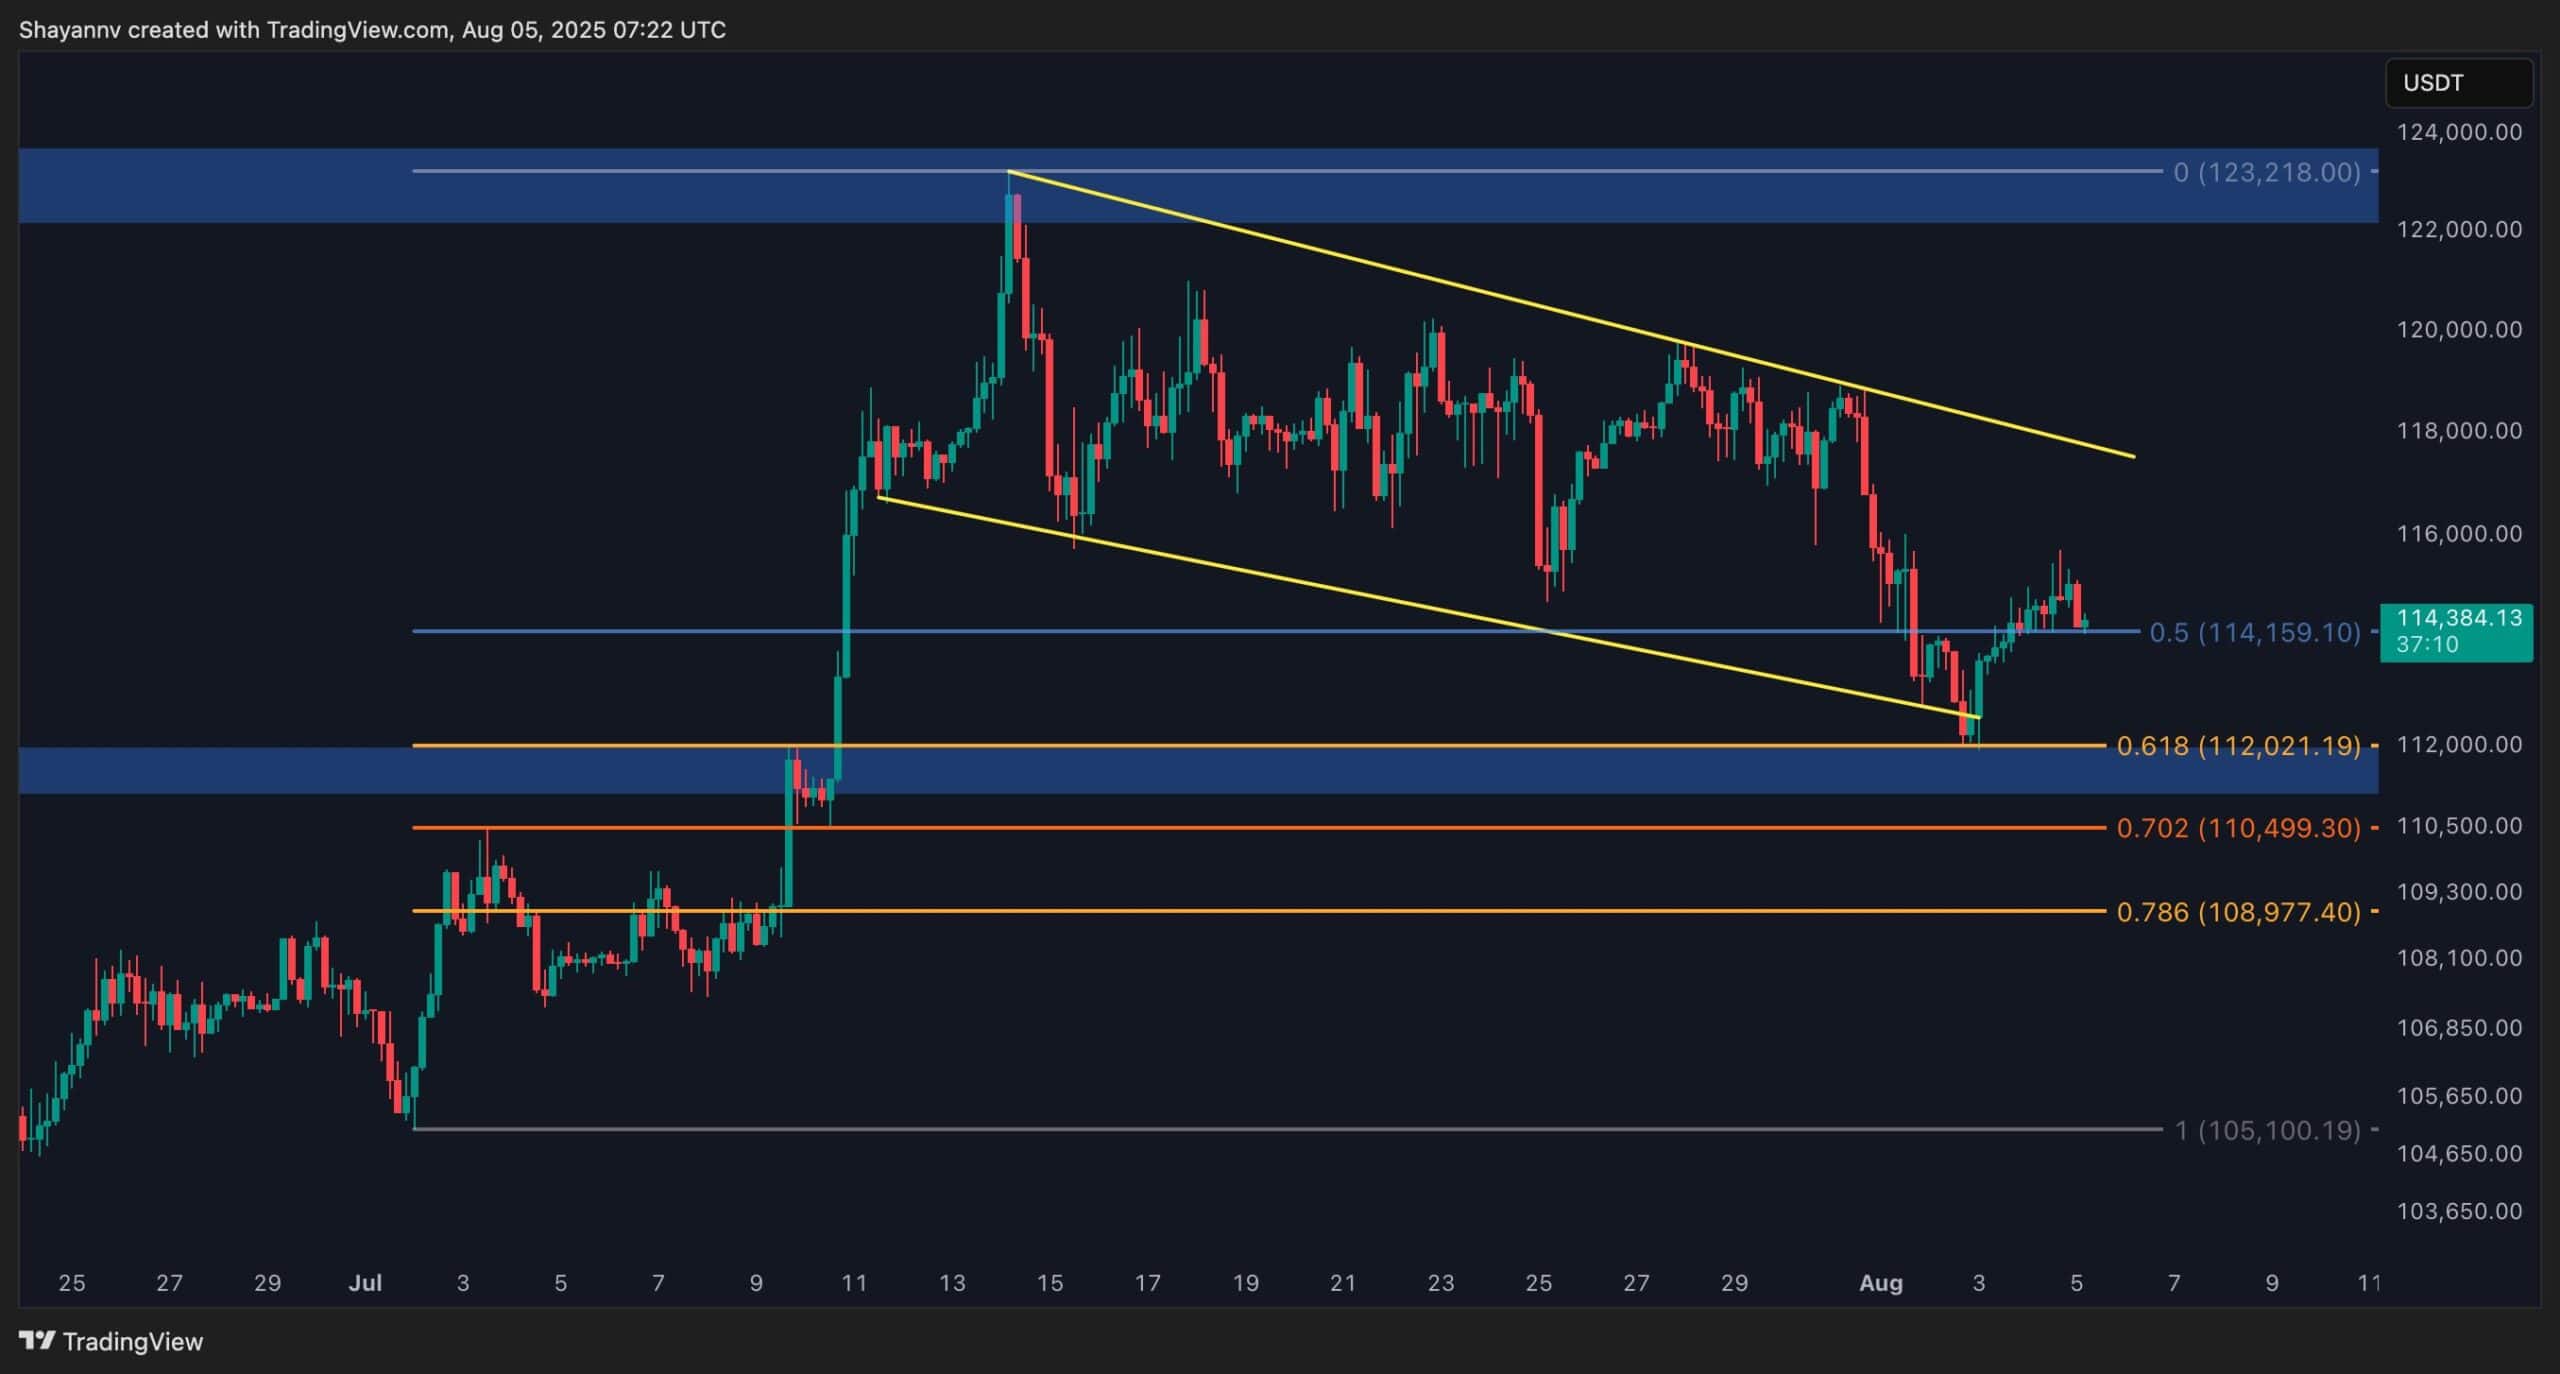
Sentiment Analysis
By ShayanMarkets
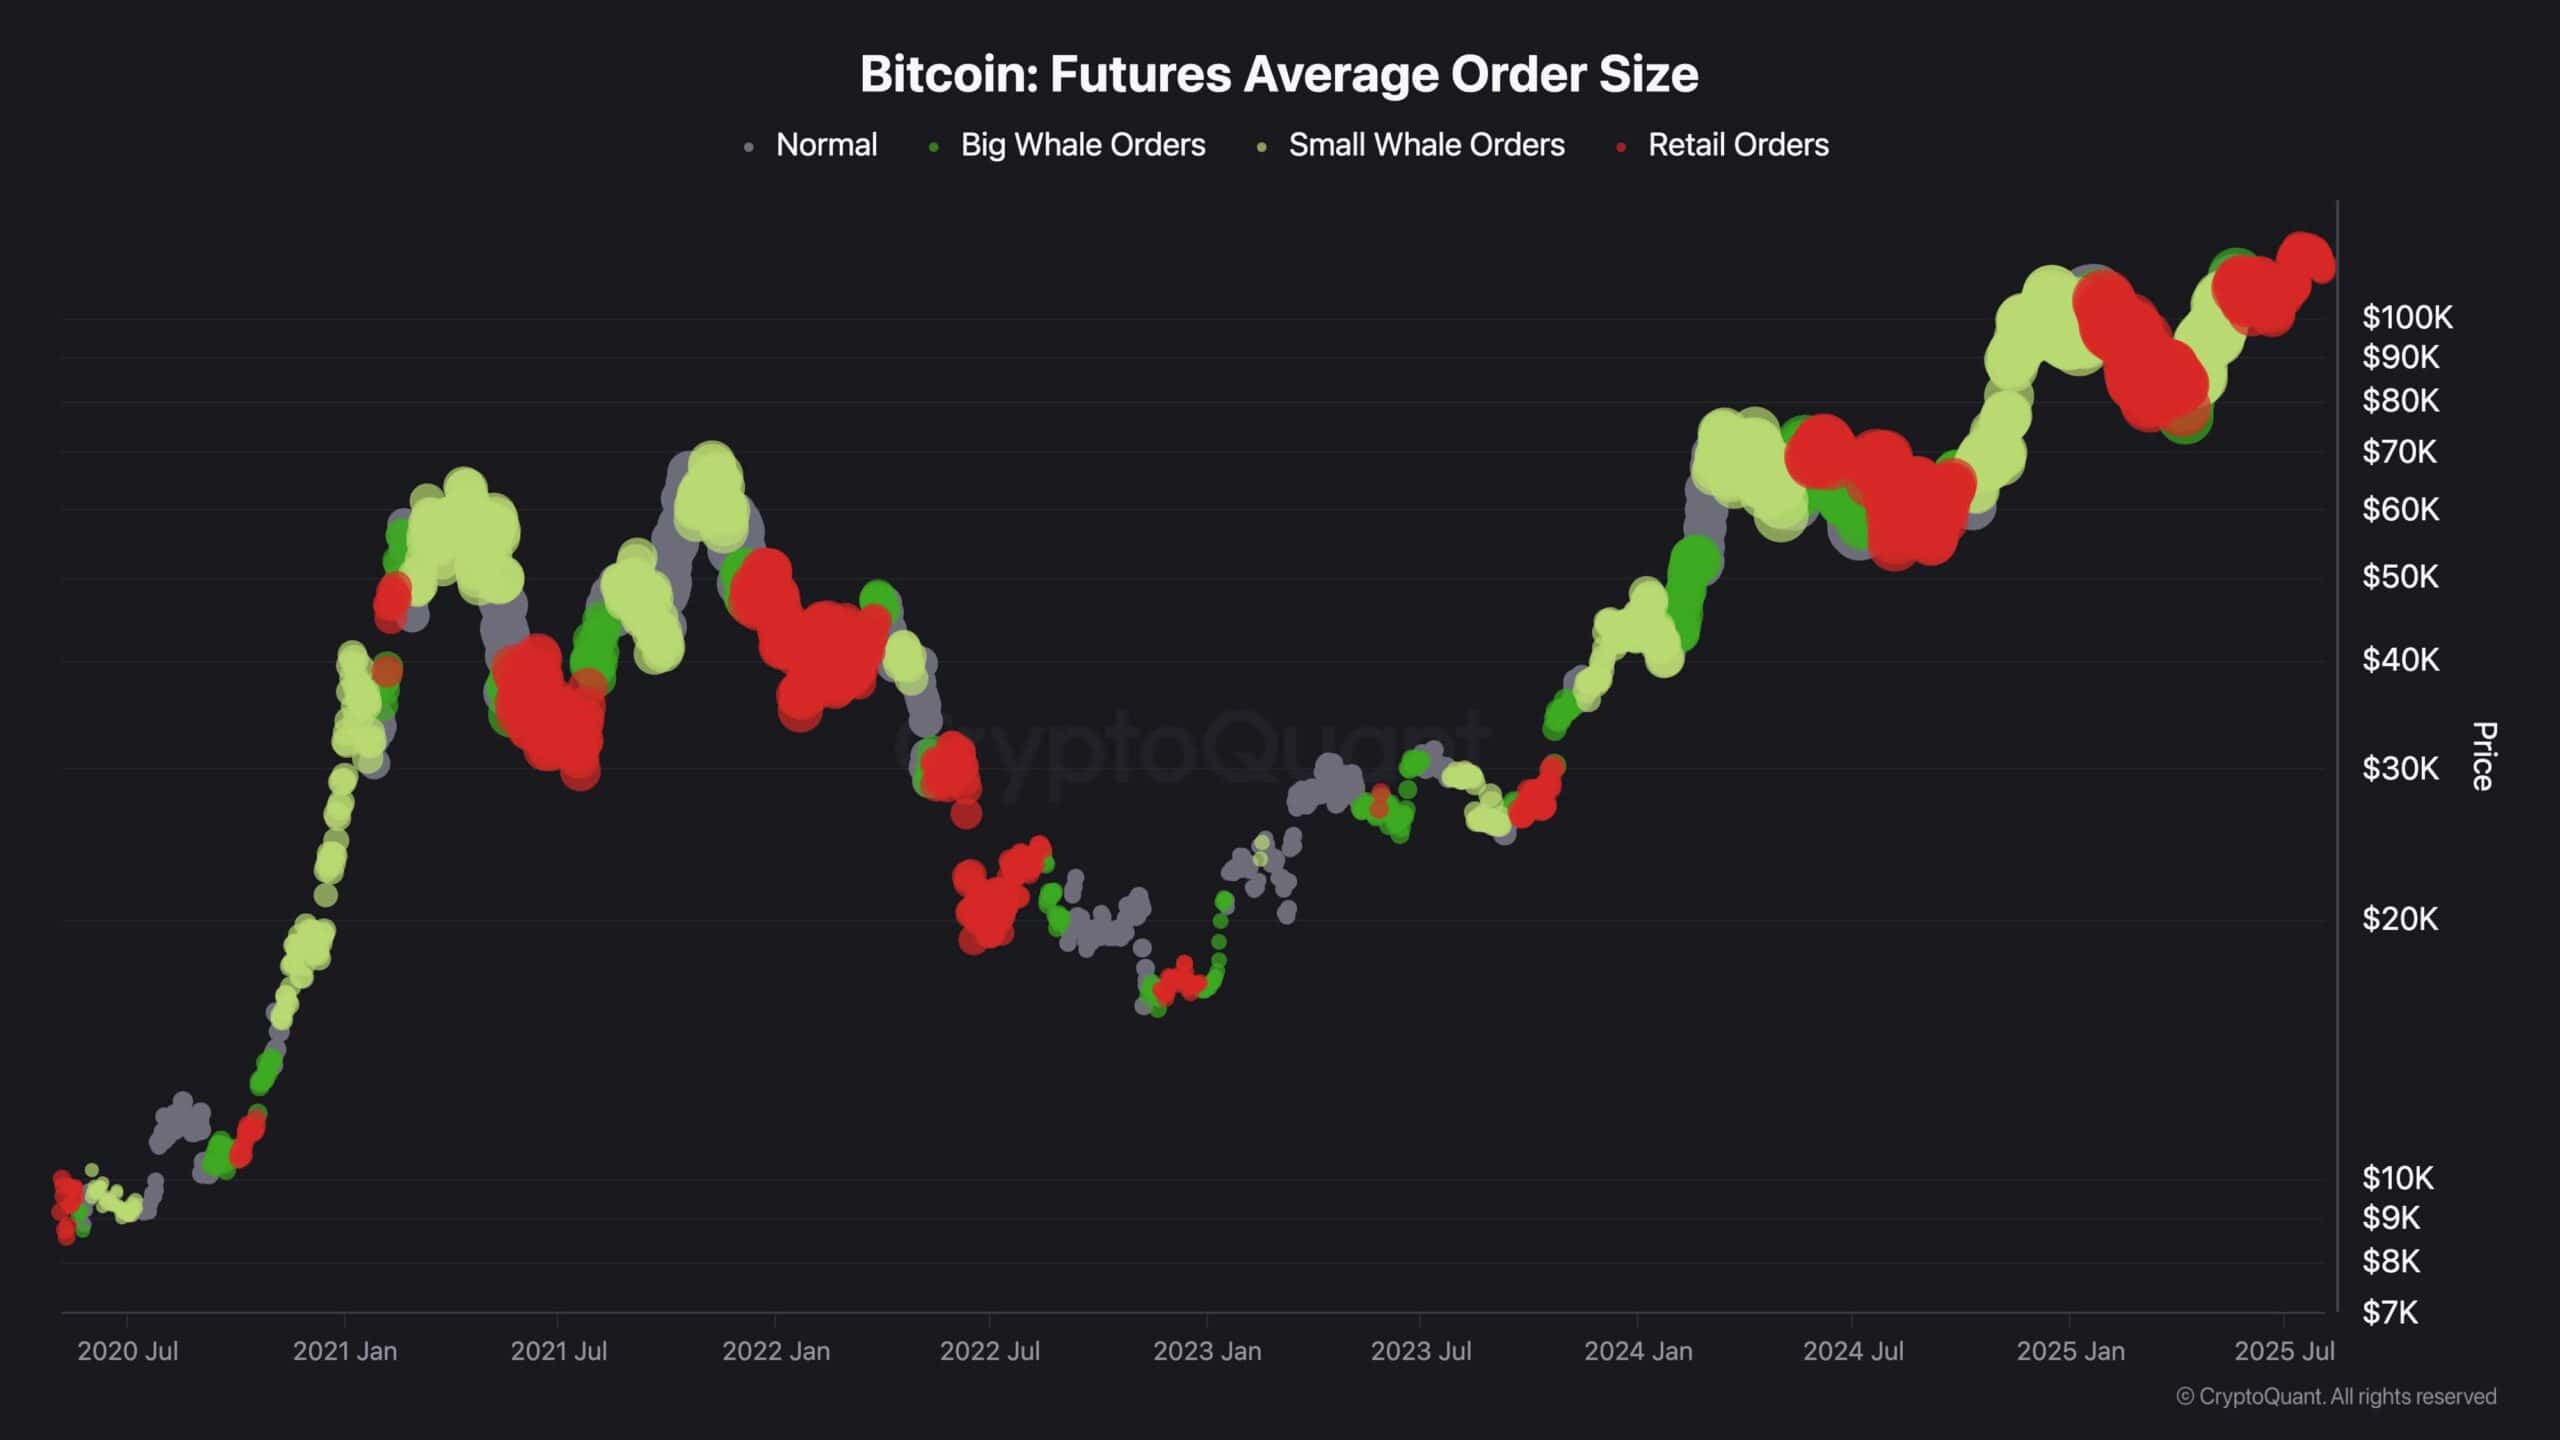
Recent futures order FLOW data highlights a sharp rise in small-sized positions, a strong indicator of retail trader activity within the current $112K–$118K range. This spike in smaller orders suggests that retail is actively engaging during this consolidation phase.
What’s notably absent is significant large-scale sell-side activity (typically represented by green circles in order Flow heatmaps). These large sell orders, often attributed to institutions or whales, are currently not present, signaling that smart money is not exiting the market or betting against the uptrend.
Historically, this combination – high retail involvement and quiet institutional activity – often precedes bullish breakouts. It typically represents a “cooling-off” period, allowing the market to absorb recent gains and reset before another upward move.
The lack of panic selling by whales reinforces the idea that this is healthy consolidation, not a trend reversal. If the current range resolves to the upside, we may see a renewed wave of demand driving Bitcoin toward new highs.