Ethereum Soars 8% in 24 Hours—$3.4K Breached as Bulls Target Next Key Resistance

Ethereum's rocket emoji just got a turbo boost—ETH surges past $3.4K with an 8% daily pump. Traders are now eyeing the next liquidity zone like hawks circling prey.
Technical breakout or overleveraged hype? The charts don’t lie—for now. RSI flirts with overbought territory while volume spikes suggest fresh money flooding in. Meme-coiners watching from the sidelines suddenly remember what 'utility' means.
Key levels to watch: A clean hold above $3.4K could trigger a FOMO rally toward $3.8K. But let’s be real—Wall Street’s 'blockchain consultants' will still find a way to sell this as 'disruptive innovation' even if it dips.
Grab your popcorn. The ETH show’s just getting started—and this time, the gas fees might actually be worth it.
The Daily Chart
ETH has sustained its upward trajectory, building on the bullish momentum that drove it above the key $3K psychological resistance. This breakout marks a strong show of force from the buyers, who have been in control since the asset pushed past the major $2.8K level.
The market is now approaching a significant supply zone between $3.2K and $3.4K, an area historically associated with increased selling pressure.
A successful push through this order block could signal further upside, with price targets at the $3.7K and potentially $4.1K levels. The ongoing rally suggests that ETH may be setting the stage for a fresh attempt toward its all-time highs, pending confirmation from the next price action developments.

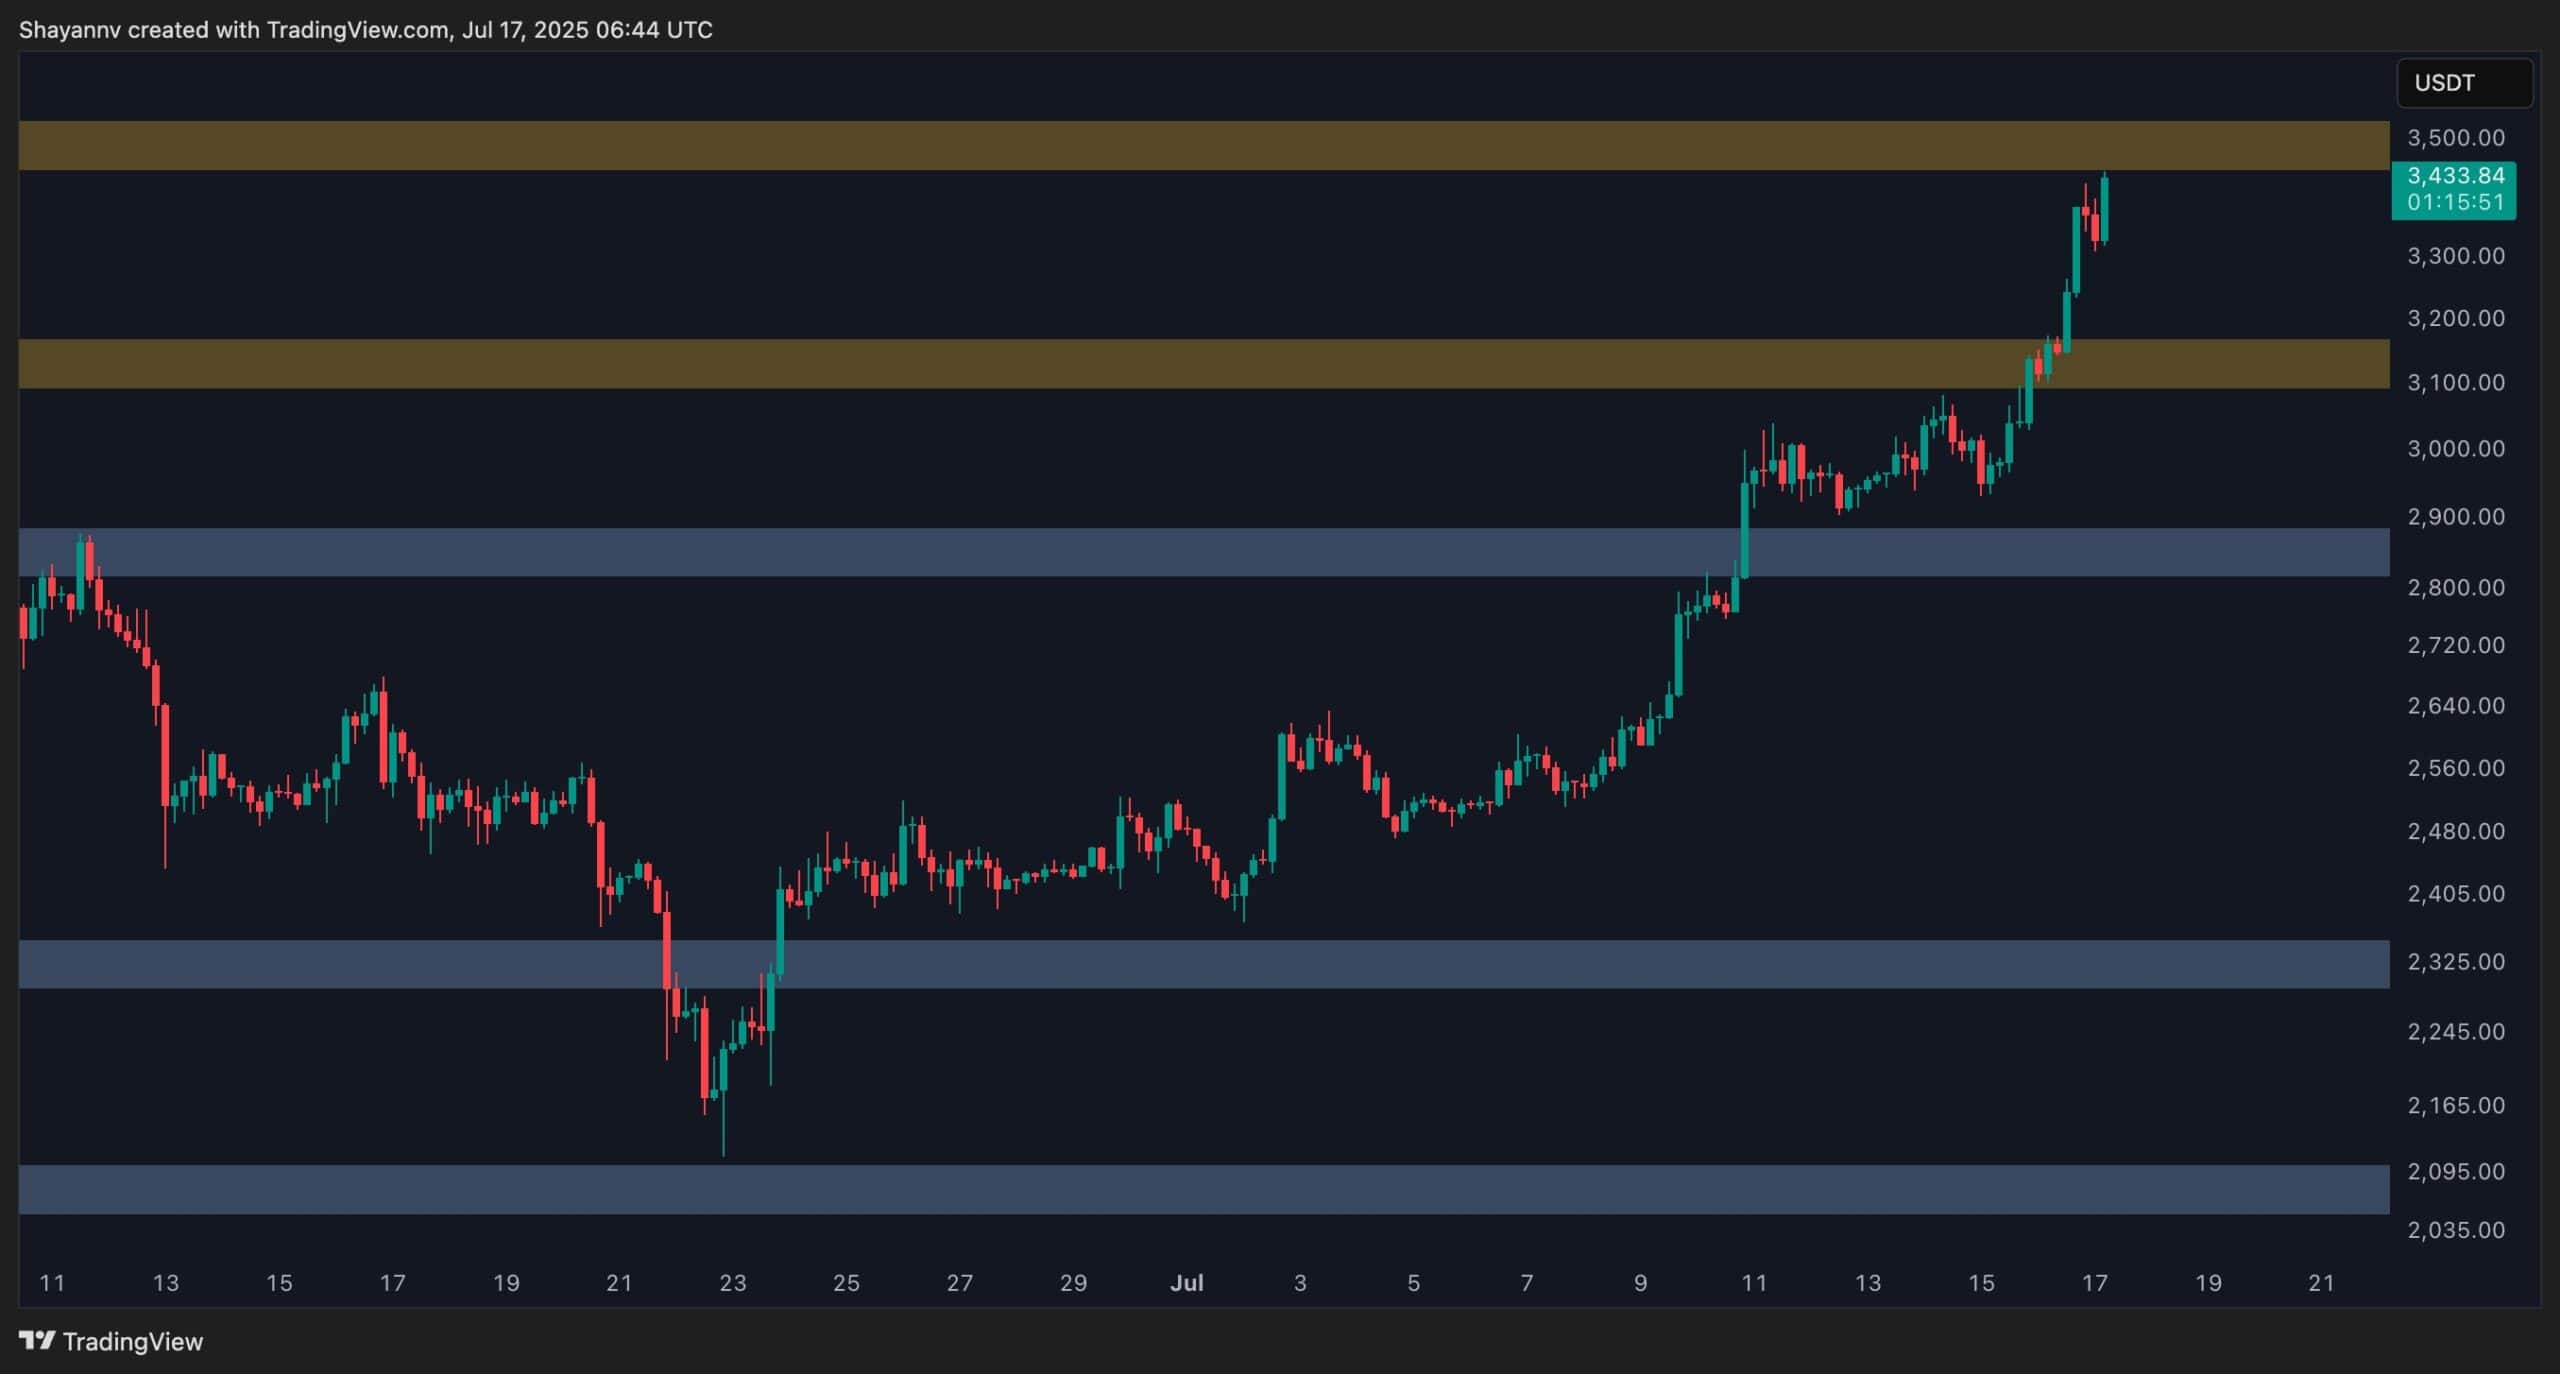
The 4-Hour Chart
In the lower time frame, ETH’s strength remains evident. The chart displays a series of strong bullish candles, reflecting a surge in buying activity.
However, the price has now encountered a key resistance region near $3.5K. If the cryptocurrency fails to decisively break above the $3.5K threshold, it may continue to fluctuate within the $3K-$3.5K zone in the short term.
A breakout above this range WOULD likely reintroduce bullish momentum, while a rejection could prolong the consolidation.
By Shayan
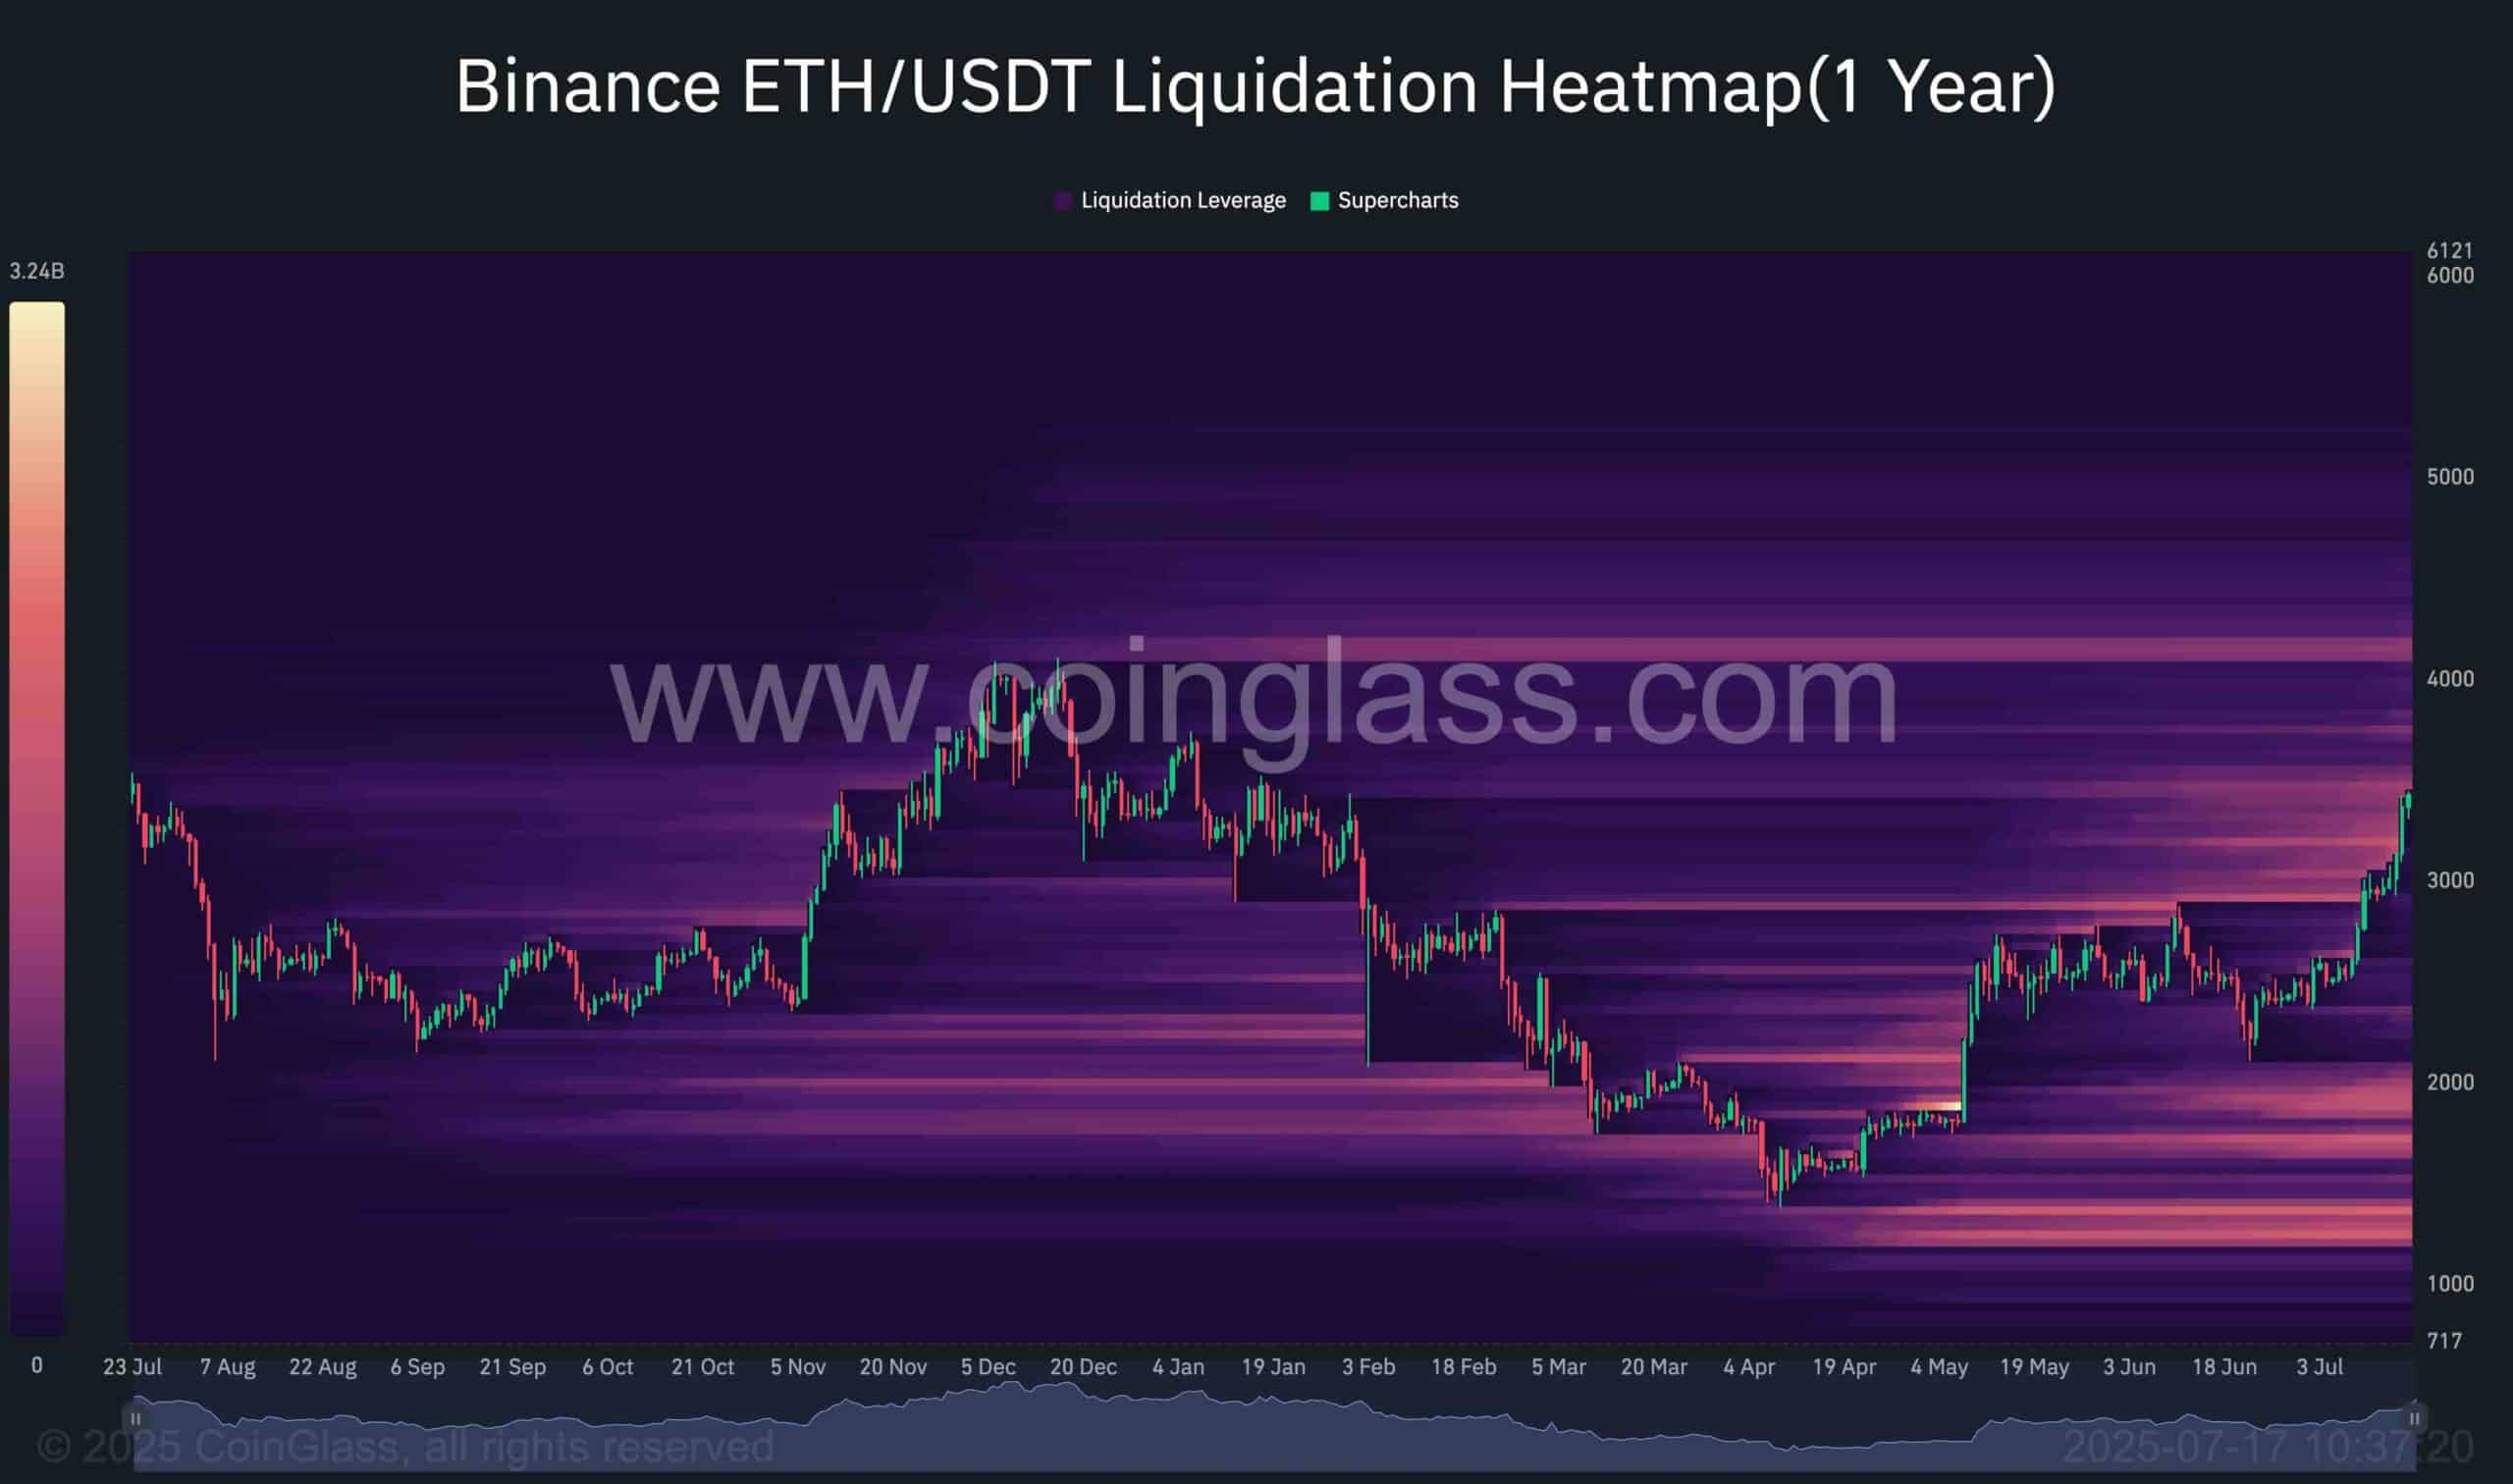
This chart represents the Binance Liquidation Heatmap, which highlights areas where major liquidation events are most likely to occur. These zones typically serve as liquidity targets, drawing price action due to the dense buildup of Leveraged positions.
At present, the path toward the $4K region appears relatively clear of significant liquidity pools. However, just beyond the $4K mark lies a substantial liquidation cluster, indicating a strong likelihood that ETH’s price could be drawn toward this critical zone.
If this projection holds, ethereum may extend its bullish momentum toward this level, potentially paving the way for a new all-time high. That said, temporary phases of corrective consolidation remain probable as part of the journey toward that milestone.