Bitcoin at a Crossroads: Is BTC Running Out of Steam or Primed for a $130K Breakout?

Bitcoin's latest price action has traders split—is this a classic exhaustion signal or the calm before a historic rally?
Bulls see a coiled spring. Bears see overbought danger. Meanwhile, Wall Street still can't decide if crypto is an asset class or a speculative fever dream.
The $130K question. Technicals suggest Bitcoin's forming either a bull flag or distribution pattern. Volume tells the real story—recent dips got bought aggressively, but institutional flows slowed this week.
Watch these key levels. A decisive break above $72K opens path to six figures. Lose $60K support? That's when the 'macro headwinds' crowd gets loud.
One thing's certain—when BTC moves, it punishes hesitation. Whether you're stacking sats or waiting for 'the big correction,' better have your game plan ready.
The Daily Chart
The daily chart shows that the asset is still respecting the long-term ascending channel, as it rebounded from its lower boundary and is currently rallying toward the mid-line. The price decisively closed above the $112,000 previous all-time high, a level that acted as a distribution zone for over a month. Following this breakout, BTC printed several bullish continuation candles, pushing all the way up to $122,000.
Yet, a retracement into the $114K–$117K zone is probable to cool the market down. This pullback WOULD not invalidate the bullish structure but instead offer a healthier continuation setup. As long as the price holds above the $114K breakout level, the medium-term structure remains strongly bullish.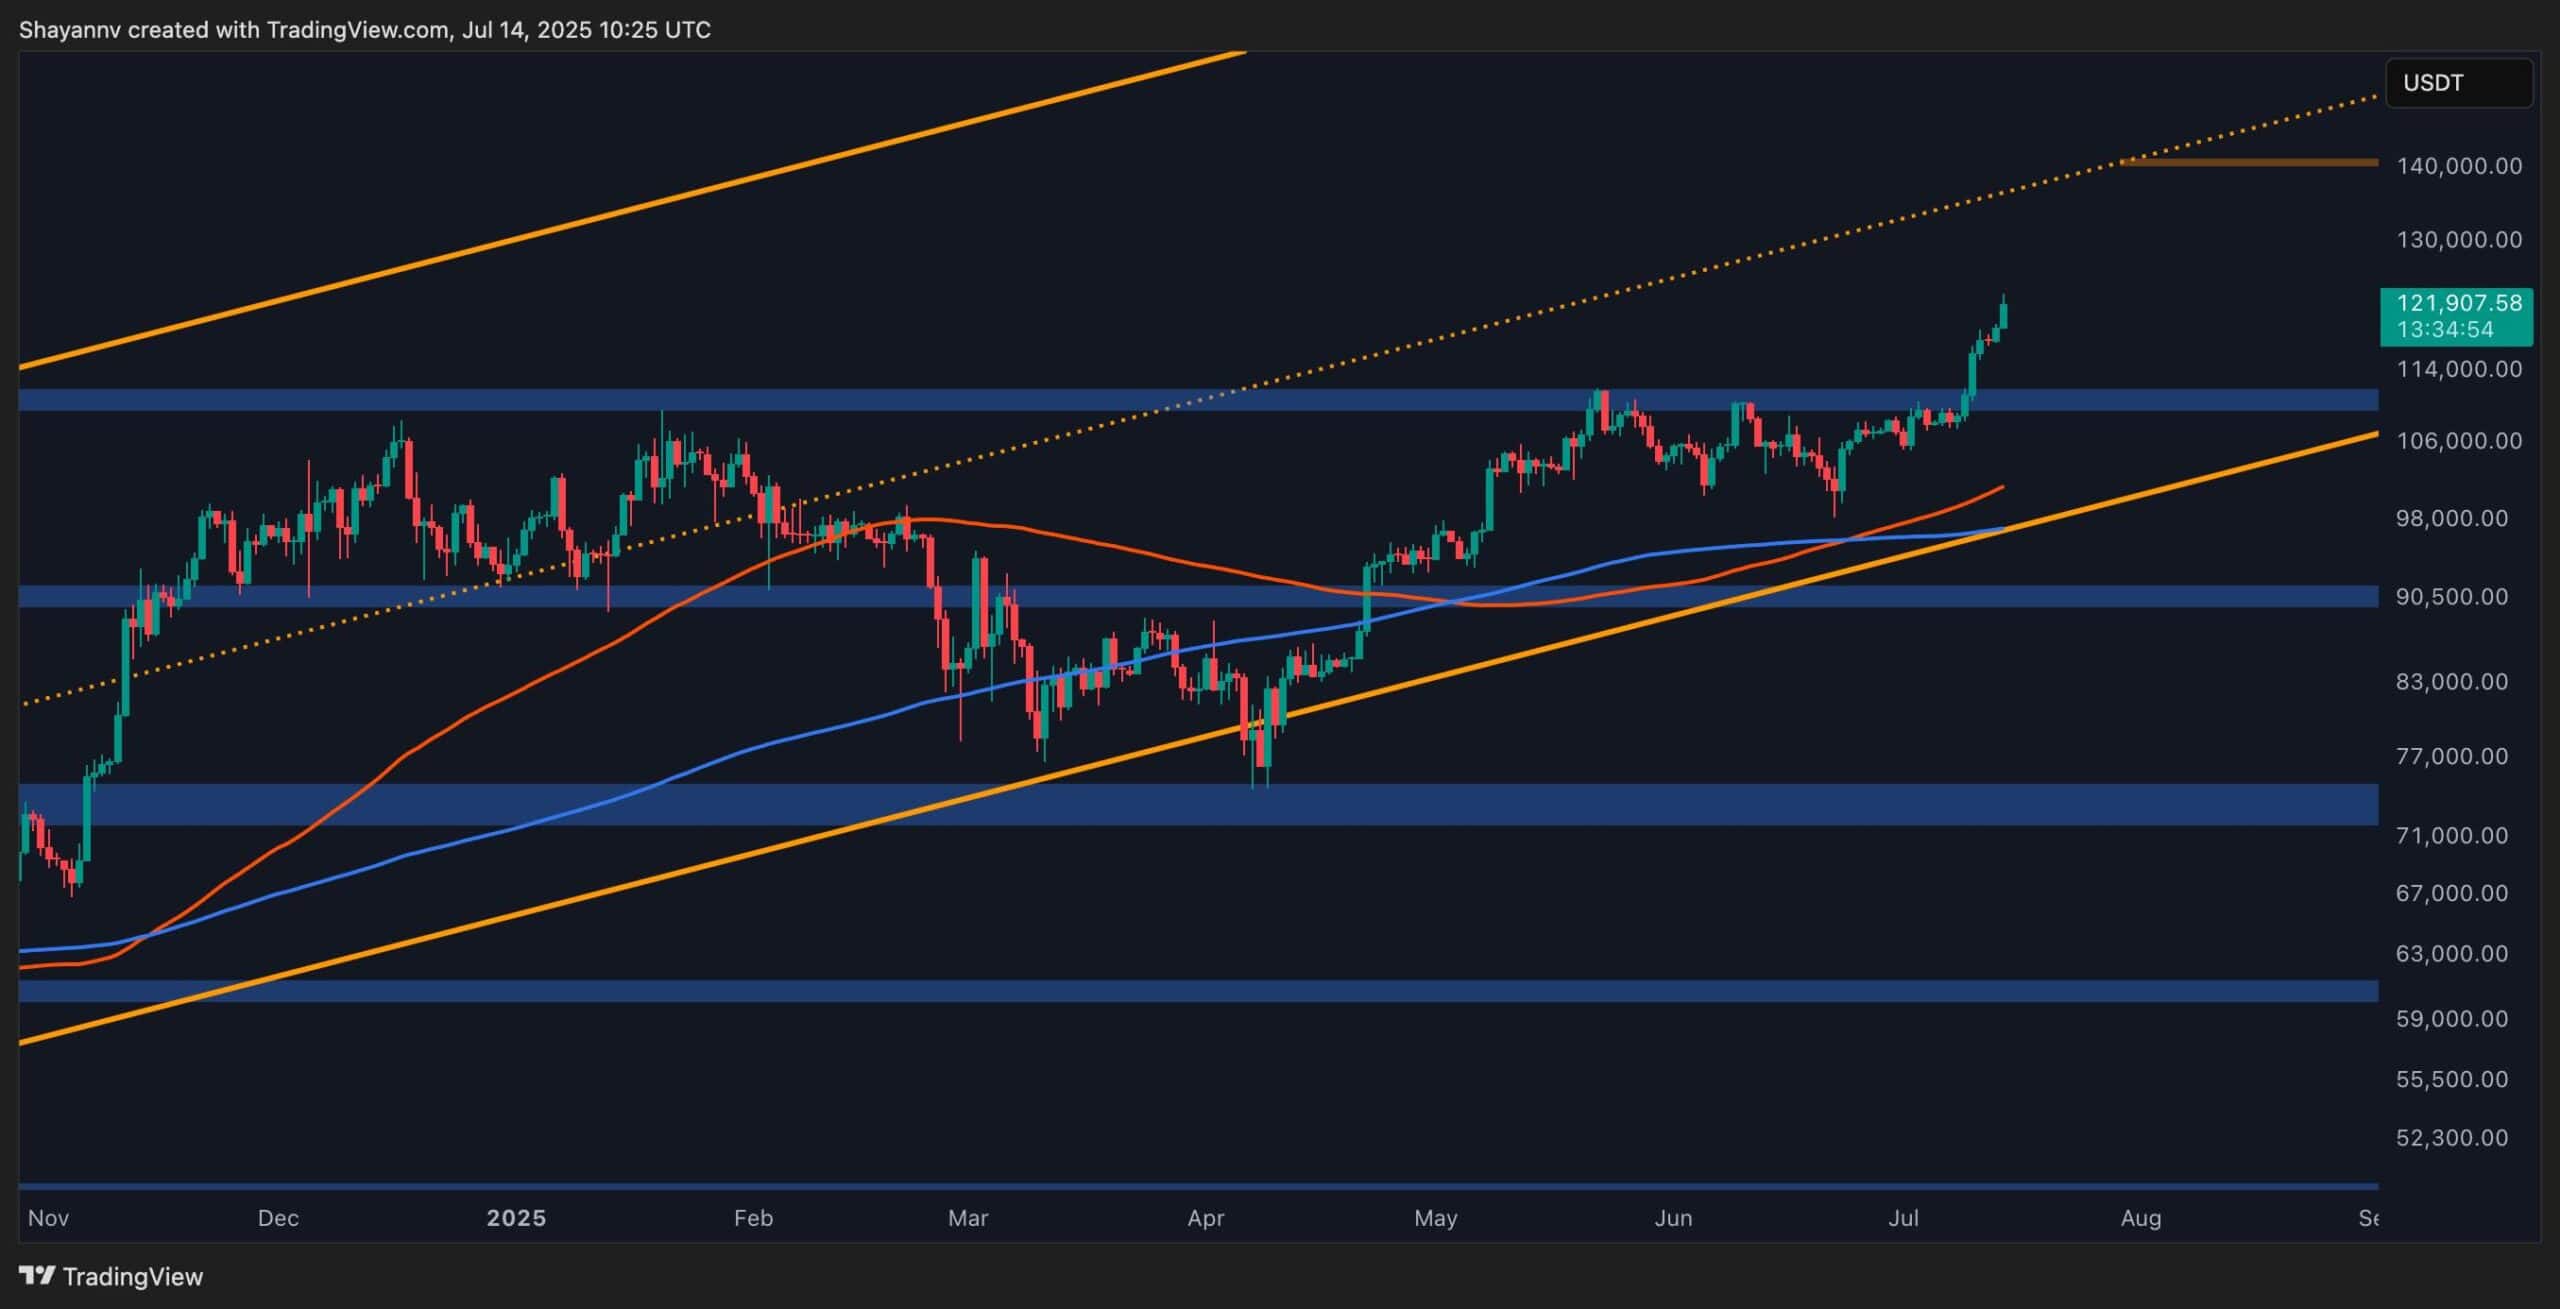
The 4-Hour Chart
The 4H chart shows a clean breakout from the recent range and a near-vertical price expansion, confirming the daily momentum. After breaking above the descending channel, Bitcoin formed a strong impulsive leg. As a result, the RSI is now extremely elevated at 78+, hinting at potential short-term exhaustion.
The 4H chart also highlights the newly formed Fair Value Gaps stacked below the price, which could get revisited in the coming sessions or days. These FVGs can both attract the price and act as potential support. As long as BTC remains above the 114K block, short dips into this region would be considered bullish retests.
Moreover, if the price begins to range around the 121K–122K area, it would allow RSI to cool off and provide fresh momentum for the next breakout, without experiencing much correction.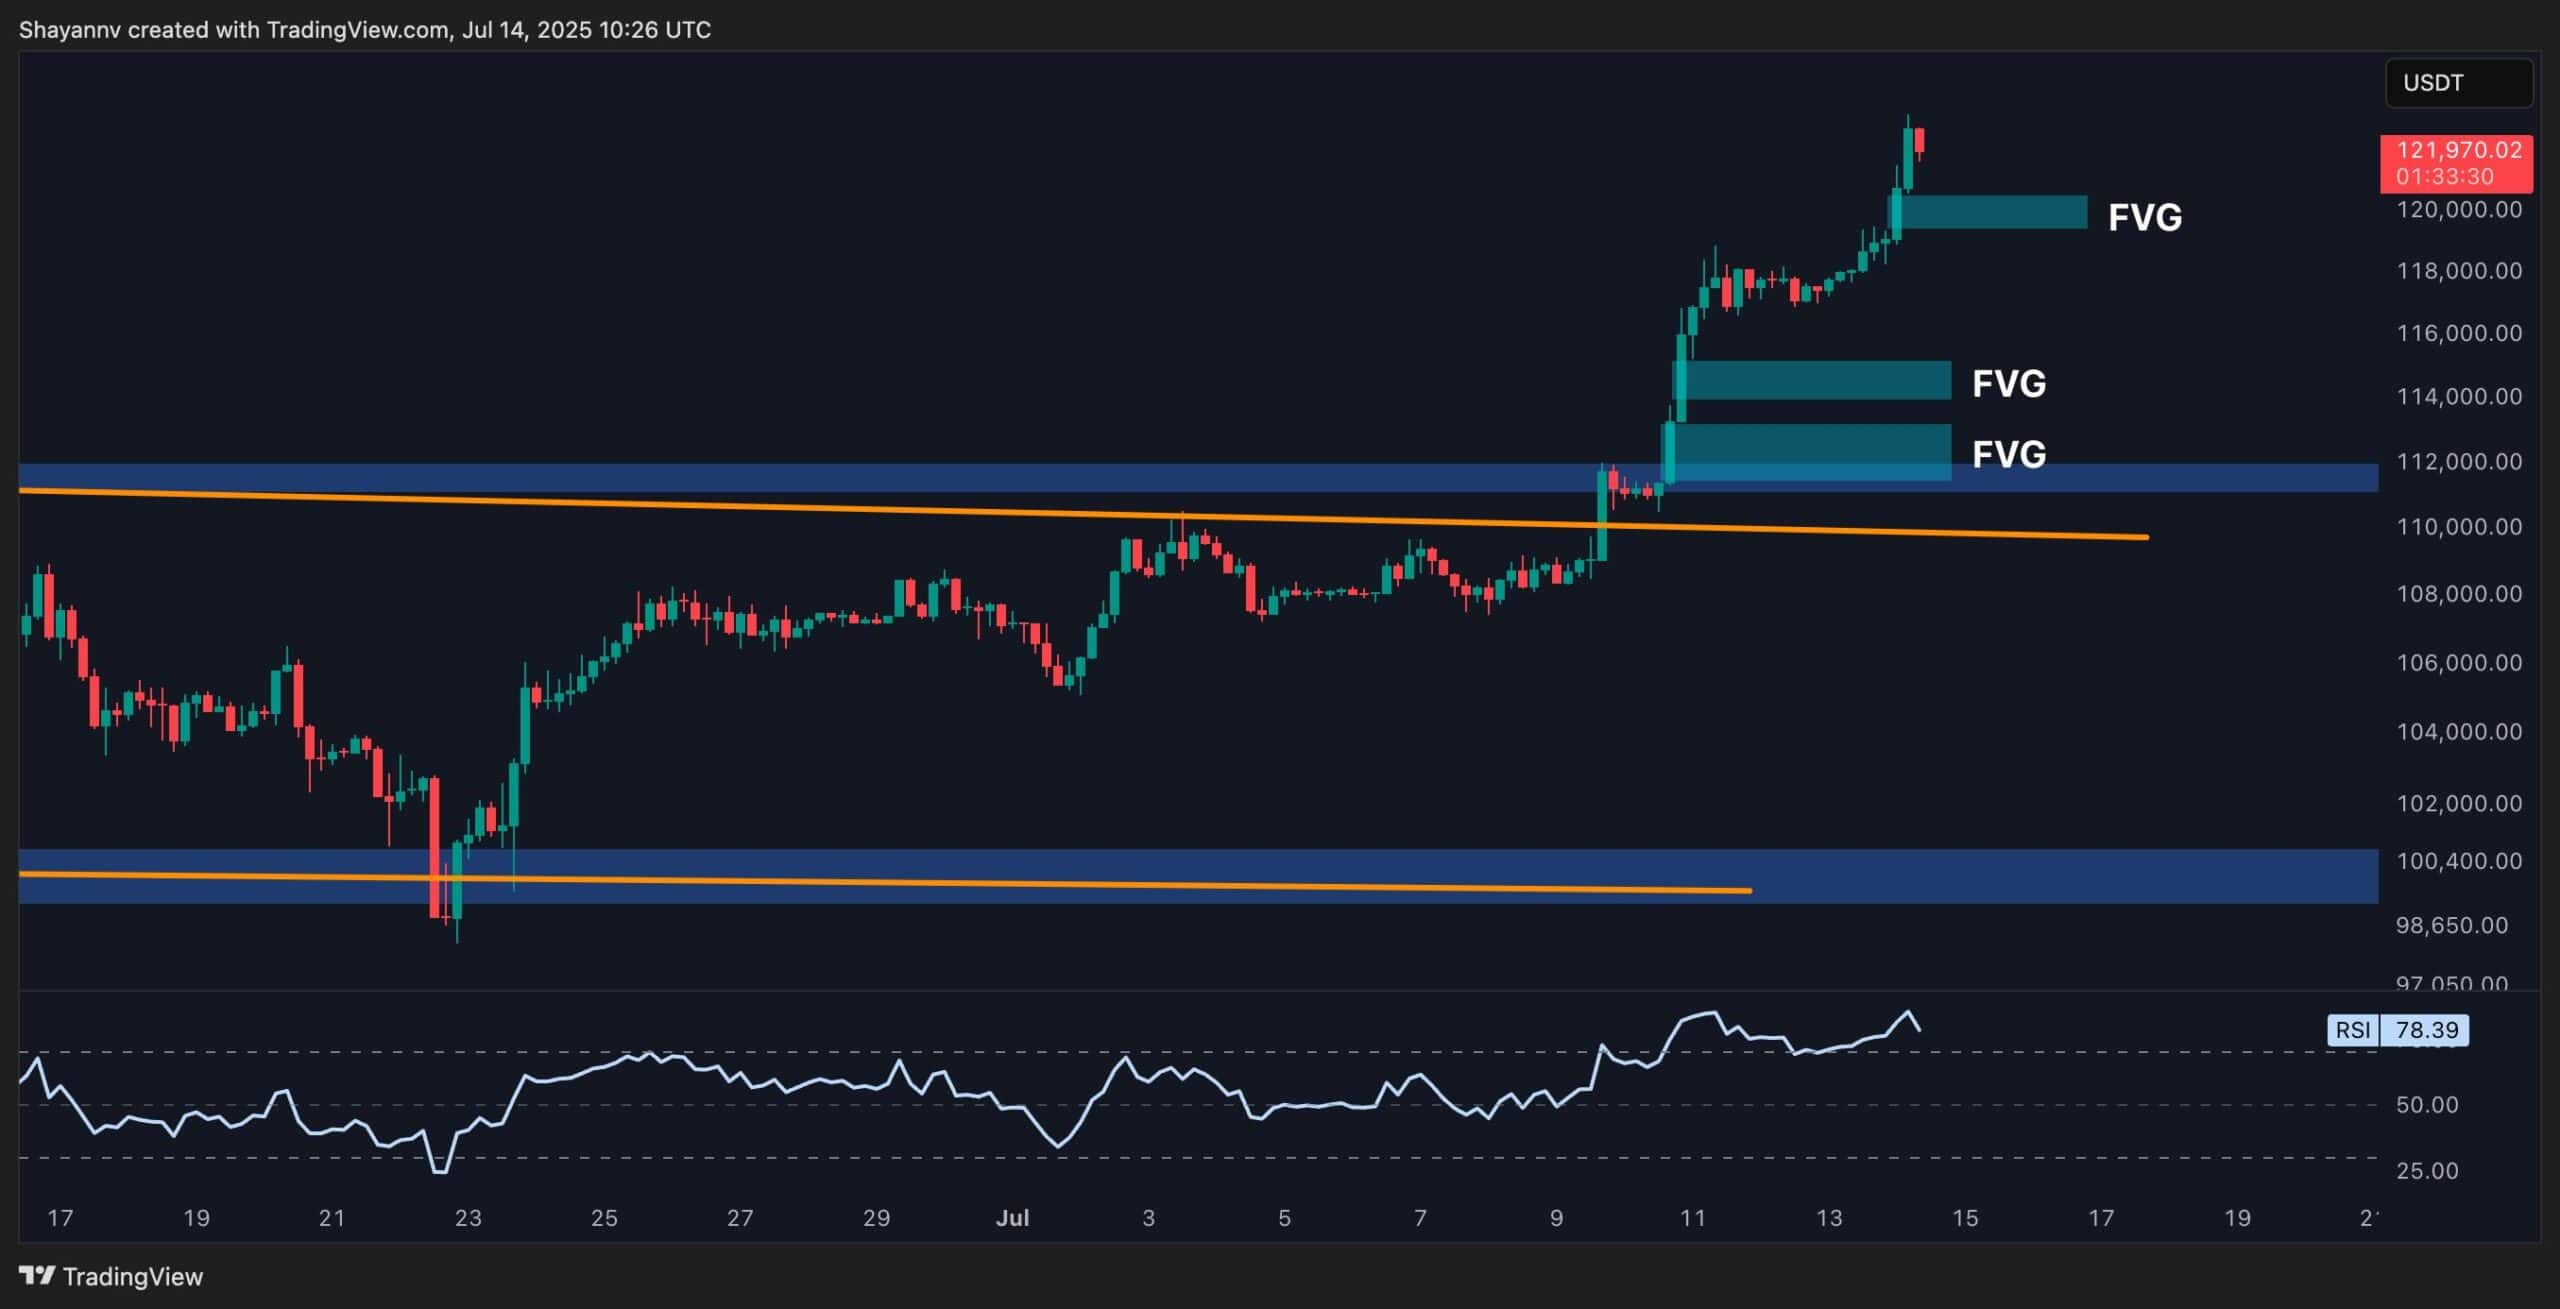
Sentiment Analysis
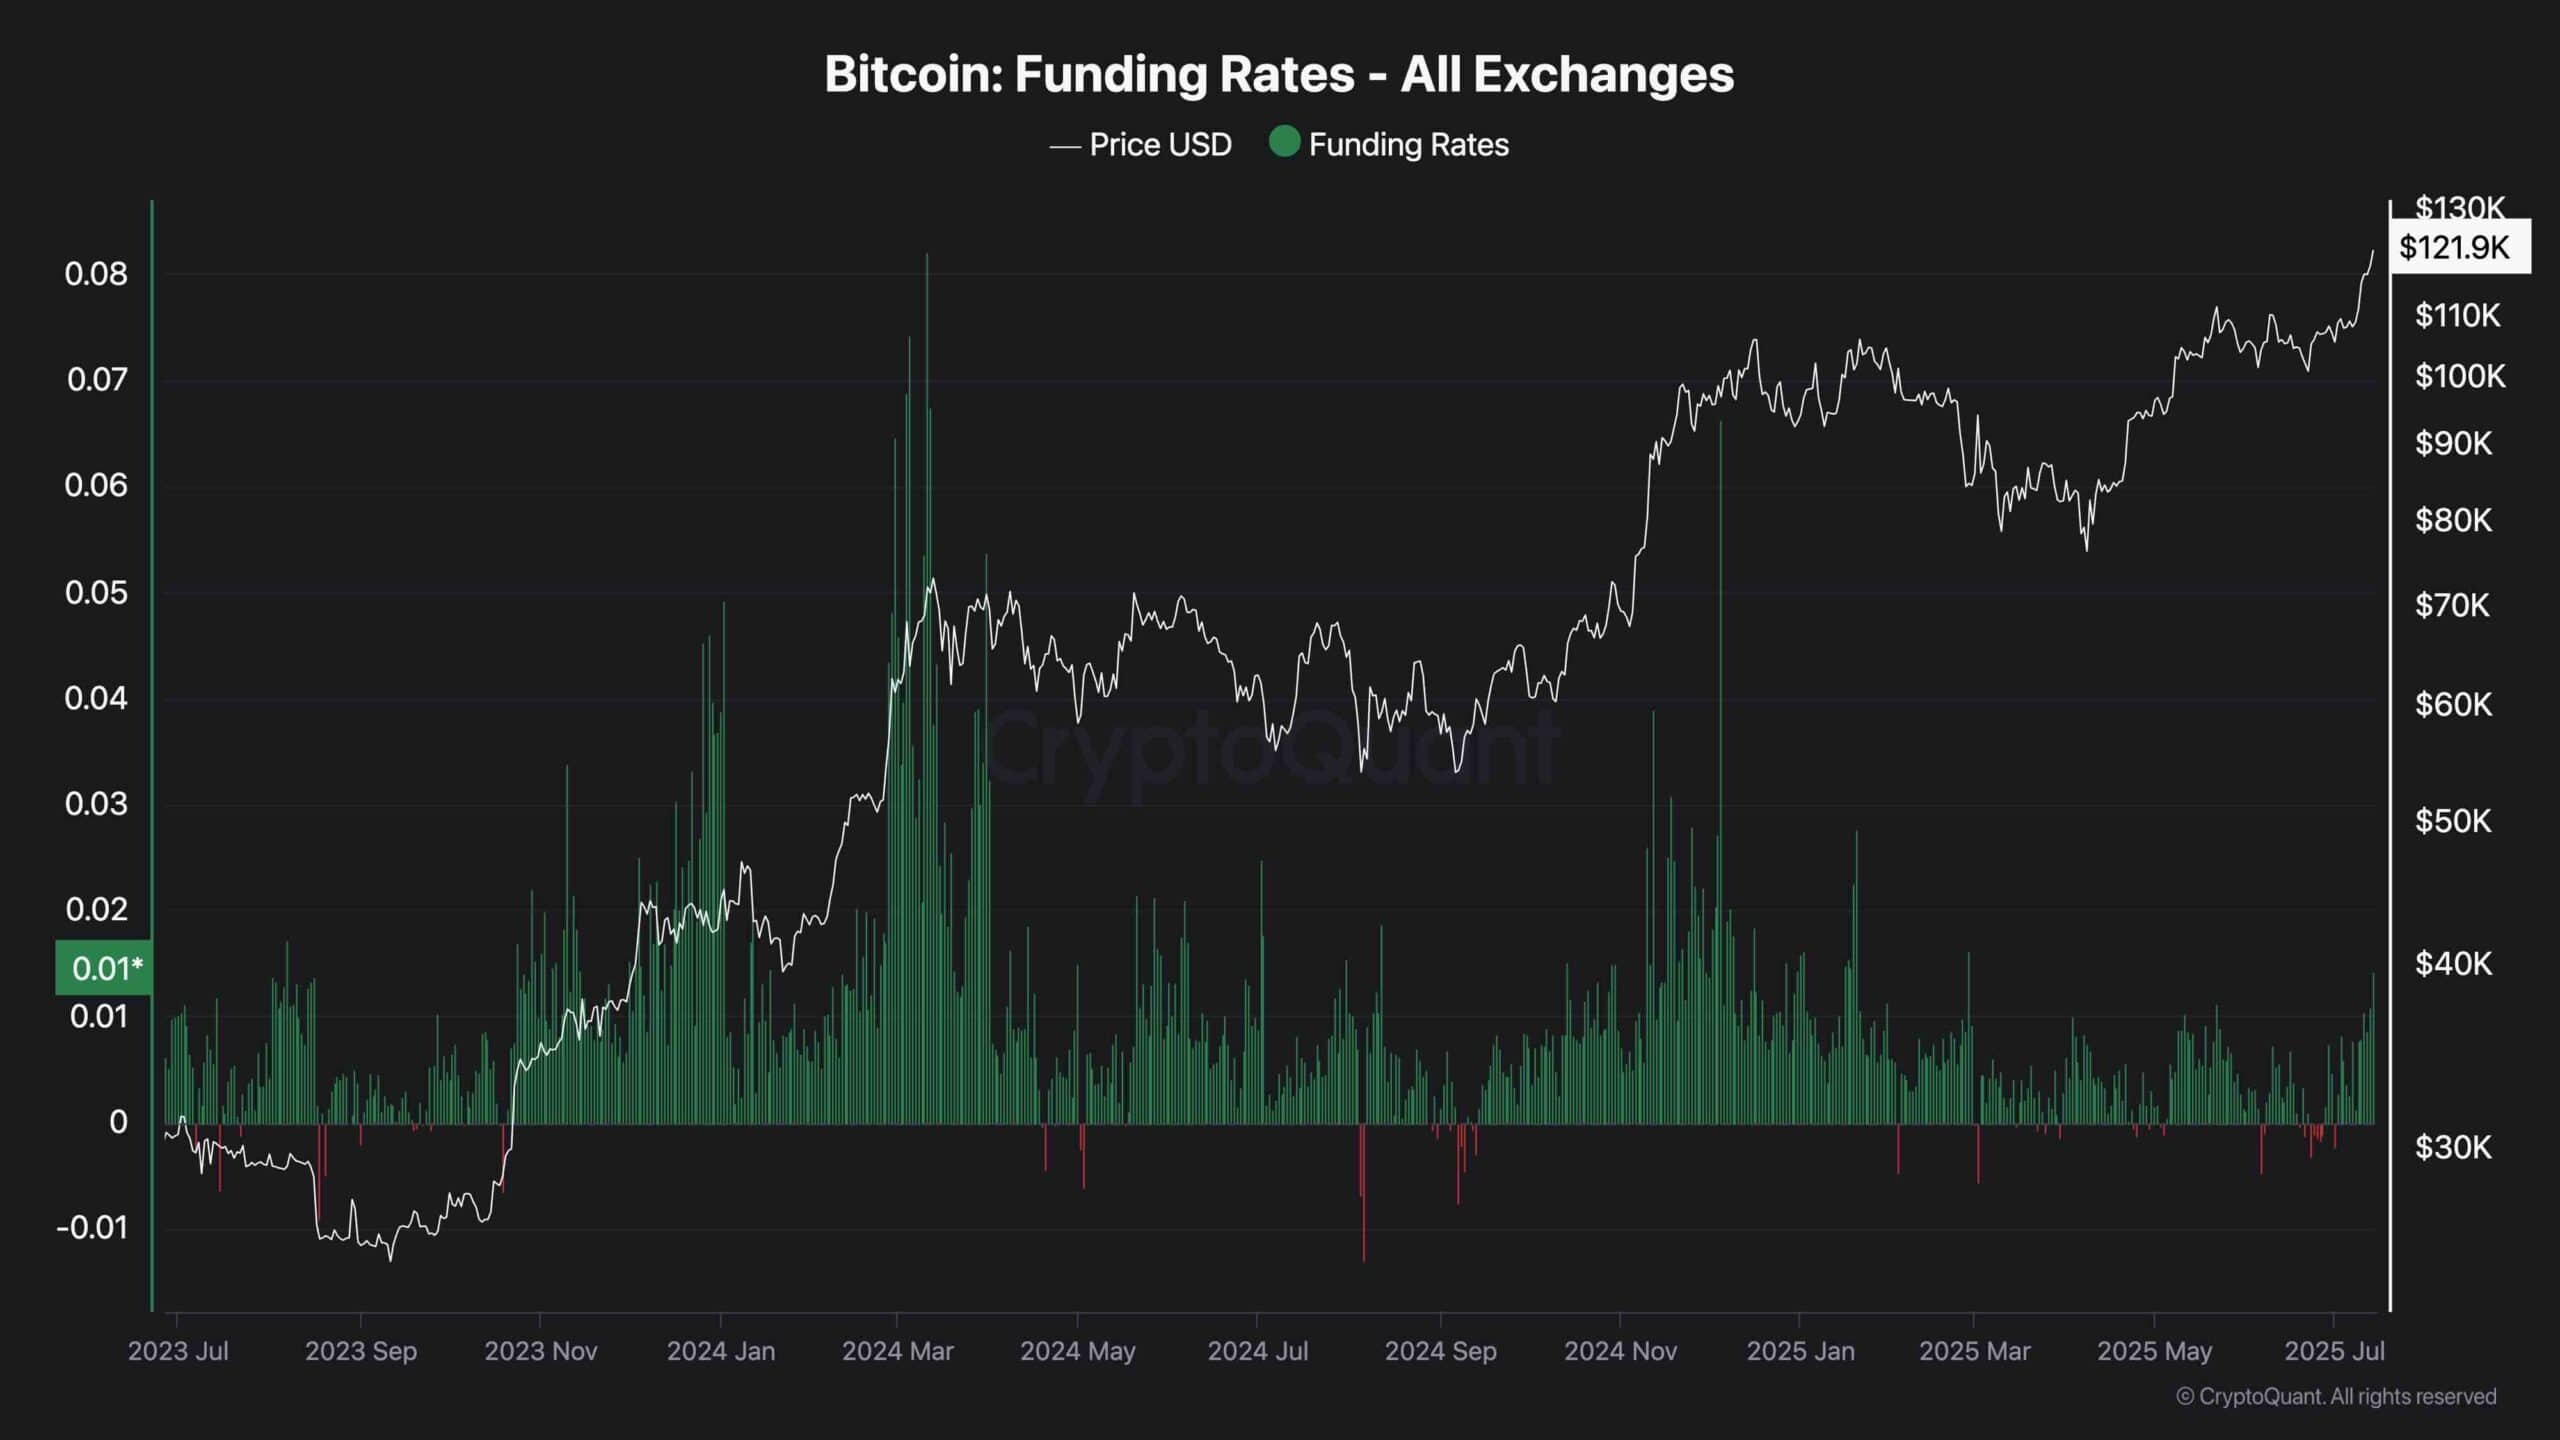
Bitcoin Funding Rates
Funding rates have started to spike again, reflecting the surge in long-side leverage after the breakout. This sharp uptick in funding confirms that traders are aggressively chasing the move. While elevated funding is expected during trend continuations, it also introduces risk: the higher the leverage imbalance, the more vulnerable the market becomes to a flush.
Historically, when funding remains excessively positive while prices stall or consolidate, it often leads to a liquidation-driven pullback. So far, we haven’t seen aggressive spikes like those in Q1 2024, but it’s something to monitor closely.
If the asset fails to push higher while funding stays elevated, a quick shakeout into the 114K zone is possible. Until then, the sentiment remains bullish but slightly overheated, which aligns with current RSI readings and market structure.