SPX6900 Surges 11%—Here’s What’s Fueling the Rally and Where It Goes Next

SPX6900 just ripped past resistance—up 11% in a single move. Traders are piling in, but is this another speculative bubble or the start of a legit breakout?
What’s driving the pump?
Rumors swirl about a major exchange listing, while some point to a whale accumulating quietly for weeks. Either way, liquidity’s flooding in faster than a hedge fund’s apology after a bad trade.
What’s next for SPX6900?
If it holds above key support, bulls could push for another leg up. But watch the order books—this kind of volatility tends to shake out weak hands faster than a crypto influencer flips their narrative.
One thing’s certain: in a market where ‘fundamentals’ often mean ‘Twitter hype,’ SPX6900’s next move will be pure adrenaline—no white paper required.
SPX6900 Extends Weekly Gains With Fresh Momentum
SPX6900 (SPX) is trading at $1.42 as of press time, rising 8% in the past 24 hours. This MOVE follows an earlier 11% increase, bringing its 7-day gain to around 20%. The current market cap stands at $1.32 billion, based on a circulating supply of 930 million tokens.
Daily trading volume reached $94.4 million, with price action ranging between $1.28 and $1.44, based on Coingecko data. SPX6900 is still down 17.8% from its all-time high of $1.73, recorded on June 11, 2025. The broader trend remains upward, supported by recent market interest and social activity.
Interestingly, according to Santiment, SPX6900’s social dominance has reached 0.913%, the highest level in over two months. This metric reflects the share of online discussions across major crypto media platforms related to SPX compared to other tokens.
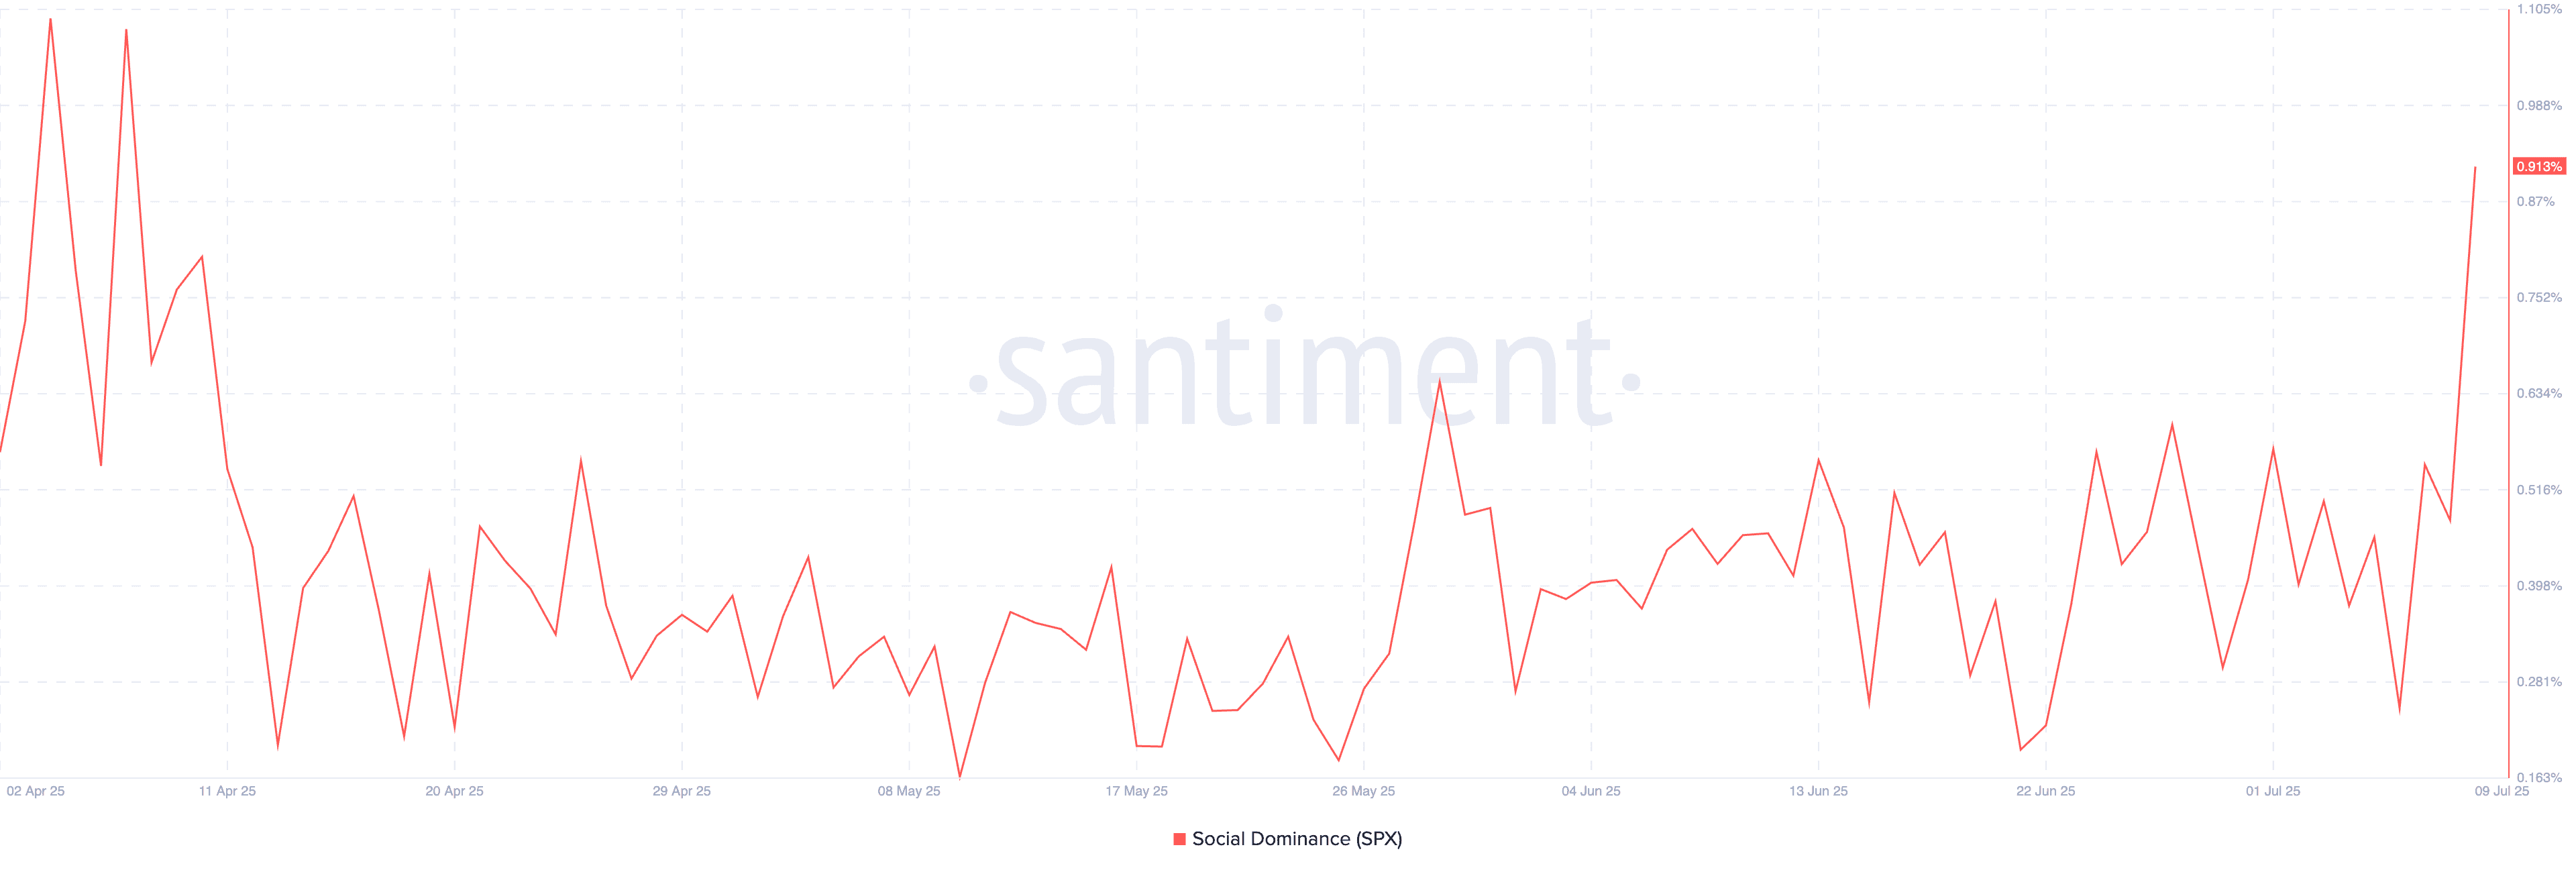
Meanwhile, the rise in visibility has coincided with stronger market performance. As the coin garners more attention, both new and existing traders appear more active, despite overall network activity showing some signs of slowing.
SPX Holds Trendline Support as Resistance Nears
The meme coin continues to follow a rising trendline that’s been in place since May, showing steady upward pressure. The price is hovering just below $1.36, a zone that has acted as resistance in recent weeks. This area also lines up with a key Fibonacci level, making it an important point for traders to watch.
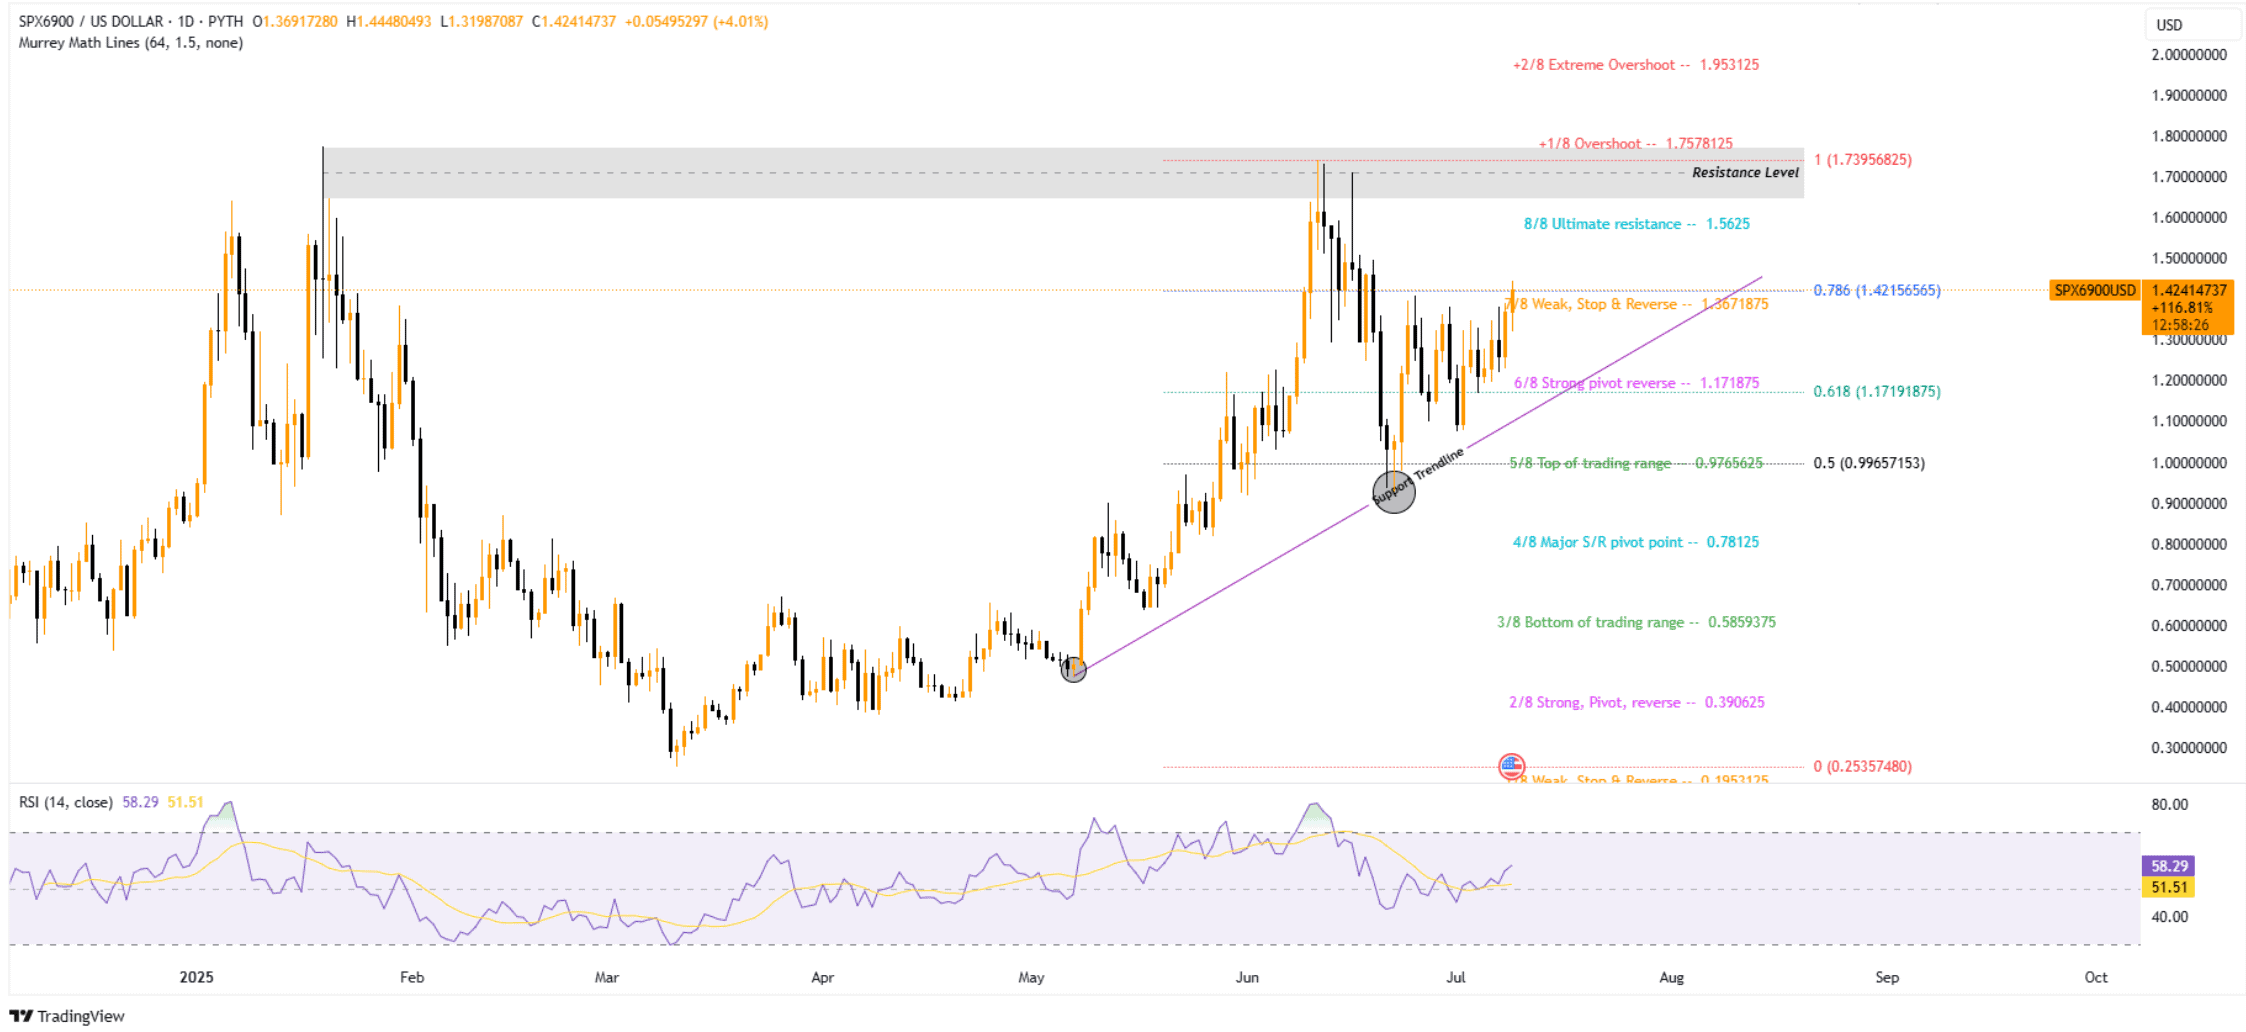
If the price closes above $1.36 with volume, it could move toward $1.56, where previous rallies have stalled. The RSI is currently reading 58.29, which leans bullish without showing overbought conditions.
Momentum remains intact as long as the price stays above the trendline. Any drop below $1.17 WOULD weaken the structure. For now, buyers appear to be in control.
Address Activity Trends Lower Despite Price Surge
IntoTheBlock data shows total addresses have reached 1.56K. New addresses are at 172, though they have dropped by 8.44% over the last seven days. This points to slowing growth in new user participation.
Active addresses have declined by 9.40% in the same period, with the count at 1.23K. Zero balance addresses are at 157, down 2.92%, which could reflect some user exits or consolidation of holdings.
Despite falling address metrics, the price remains strong, driven by increased short-term interest.
