Ethereum Surges 4% in a Week – Where’s the Next Price Ceiling? ETH Targets Revealed

Ethereum bulls are back in the driver’s seat after a 4% weekly rally—but can ETH smash through its next resistance levels?
The Setup:
After clawing back losses, ETH’s price action hints at a potential breakout. Traders are eyeing key Fibonacci levels like amateur astronomers chasing supernovas.
The Targets:
If the momentum holds, $3,800 becomes the first litmus test. Clear that, and suddenly ATHs start looking less like hopium and more like a spreadsheet reality.
The Catch:
Volume tells the real story. Without sustained buying pressure, this rally could vanish faster than a VC’s promises during a bear market.
One thing’s certain: Wall Street’s still trying to pronounce ‘DeFi’ while ETH’s chart prints money.
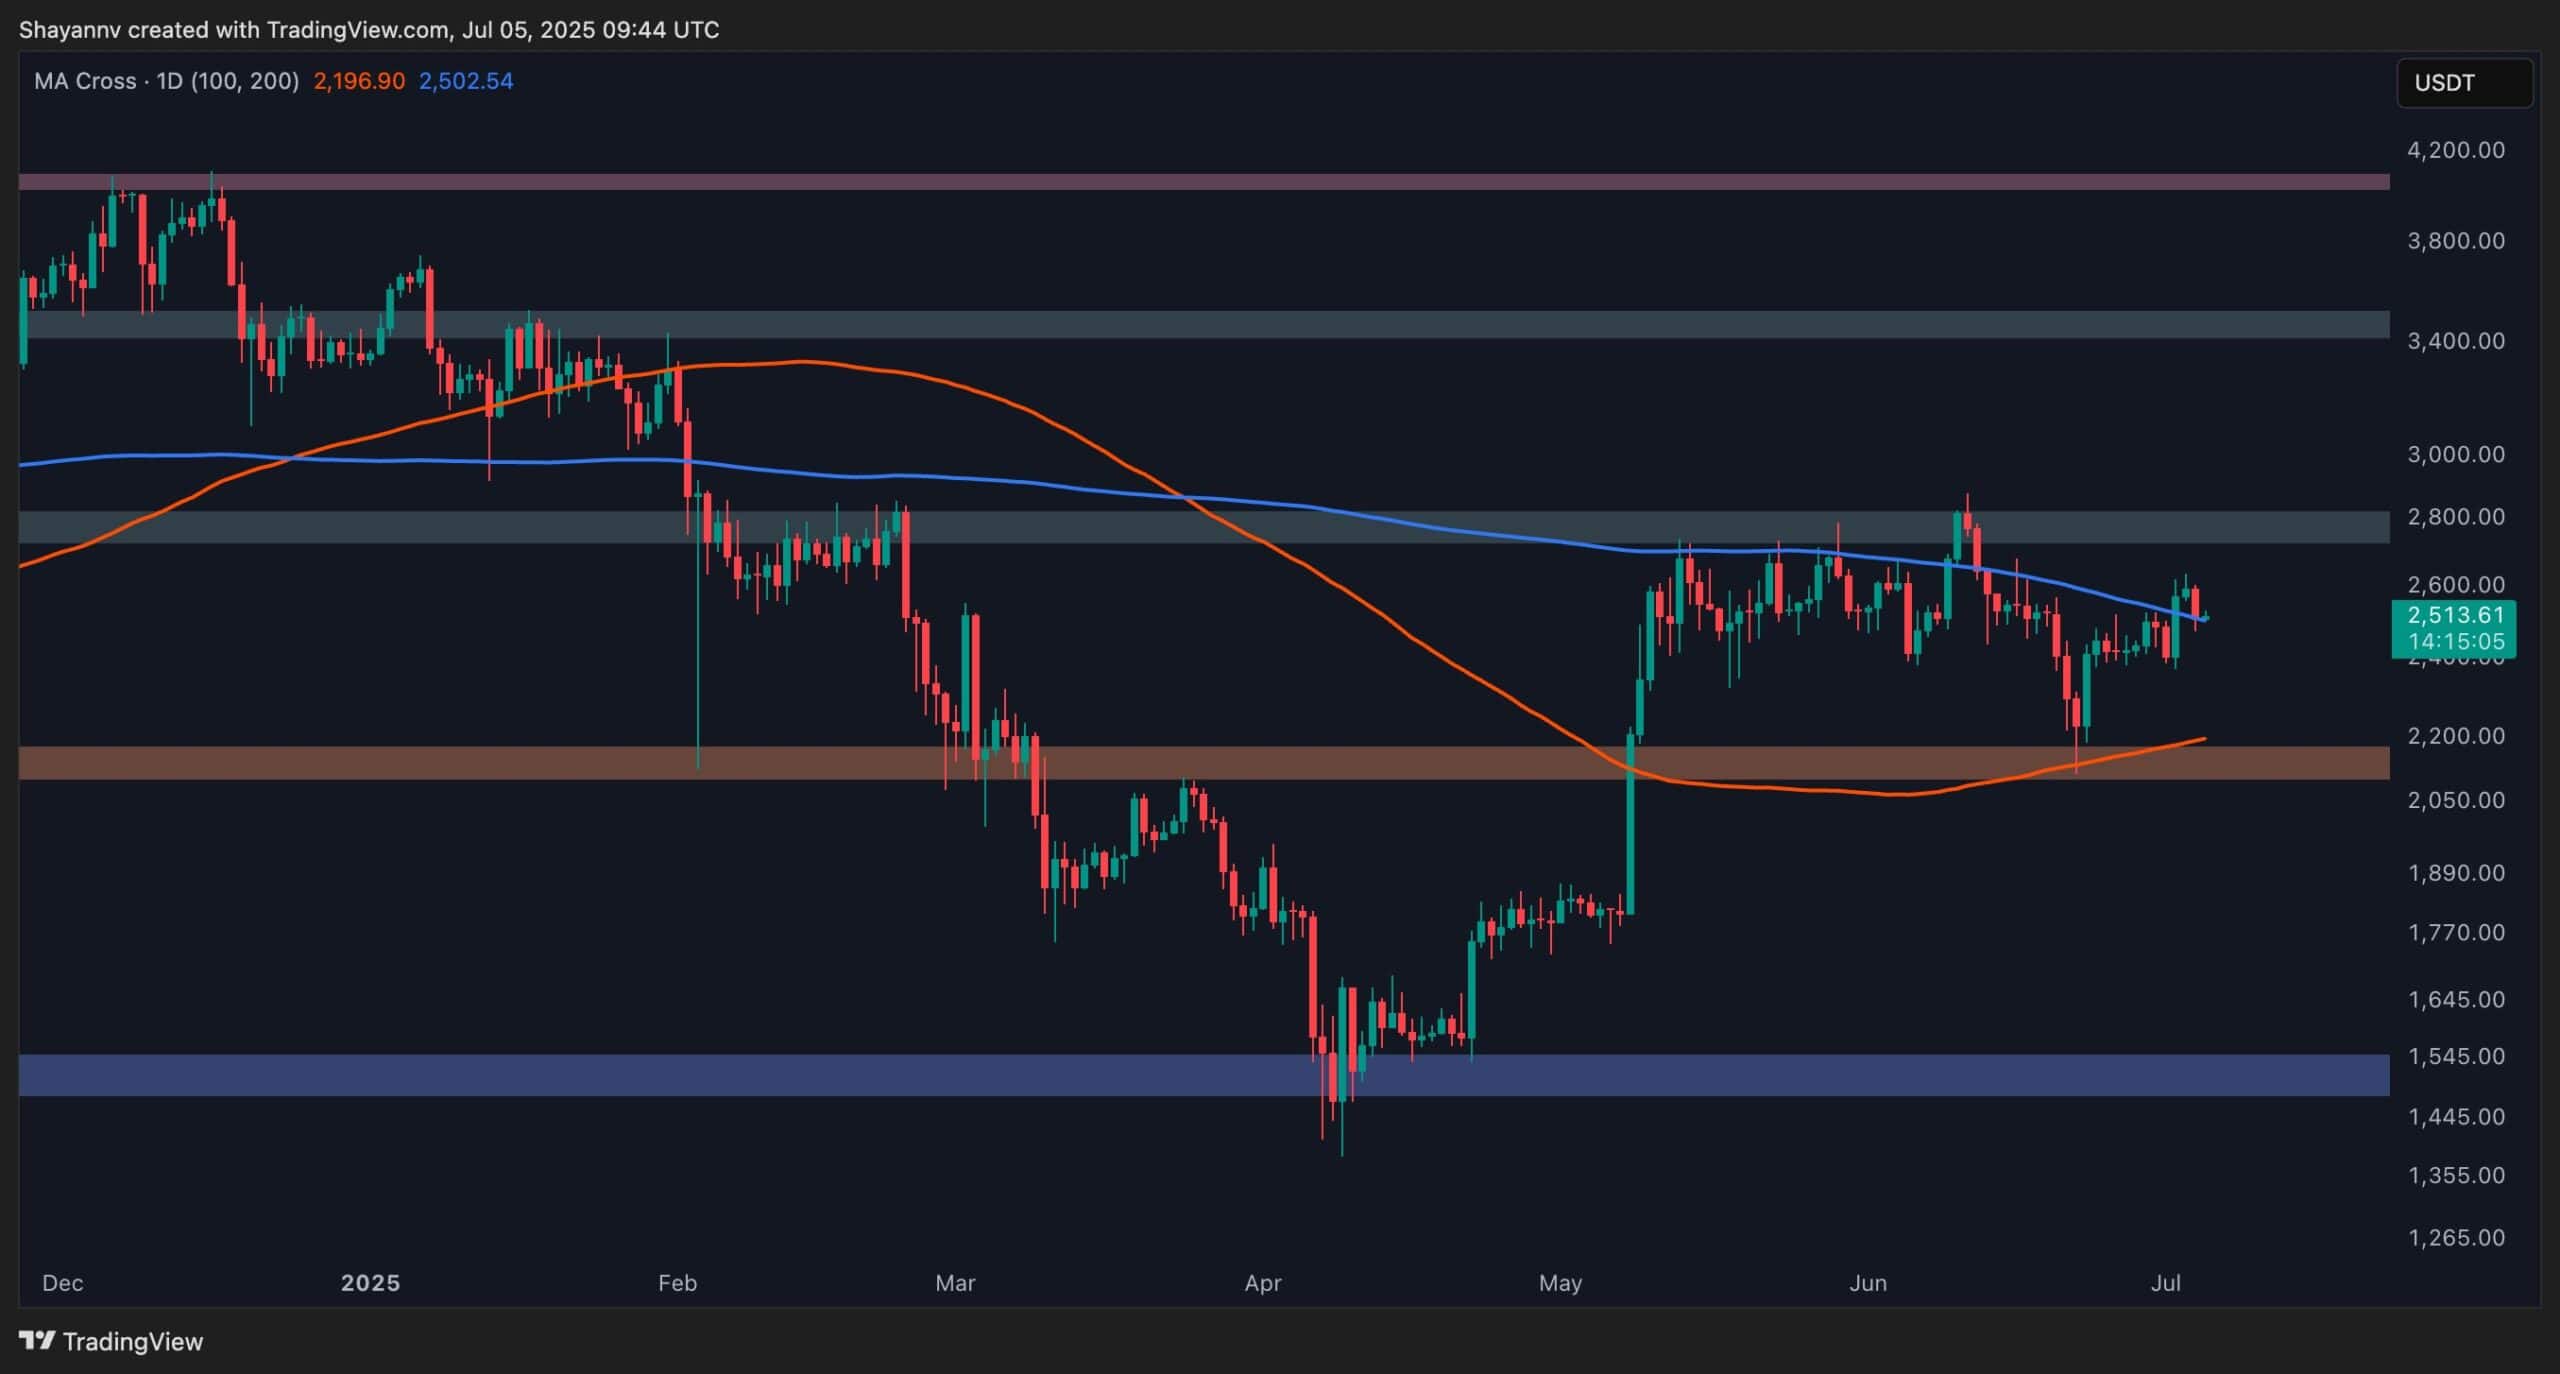
The Daily Chart
ETH is currently consolidating between the 100-day and 200-day moving averages, entering a decisive phase in its price action.
After breaking above the pivotal 200-day MA around $2.5K, an area that has acted as strong resistance in recent weeks, the price has pulled back to retest this level. This pullback is crucial: if bullish demand resurfaces and holds ETH above this moving average, it WOULD likely ignite another leg upward, targeting the $2.8K resistance zone.
For now, the cryptocurrency appears to be range-bound between $2.5K and $2.8K, and a clear breakout from this zone will likely set the stage for the next significant trend direction. Market participants are closely watching for a bullish continuation, which could solidify ETH’s reversal structure.
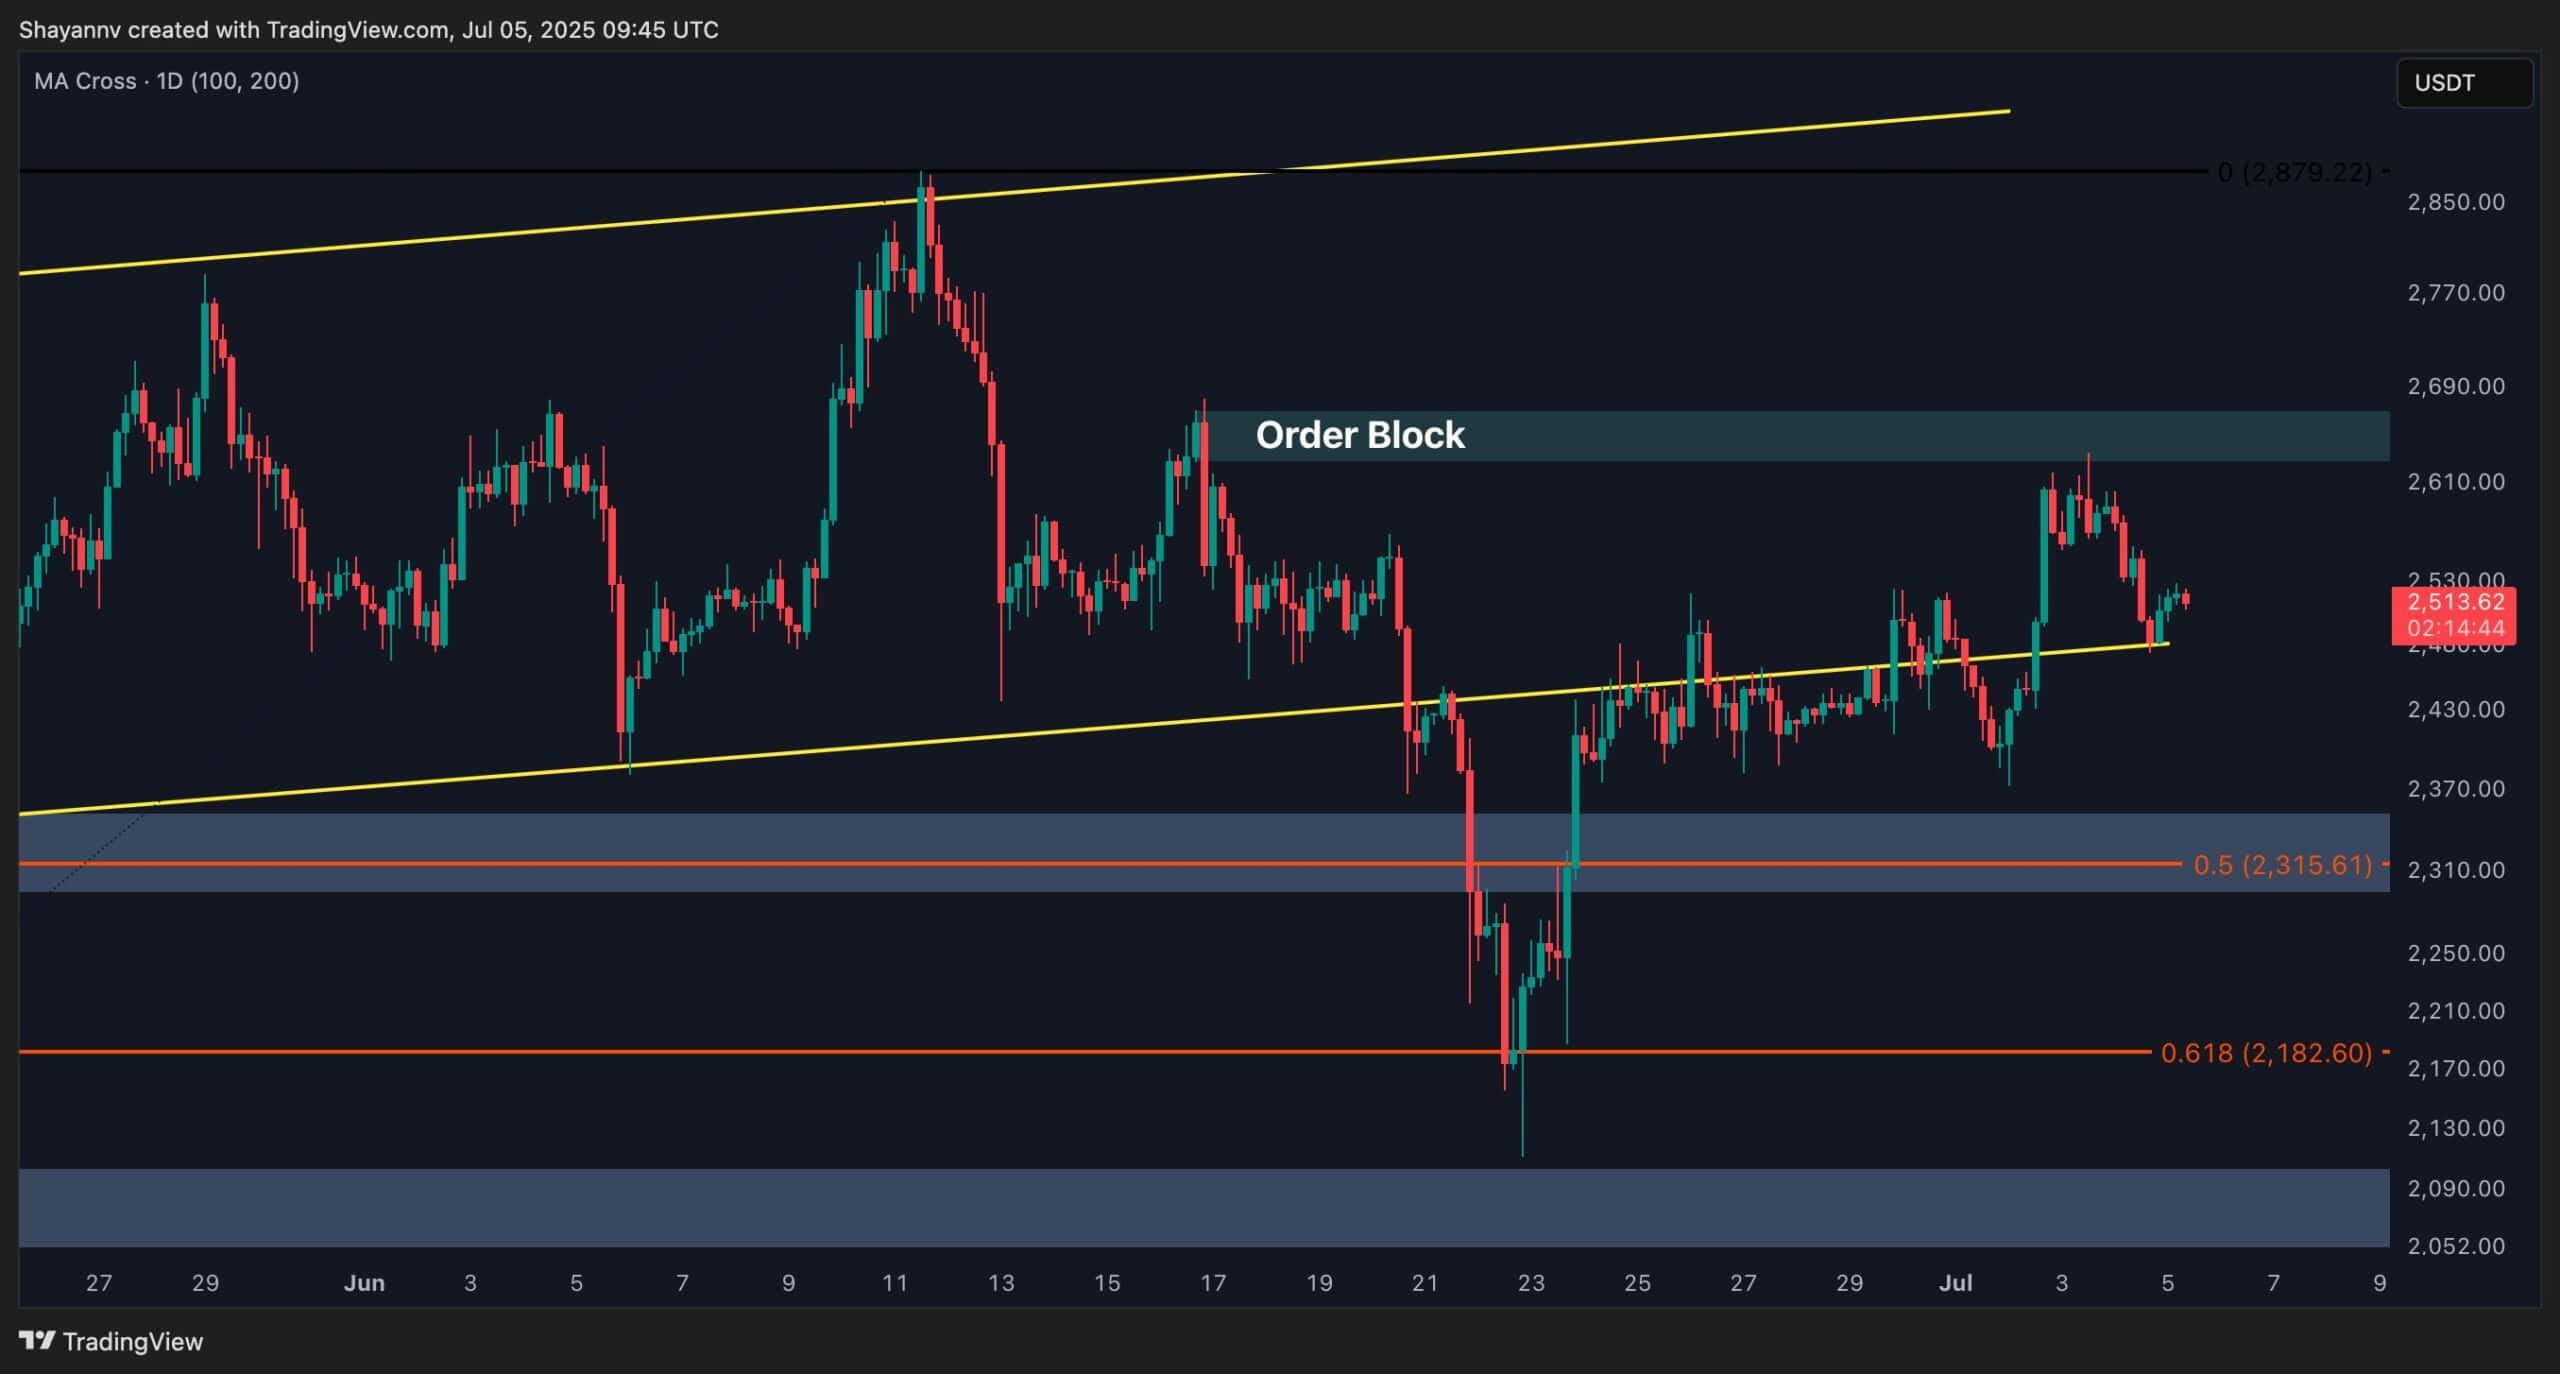
The 4-Hour Chart
On the lower timeframe, ETH’s recent rally encountered resistance at a key bearish order block between $2625 and $2670, where sellers re-entered the market. This rejection has pushed the price back toward the $2.5K support level, a historically significant zone for ETH.
This area now serves as a crucial battleground. If buyers manage to defend it, ethereum could regain momentum and reattempt a breakout above the overhead supply.
However, failure to hold $2.5K could trigger extended consolidation or even a retracement toward lower supports.
By Shayan
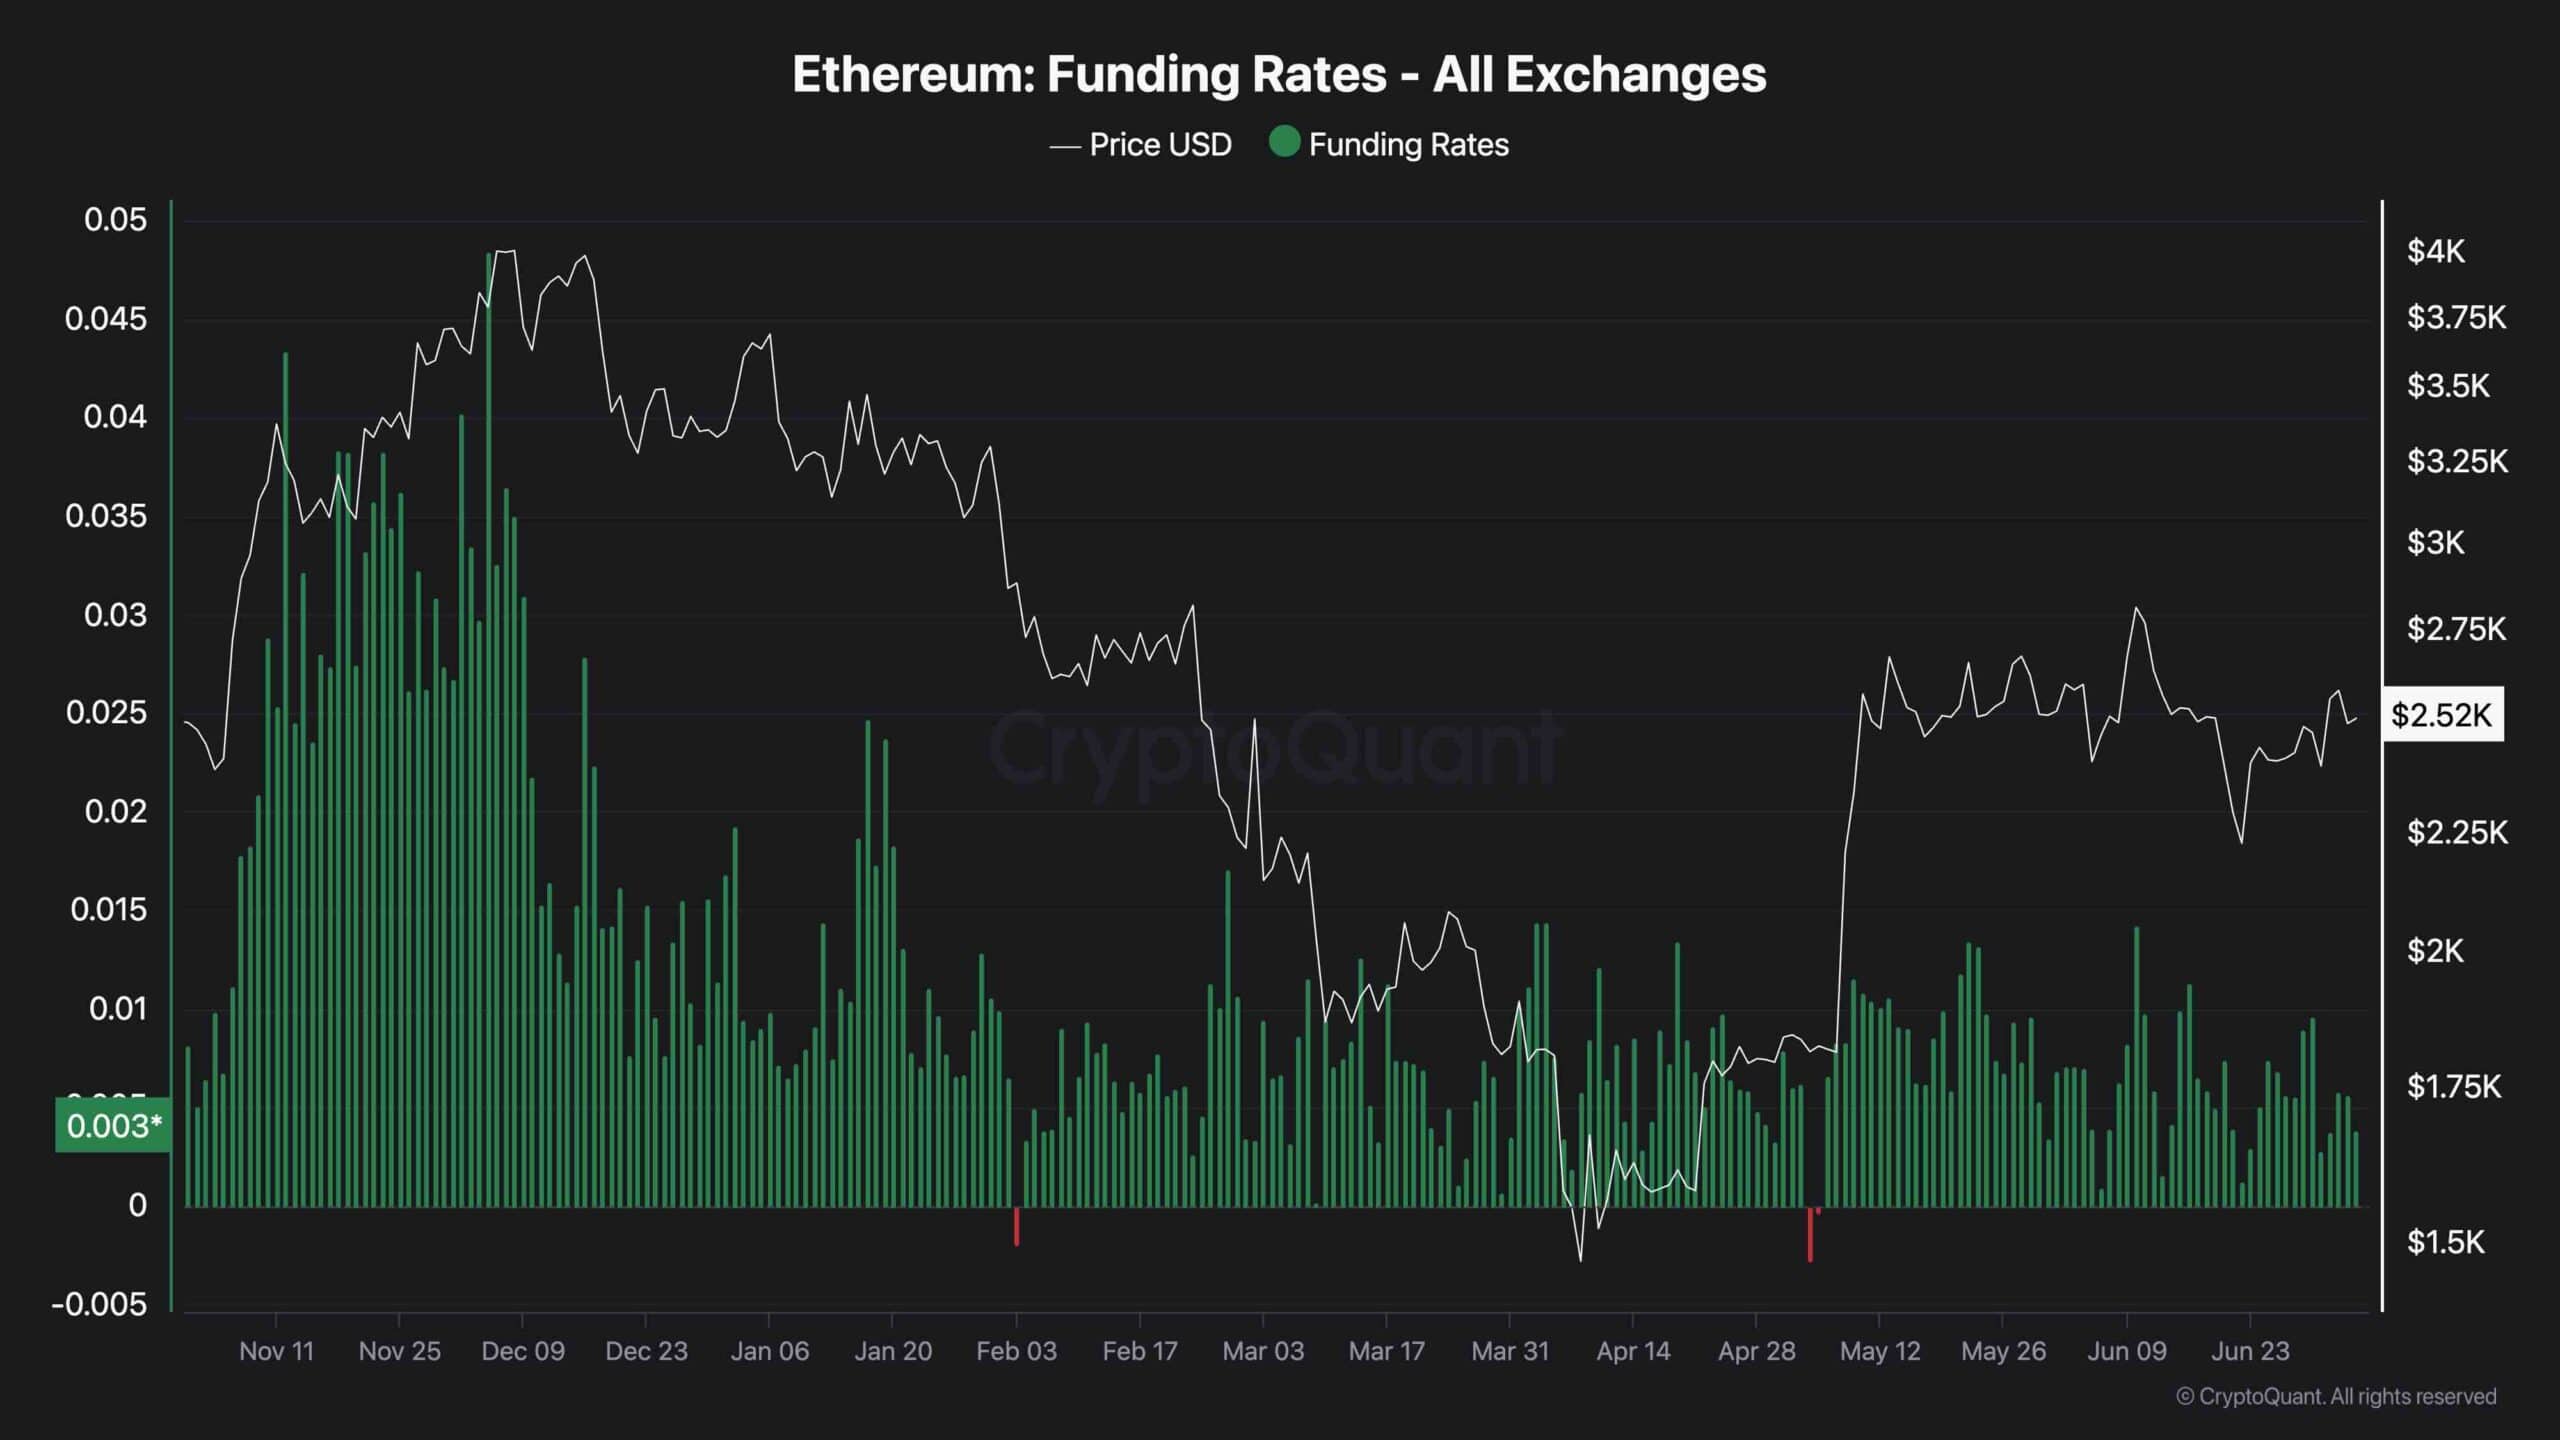
The funding rate remains a key indicator of market sentiment in Ethereum’s futures market. In a healthy uptrend, this metric typically trends upward, reflecting increasing confidence and positioning from long-biased traders in both spot and perpetual markets.
Currently, however, ETH’s funding rates have been declining amid price consolidation between the 100-day and 200-day moving averages. This suggests reduced bullish conviction and signs of buyer exhaustion, raising the likelihood of continued short-term sideways movement.
For Ethereum to break above the critical $2.6K and $2.8K resistance zones, stronger demand must flow into the derivatives market, lifting the funding rate to more positive levels. Until that shift materializes, the consolidation phase is likely to persist.