XRP Price Showdown: Will Ripple Hit $1.5 or Skyrocket to $3 First in 2025?

Ripple's XRP is at a crossroads—bulls and bears are locked in a battle for the next price breakout. Will the crypto asset claw its way to $1.5, or blast past resistance to $3? Here’s the breakdown.
The $1.5 Milestone: A Safe Bet or Slow Grind?
XRP’s recent consolidation hints at a push toward $1.5—if buyers can sustain momentum. But with institutional traders flip-flopping like politicians during election season, nothing’s guaranteed.
$3 or Bust: The Optimist’s Play
A surge to $3 isn’t just hopium—it’s mathematically possible if XRP mirrors past bull runs. Of course, that assumes the SEC doesn’t throw another regulatory grenade into the mix.
Final Take: XRP’s path hinges on macro sentiment, regulatory clarity (or lack thereof), and whether whales decide to pump—or dump. Place your bets, but maybe keep an exit strategy sharper than your average hedge fund manager’s suit.
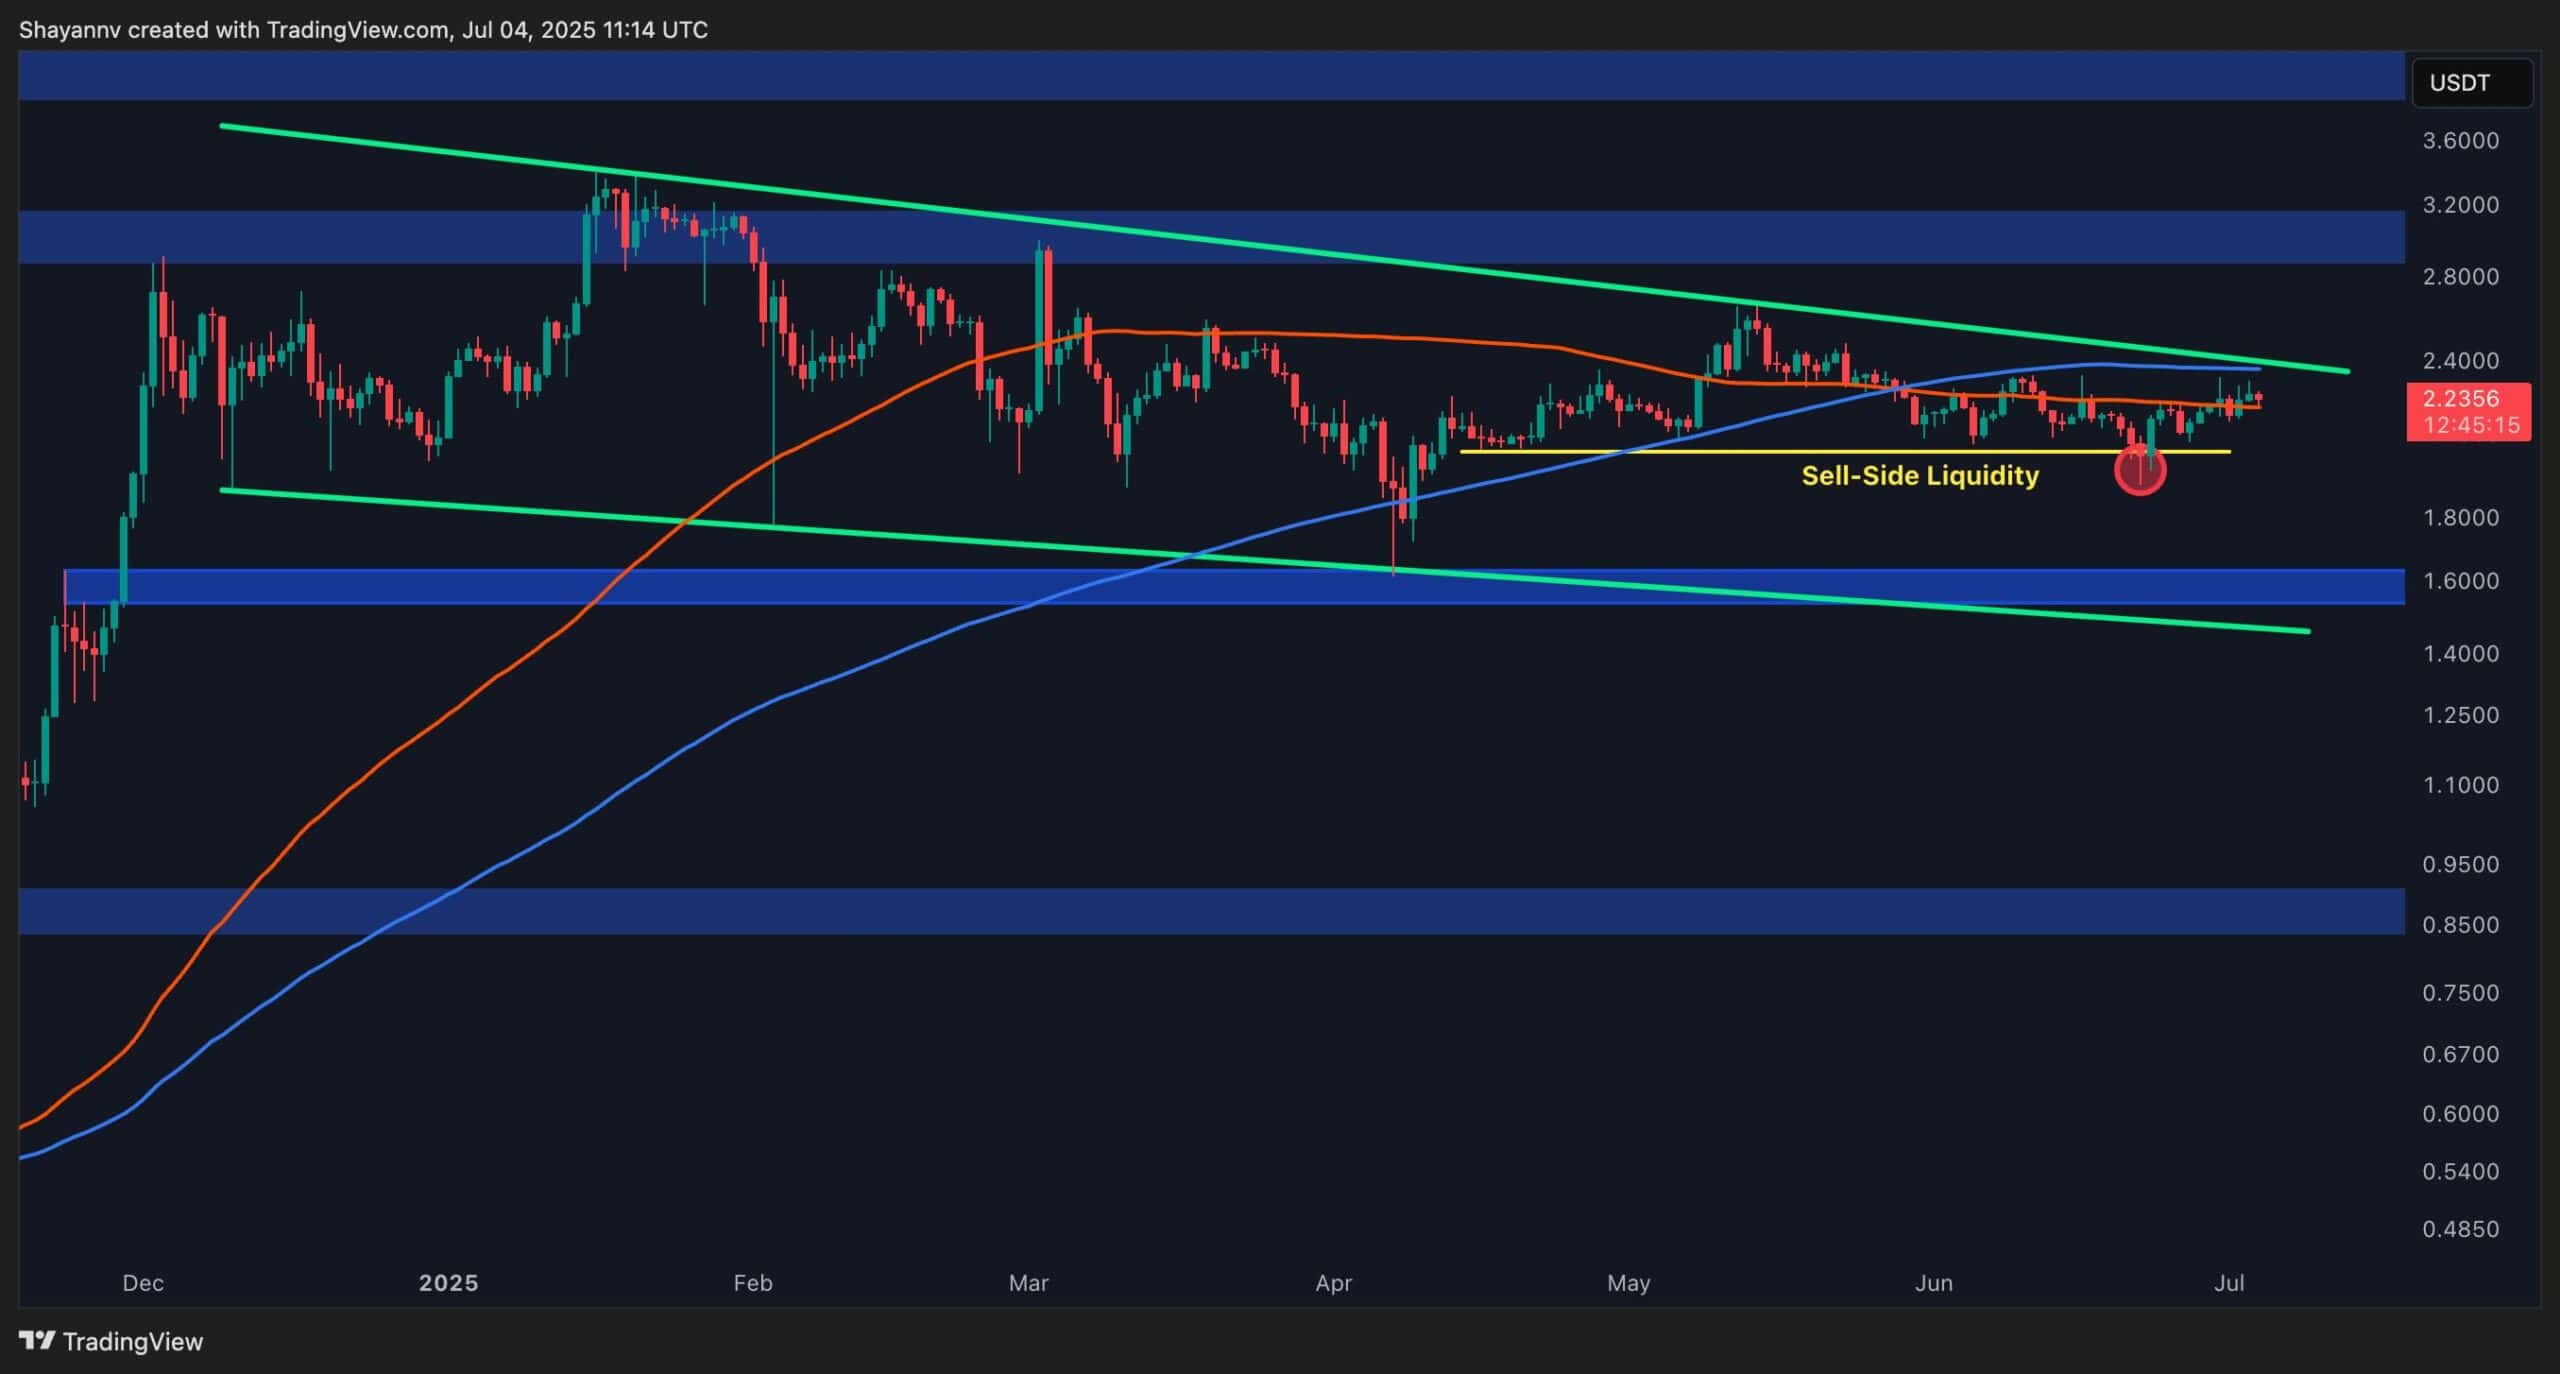
The USDT Pair
On the daily chart, XRP has bounced strongly after sweeping the sell-side liquidity below the $2 level. That sweep was followed by a strong bullish engulfing candle, signalling aggressive buying interest from that zone.
The price has since reclaimed the 100-day moving average and is currently testing the 200-day MA and the descending resistance of the multi-month descending channel around $2.40.
A clean breakout above this zone could open the door toward the $3 resistance cluster. If momentum continues, bulls may even eye a rally toward the major supply area NEAR $4.
However, failure to break this structure could result in another retracement back to the $1.60 demand zone. If that level breaks again without a new higher high, the structure WOULD remain bearish. The RSI at 58 is also neutral-bullish, supporting a short-term continuation move, but not yet signalling overbought conditions.
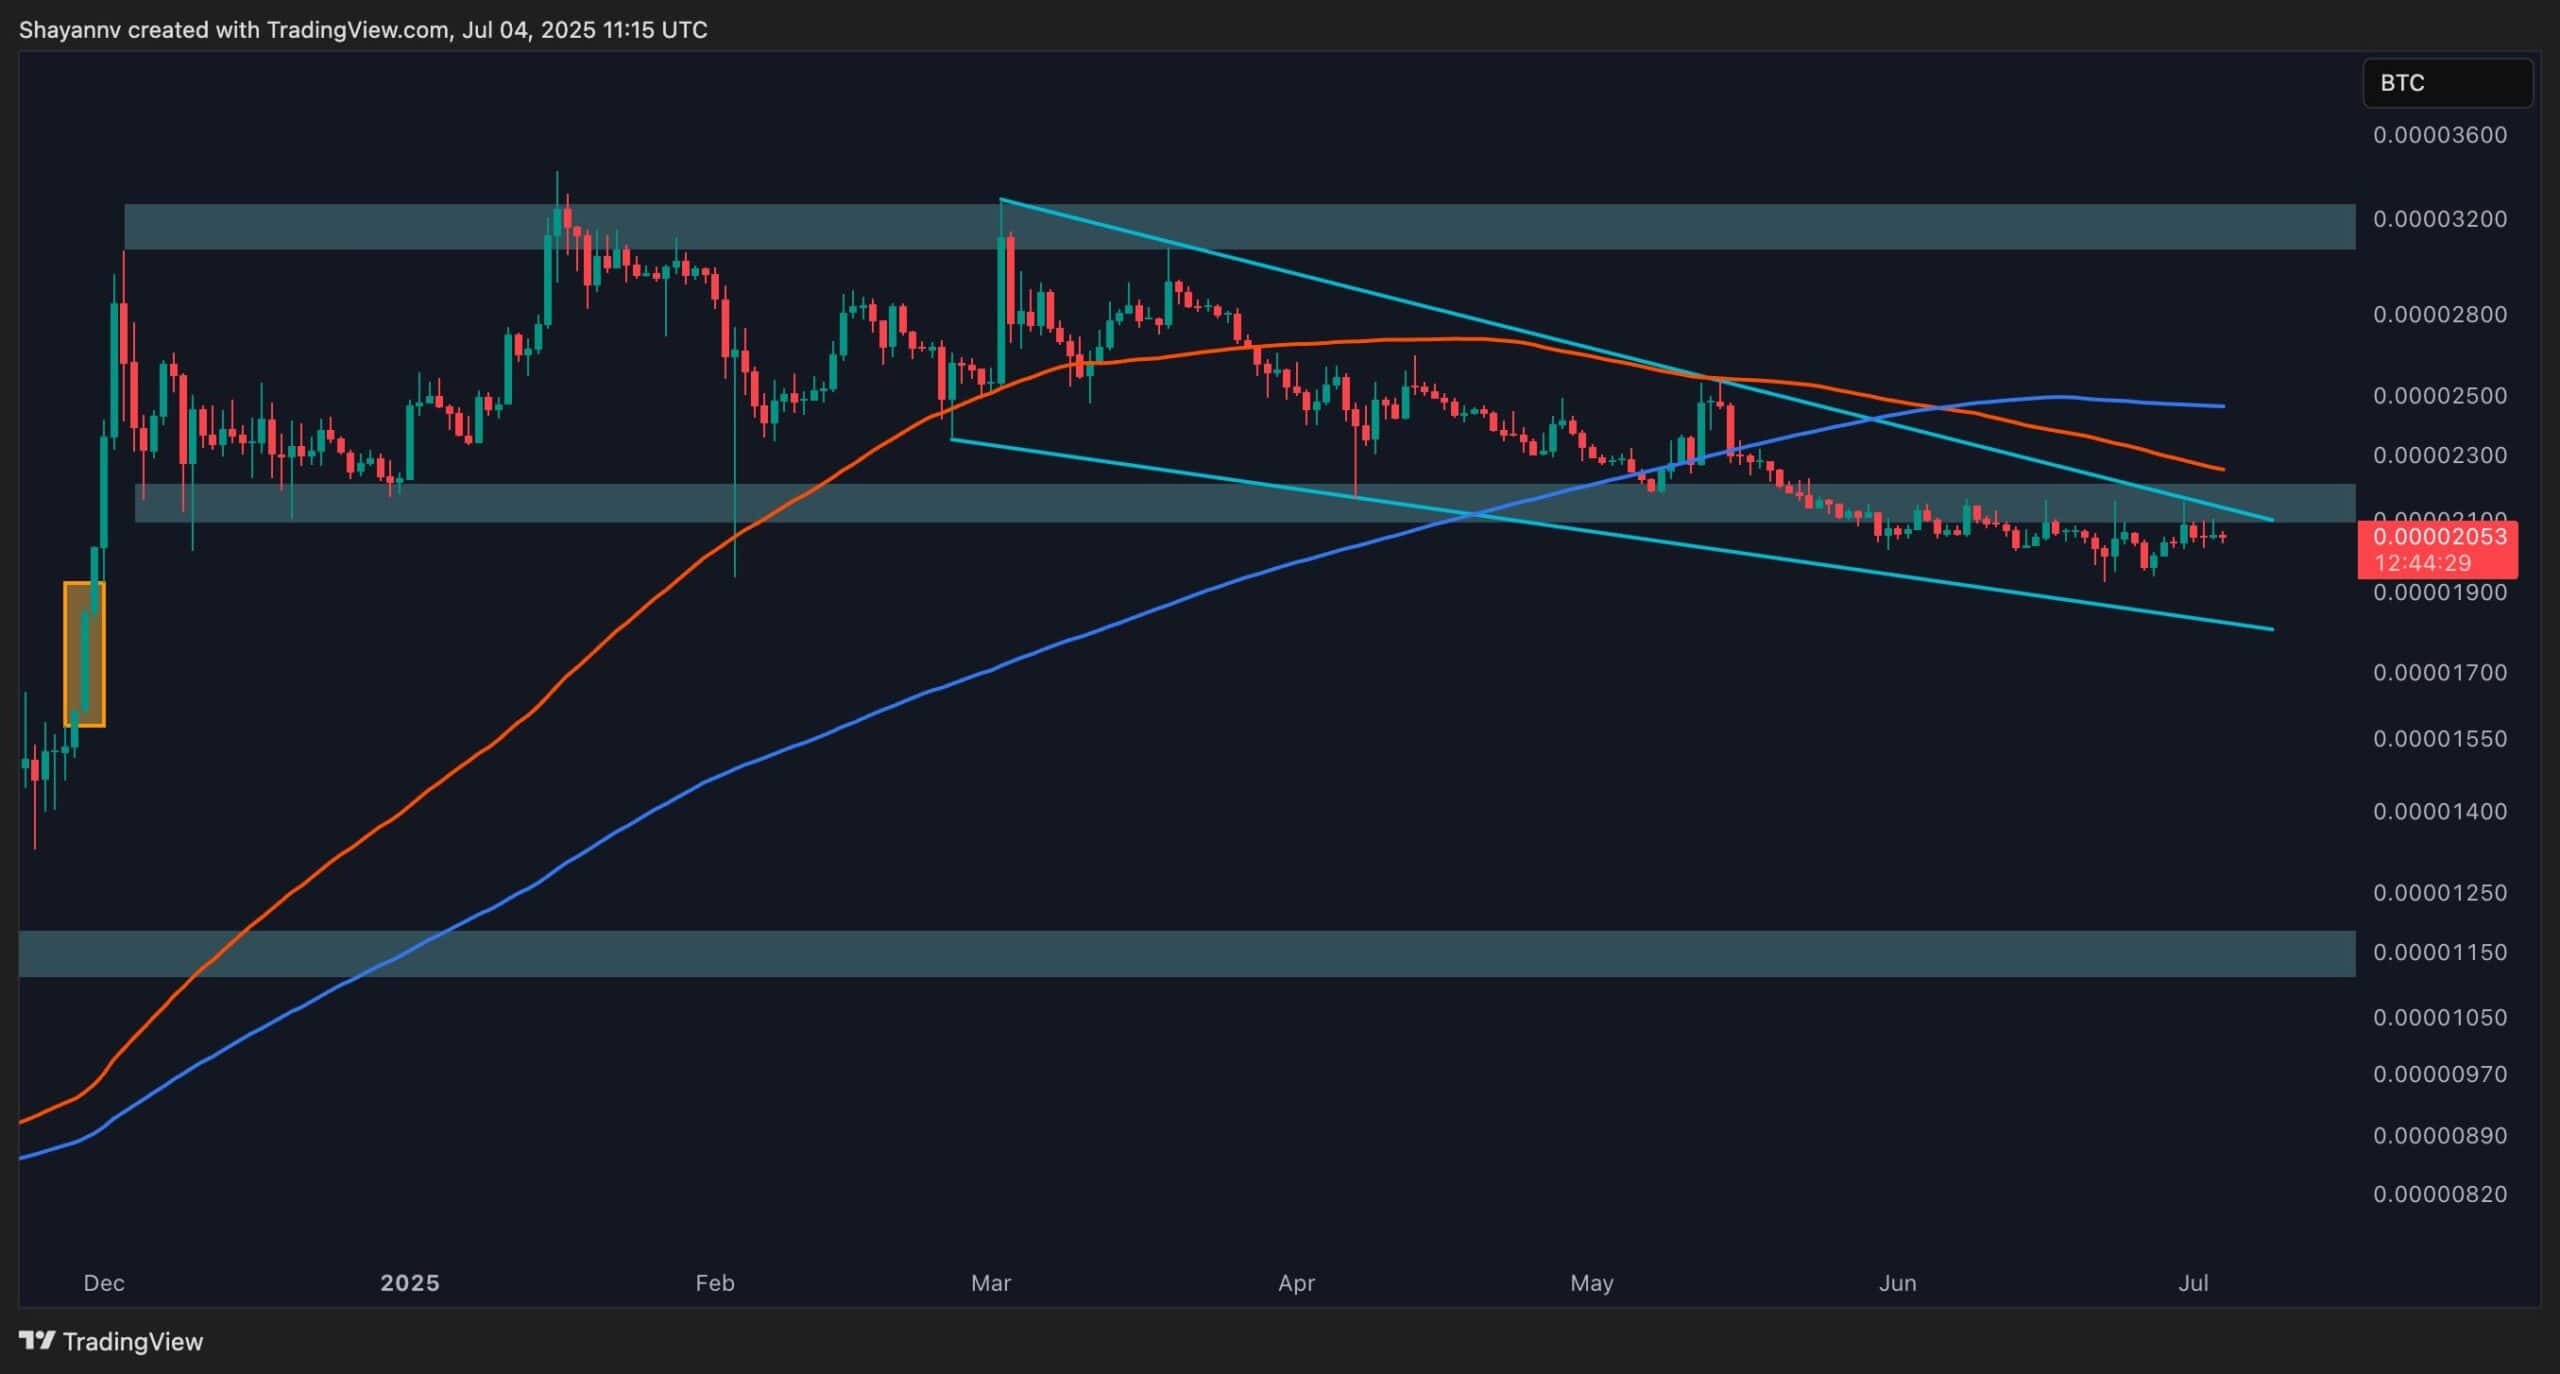
The BTC Pair
XRP/BTC is still trading inside the descending wedge and hasn’t confirmed a breakout yet. The pair is hovering just beneath the wedge’s upper boundary and the key resistance zone at 2100 SAT, which is just below the 100 and 200 EMAs.
Despite several attempts to push higher, it has failed to break and close above this confluence. Until that happens, the downtrend structure remains intact, and the wedge is still in play.
If a rejection follows, we could see another drop toward the lower boundary near 1800 SAT. Moreover, the RSI sitting around the neutral 50 level signals indecision, making a confirmed breakout or rejection crucial for the next move.